. 2019 Sep 27;10(1):4399.
doi: 10.1038/s41467-019-12382-4.

Miro clusters regulate ER-mitochondria contact sites and link cristae organization to the mitochondrial transport machinery

Affiliations

Miro clusters regulate ER-mitochondria contact sites and link cristae organization to the mitochondrial transport machinery

Souvik Modi et al. Nat Commun. .

Abstract

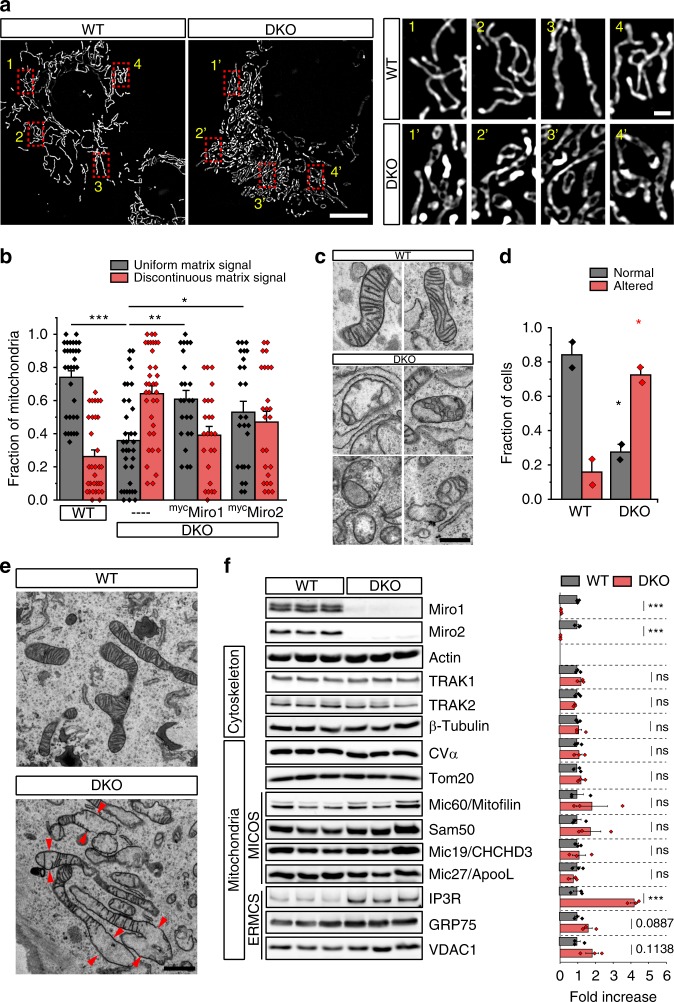
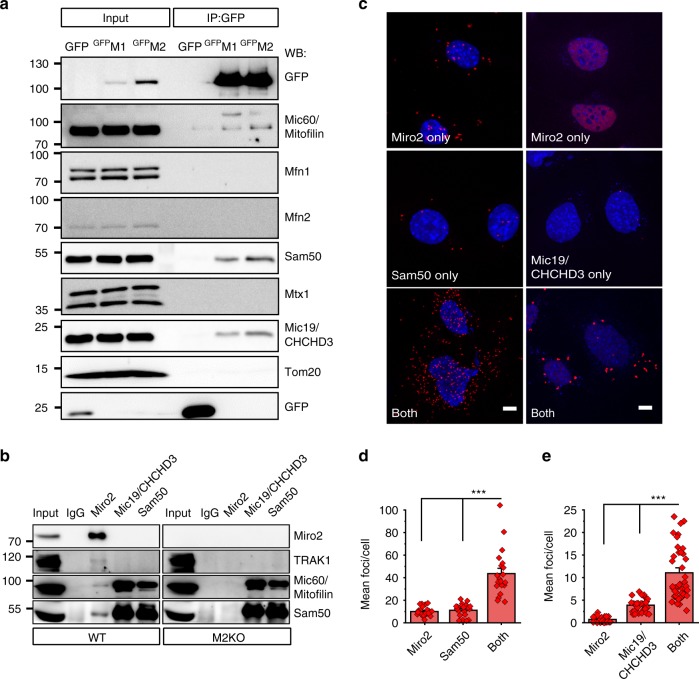
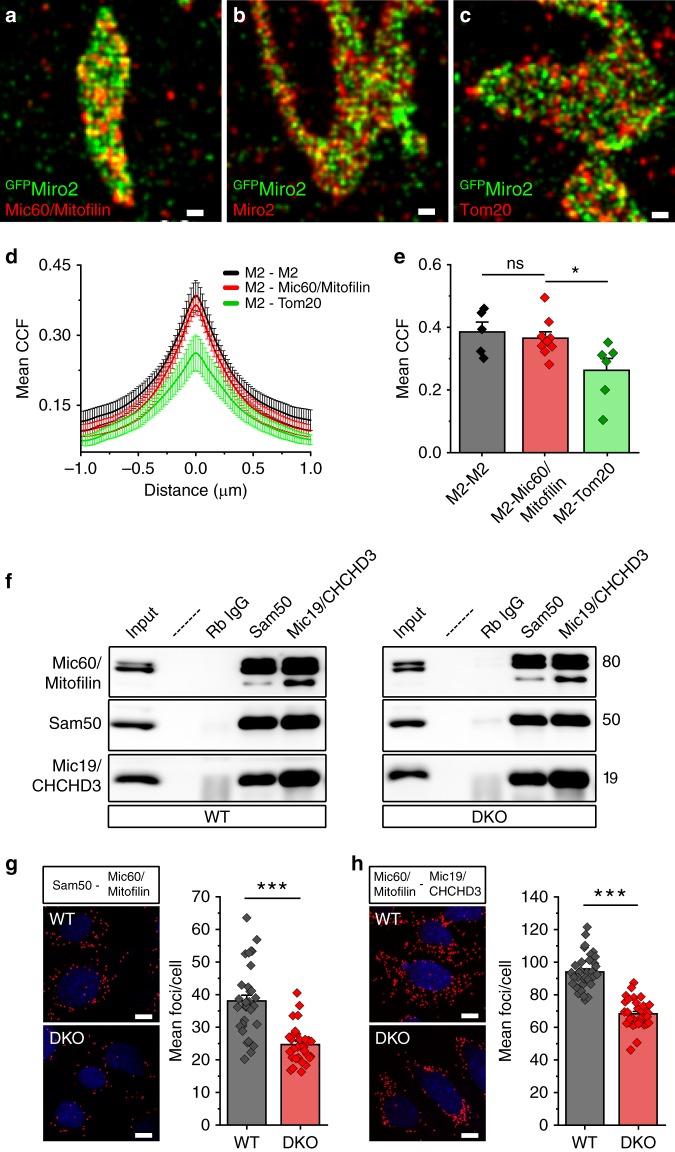
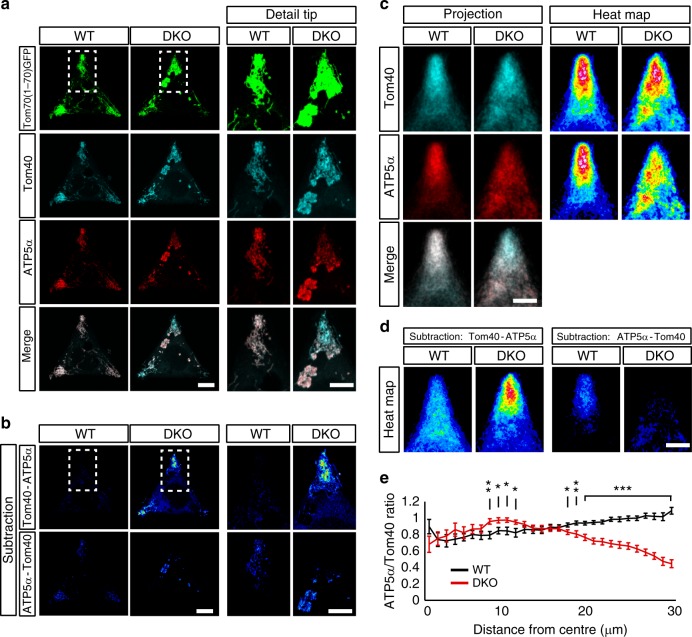
Mitochondrial Rho (Miro) GTPases localize to the outer mitochondrial membrane and are essential machinery for the regulated trafficking of mitochondria to defined subcellular locations. However, their sub-mitochondrial localization and relationship with other critical mitochondrial complexes remains poorly understood. Here, using super-resolution fluorescence microscopy, we report that Miro proteins form nanometer-sized clusters along the mitochondrial outer membrane in association with the Mitochondrial Contact Site and Cristae Organizing System (MICOS). Using knockout mouse embryonic fibroblasts we show that Miro1 and Miro2 are required for normal mitochondrial cristae architecture and Endoplasmic Reticulum-Mitochondria Contacts Sites (ERMCS). Further, we show that Miro couples MICOS to TRAK motor protein adaptors to ensure the concerted transport of the two mitochondrial membranes and the correct distribution of cristae on the mitochondrial membrane. The Miro nanoscale organization, association with MICOS complex and regulation of ERMCS reveal new levels of control of the Miro GTPases on mitochondrial functionality.


Conflict of interest statement

The authors declare no competing interests.

Figures

Fig. 1
Fig. 1
Loss of Miro is associated with altered cristae morphology. a Imaging of the mitochondrial matrix with mtRoGFP. WT and Miro DKO MEF cells were transfected with the mitochondrial matrix-targeted mtRoGFP and imaged using structured illumination microscopy (SIM) (scale bar: 10 μm; insets: 1 μm). b Quantification of the images shown in (a) by scoring abnormalities in matrix continuity revealed by GFP in WT, DKO, and DKO cells re-expressing Miro proteins (n = cells; in which 32 WT, 35 DKO, 24 DKO re-expressing Miro1 and 25 DKO re-expressing Miro2 cells were assessed, obtained from three independent preparations; One-way ANOVA, Bonferroni post hoc). c TEM images of mitochondrial cristae morphologies observed in WT and Miro DKO MEFs (scale bar: 500 nm). d Quantification of TEM images after classification of the cells as having normal cristae morphology or an altered cristae morphology (n = experiments; in which 54 WT and 51 Miro DKO cells were analyzed from two independent sample preparations; Student’s t test with Welch’s correction). e Representative EM images of the mitochondria from WT and DKO cells showing the homogeneity of cristae in WT cells and the appearance of spaces and enlargement of mitochondrial units in regions without cristae in DKO cells (scale bar: 1 μm). f Western blot analysis and quantification of three different cell lines independently generated for each genotype (n = independently generated cell lines; three for WT and three for DKO; Student’s t test) to analyze cellular levels of proteins related to the cytoskeleton, MICOS complex, and ERMCS. Error bars represent ± SEM. Significance: *p < 0.05; **p < 0.01; ***p < 0.001
Fig. 2
Fig. 2
Miro control ER/mitochondria communication by regulating the number of ERMCS. a FRAP analysis of ER dynamics measured in MEF cells transfected with DsRedER (scale bar: 2 μm). b Quantification of images shown in (a). Inset: expanded region of first 12 s of the recovery after bleaching (fraction of recovery at 4 s: WT ~0.47 ± 0.01, DKO ~0.42 ± 0.01, p = 0.0010; and after 6 s: WT ~0.63 ± 0.01, DKO ~0.59 ± 0.01, p = 0.0311; Student’s t test with Welch’s correction; n = cells; in which 37 WT and 38 DKO cells were analyzed from three independent experiments). c Representative images of MEF cells expressing GFPSu9 and DsRedER (scale bar: 10 μm). d Quantification of Mander’s coefficient between the ER and mitochondria from (c) (n = cells; in which 40 WT, 45 DKO, 47 DKO re-expressing Miro1, and 46 re-expressing Miro2 cells were used from three independent experiments; one-way ANOVA, Bonferroni post hoc). e Electron micrographs of the mitochondria and ER in WT and DKO cells expressing an HRP construct fused to an ER retention signal (KDEL). Yellow asterisks depict the mitochondria; red arrows point to the ER/mitochondria close contacts (< 35 nm). A magnified view from the WT image depicts close contacts between the ER and mitochondria (scale bar: 200 nm). f Quantification of ERMCS in TEM images (n = cell; in which 22 WT and 23 DKO cells were used, from two independent sample preparations; Student’s t test with Welch’s correction). g Agonist induced Ca2+ release from the ER and subsequent mitochondrial Ca2+ uptake. Arrow indicates addition of agonist ATP (n = 49 WT and 41 DKO cells for the mitochondria and n = 47 WT and 39 DKO cells for ER were analyzed from five independent experiments; Student’s t test with Welch’s correction). h Rise time (calculated from baseline to maximum amplitude after addition of ATP) in WT and DKO cells (n = cells; in which 49 WT and 41 DKO cells from five independent experiments were analyzed; Mann–Whitney’s U test). Error bars represent ± SEM. Significance: *p < 0.05; **p < 0.01; and ***p < 0.001
Fig. 3
Fig. 3
Miro proteins are a component of the MICOS complex. a Miro proteins interact with MICOS complex proteins. Western blot analysis of GFPMiro protein complexes from HeLa cells were analyzed in SDS-PAGE for several MICOS components. b Co-immunoprecipitation of Miro2 with endogenous MICOS complex proteins. Immunoprecipitation was performed from WT and Miro2 KO brains, and western blot was performed with different antibodies against MICOS complex proteins. Approximately 2% of total cell lysate used for immunoprecipitation was loaded for inputs. c Proximity ligation assay (PLA) between Miro2 and OMM protein Sam50 (left panel) as well as PLA between Miro2 and the MICOS-specific protein Mic19/CHCHD3 (right panel). The nucleus is shown in blue (DAPI), and PLA assay products are shown in red (scale bar: 5 μm). d, e Quantification of the experiments shown in (c); (for (d) n = 23 images with only Miro2 antibody, 20 images for only Sam50 antibody, and 20 images with both antibodies and for (e) n = 27 images with only Miro2 antibody, 29 images for only Mic19/CHCHD3 antibody and 44 images with both antibodies, both from three independent experiments; One-way ANOVA, Bonferroni post hoc). Error bars represent ± SEM. Significance: ***p < 0.001
Fig. 4
Fig. 4
Sub-organellar localization of Miro proteins in the mitochondria. a Widefield TIRF image of a representative HeLa cell overexpressing mycMiro1 and immunostained with anti-myc antibody. Inset shows the super-resolution image after structured illumination (SIM) (scale bar: 10 μm; inset: 1 μm). b dSTORM image of HeLa cells transfected with GFPMiro1, GFPMiro2, or GFPSu9. Both Miro1 and Miro2 localize to nanometer-sized clusters on the mitochondrial surface (scale bar: 5 μm; inset: 0.5 μm). c Density-based spatial clustering of applications with noise (DBSCAN) analysis of GFPMiro1 and GFPMiro2. Clustered localizations are represented by pseudo-color coding with localizations that are nonclustered is represented as gray pixels (scale bar: 0.5 μm). d Mean Ripley’s K-function analysis of GFPMiro1 (Red) and GFPMiro2 (Black). Transformed K-function (L(r)-r) is represented against increasing cluster radius. The homogeneous Poisson distribution of the localizations is shown in blue (n = cells; in which 13 Miro2 and 9 Miro1 cells from three independent experiments were used). e Size distribution of clusters formed by GFPMiro1 and GFPMiro2, respectively, in HeLa cells. After reconstruction of dSTORM images, mean Feret’s diameter was measured using ImageJ and plotted. Red line represents localization precision of the dSTORM setup (median Feret’s diameter; GFPMiro1 = 108 nm ± 85–162 nm and GFPMiro2 = 95 nm ± 67–150 nm; mean ± IQR; n = 7 Miro2 cells compromising 23707 clusters and 7 Miro1 cells compromising 22876 clusters, from three independent measurements). f Western blot analysis of Miro1 and Miro2 interaction. HeLa cells were transfected with GFP as a control or GFPMiro 1/2 and mycMiro1/2. Immunoprecipitation was carried out using GFP-trap agarose beads and immunoblotted with GFP and myc antibodies
Fig. 5
Fig. 5
Miro nanodomains associate with MICOS clusters. ac Dual color dSTORM imaging of GFPMiro2-transfected HeLa cells. GFPMiro2 nanometer-sized domains are shown (anti-GFP : green) together with endogenous Mic60/Mitofilin (a) a positive control for Miro2 (b; anti-Miro2 antibody) and negative control for Tom20 (c), (scale bar: 0.2 μm). d Cross-correlation analysis between Miro2 and Mic60; Miro2 and GFPMiro2 and Miro2 and Tom20 and e Mean Van Steensel’s cross-correlation coefficient between GFPMiro2 and the different immunostainings calculated from (d) and plotted (n = cells; in which 5 GFPMiro2-Miro2, 9 Miro2-Mic60/Mitofilin, and 6 Miro2-Tom20 cells from three independent measurements were used; One-way ANOVA, Bonferroni post hoc). f Endogenous immunoprecipitation experiment in WT and DKO cells using antibodies against the core-forming MICOS components (Mic19/CHCHD3, Mic60/Mitofilin and Sam50). The main interactions are not to be critically affected. g, h Proximity ligation assay (PLA) and quantification in WT and DKO cells between Sam50 and Mic60/Mitofilin (g) and between Mic60/Mitofilin and Mic19/CHCHD3 (h) show a mild decrease in the association between these components (n = cells; in which 34 cells were used per condition from three independent experiments; Student’s t test with Welch’s correction), (scale bar: 10 μm). Error bars represent ± SEM. Significance: *p < 0.05; ***p < 0.001
Fig. 6
Fig. 6
Altered distribution of MICOS in Miro DKO cells due to the loss of cytoskeletal anchorage. a Distribution of MICOS (Mic19/CHCHD3) clusters along the mitochondrial membrane in WT and DKO cells. Pseudo-colored representation of reconstructed dSTORM images of MICOS complexes (scale bar: 0.5 μm). b DBSCAN cluster map of Mic19/CHCHD3 clusters. DKO cells show the areas with depletion of clusters in comparison with WT cells (scale bar: 0.5 μm). c Quantification of nearest neighbor distances between MICOS clusters present in WT and DKO cells. Histogram of all the observed distances between MICOS clusters are shown. (WT: 8 cells, DKO: 11 cells comprising > 30,000 NND; p < 0.001, Kolmogorov–Smirnov’s test). d Endogenous immunoprecipitation experiment in WT and DKO cells using antibodies against the core-forming MICOS components (Mic19/CHCHD3, Mic60/Mitofilin, and Sam50) and antibodies against the TRAK motor adaptors. TRAK proteins interact with critical MICOS components in a Miro-dependent manner. e Mic19/CHCHD3-positive MICOS clusters in WT distribute homogeneously in the mitochondrial population in WT MEFs, while the loss of Miro proteins correlates with an increase in heterogeneity in the distribution, with cells showing mitochondrial units almost devoid of Mic19/CHCHD3 signal (white arrows), (scale bar: 10 μm; insets: 5 μm). f Overexpressing TRAK1 and KIF5C induces the redistribution of the mitochondria to the periphery. In WT cells, this redistribution correlates with increased Mic19/CHCHD3 signal in the periphery (cyan arrows), (scale bar: 10 μm; insets: 5 μm). In DKO cells, TRAK1/KIF5C redistribution enhances the heterogeneity of Mic19/CHCHD3 staining, indicating a transport-mediated uncoupling of OMM and IMM in Miro DKO cells. Mitochondria with low Mic19/CHCHD3 signal concentrates in the TRAK1/KIF5C anterogradely transported mitochondria (white arrows), while Mic19/CHCHD3 signal accumulate in the proximal—not transported—mitochondria (cyan arrows)
Fig. 7
Fig. 7
Miro links the microtubule transport pathway to the MICOS complex through TRAK. a Quantification of the distribution of OMM and IMM components upon TRAK1/KIF5C overexpression in micropatterned substrates. WT and MiroDKO cells expressing the Tom70(1–70)GFP together with the mitochondrial motor machinery TRAK1/KIF5C were grown in “Y”-shaped micropatterns to produce triangular cells. Cells were immunostained for endogenous expression of an OMM marker (Tom40: cyan) and an IMM marker (ATP5α: red), (scale bar: 10 μm; insets: 5 μm). b Cell representations of the relative accumulations of the OMM marker Tom40 (subtraction of the ATP5α signal from the Tom40 signal; upper row) and the IMM marker ATP5α (subtraction of the Tom40 signal from the ATP5α signal, bottom row) (scale bar: 10 μm; insets: 5 μm). c Projections of all the 76 cell tips that contained the mitochondria and generation of mitochondrial probability maps. In WT cells, both OMM and IMM markers are similarly distributed, while in the Miro DKO cells the OMM marker is preferentially accumulated in the most distal regions compared with the IMM which accumulates in more proximal regions (scale bar: 5 μm). d Projections from the 76 subtracted images (for each genotype) were generated as in (b) (scale bar: 5 μm). e Mitochondrial probability map to quantify the ratio between the normalized signals of OMM (Tom40) and IMM (ATP5α) components as a function of the distance from the center of the cell (see Supplementary experimental procedures for details). All experiments were performed three independent times. Quantification and statistics in (e) were performed with 32 cells for each genotype (n = cells; Student's t test was performed at each distance point). Error bars represent ± SEM. Significance: *p < 0.05; **p < 0.01; and ***p < 0.001

References

    1. Tait SW, Green DR. Mitochondria and cell signalling. J. Cell Sci. 2012;125:807–815. doi: 10.1242/jcs.099234. - DOI - PMC - PubMed
    1. Rizzuto R, De Stefani D, Raffaello A, Mammucari C. Mitochondria as sensors and regulators of calcium signalling. Nat. Rev. Mol. Cell Biol. 2012;13:566–578. doi: 10.1038/nrm3412. - DOI - PubMed
    1. MacAskill AF, Kittler JT. Control of mitochondrial transport and localization in neurons. Trends Cell Biol. 2010;20:102–112. doi: 10.1016/j.tcb.2009.11.002. - DOI - PubMed
    1. Macaskill AF, et al. Miro1 is a calcium sensor for glutamate receptor-dependent localization of mitochondria at synapses. Neuron. 2009;61:541–555. doi: 10.1016/j.neuron.2009.01.030. - DOI - PMC - PubMed
    1. Birsa N, Norkett R, Higgs N, Lopez-Domenech G, Kittler JT. Mitochondrial trafficking in neurons and the role of the Miro family of GTPase proteins. Biochemical Soc. Trans. 2013;41:1525–1531. doi: 10.1042/BST20130234. - DOI - PubMed

Publication types

MeSH terms