. 2019 Sep 27;10(1):4408.
doi: 10.1038/s41467-019-12315-1.

TFF3 interacts with LINGO2 to regulate EGFR activation for protection against colitis and gastrointestinal helminths

Affiliations

TFF3 interacts with LINGO2 to regulate EGFR activation for protection against colitis and gastrointestinal helminths

Nicole Maloney Belle et al. Nat Commun. .

Abstract

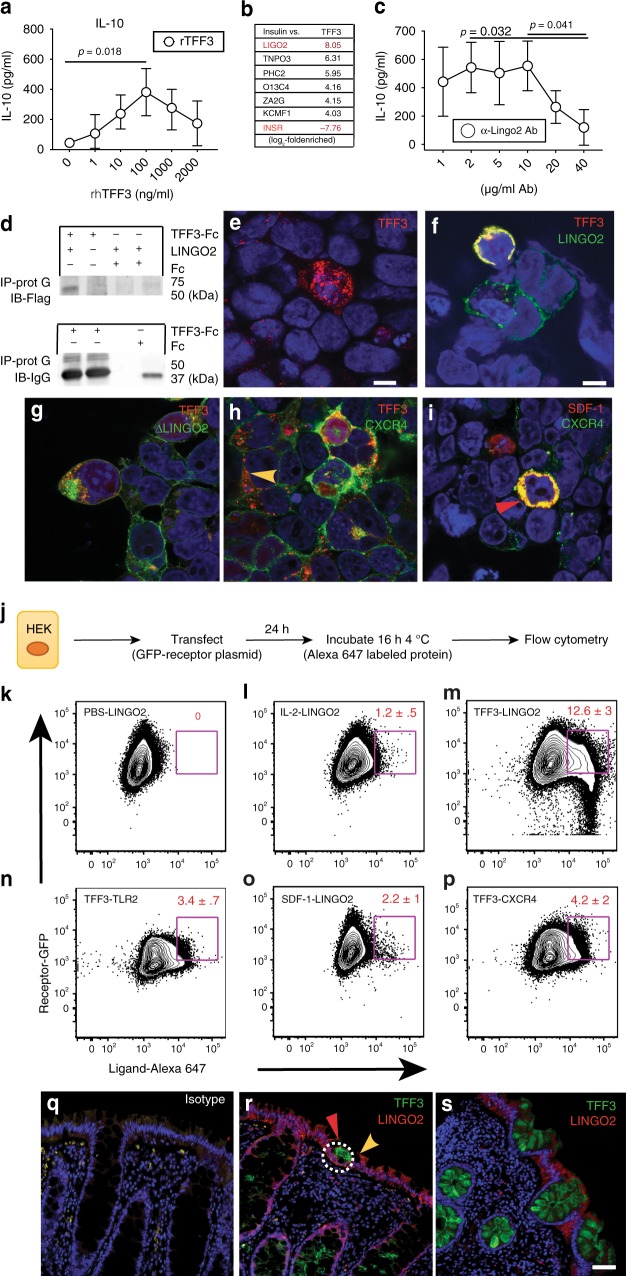
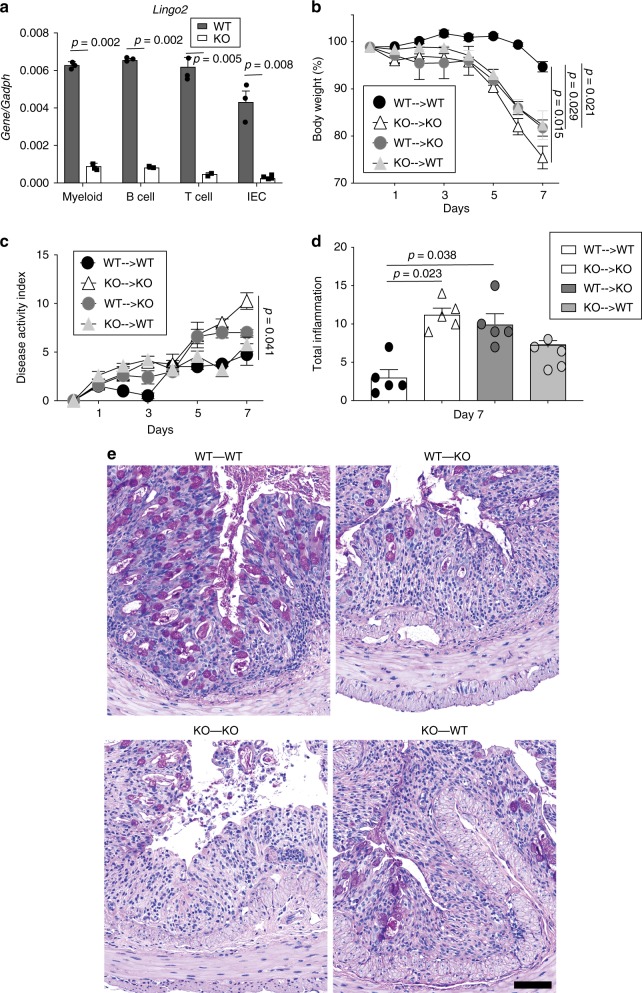
Intestinal epithelial cells (IEC) have important functions in nutrient absorption, barrier integrity, regeneration, pathogen-sensing, and mucus secretion. Goblet cells are a specialized cell type of IEC that secrete Trefoil factor 3 (TFF3) to regulate mucus viscosity and wound healing, but whether TFF3-responsiveness requires a receptor is unclear. Here, we show that leucine rich repeat receptor and nogo-interacting protein 2 (LINGO2) is essential for TFF3-mediated functions. LINGO2 immunoprecipitates with TFF3, co-localizes with TFF3 on the cell membrane of IEC, and allows TFF3 to block apoptosis. We further show that TFF3-LINGO2 interactions disrupt EGFR-LINGO2 complexes resulting in enhanced EGFR signaling. Excessive basal EGFR activation in Lingo2 deficient mice increases disease severity during colitis and augments immunity against helminth infection. Conversely, TFF3 deficiency reduces helminth immunity. Thus, TFF3-LINGO2 interactions de-repress inhibitory LINGO2-EGFR complexes, allowing TFF3 to drive wound healing and immunity.


Conflict of interest statement

The authors declare no competing interests.

Figures

Fig. 1
Fig. 1
Identification of LINGO2 as a putative receptor for TFF3. a IL-10 secretion from the human macrophage cell line U937 in response to different rhTFF3 concentrations. Representative of two independent experiments. Means ± SE of quadruplicate wells are shown. b Mass spectrometry fold-enrichment peptide score following TRICEPS screen of U937 cells exposed to rhTFF3. c IL-10 produced by U937 following overnight treatment with rTFF3 in the presence of anti-human LINGO2 mAb. Means ± SE of quadruplicate wells with results of paired two-tailed t test are shown. Representative of two independent experiments. d Immunoprecipitation of LINGO2-Flag with either affinity purified TFF3-Fc or Fc only using protein A followed by immunoblotting with anti-Flag Ab (upper blot) or anti-IgG (lower blot). e Representative photomicrographs of HEK-293 cells single transfected with TFF3-RFP or f co-transfected with TFF3-RFP and LINGO2-GFP vectors, g co-transfected with TFF3-RFP and NH2-terminal Flag-LINGO2 truncation mutant (Δ350 AA), h co-transfected with TFF3-RFP and CXCR4-GFP or (i) CXCR4-GFP and SDF-1-RFP. j Schematic of flow cytometry-based strategy to detect doubly fluorescent HEK cells following transfection with GFP labeled receptors and incubation with Alexa 647-labeled soluble protein ligands. k Representative flow cytometry dot plots showing the percentage of double positive cells following incubation of GFP-LINGO2 transfectants with PBS l IL-2-647, or m TFF3-647. n Double positive HEK following incubation of TLR2-GFP transfectants with TFF3-647, o with SDF-1-647 or p CXCR4-GFP transfectants with SDF-1-647. Data represent three independent experiments with mean ± SE and results of paired two-tailed t test shown. q Representative immunofluorescence images of rectosigmoid biopsy tissue samples from normal human subjects following co-staining with IgG isotype mAb or two different human subjects with anti-TFF3 mAb and anti-LINGO2 mAb (20×) (r, s). Scale bar represents 40 μm
Fig. 2
Fig. 2
TFF3 requires LINGO2 to block cytotoxicity, regulate STAT3 and de-repress EGFR activation. a LINGO family mRNA transcript levels in the MC38 mouse intestinal cell line. Mean ± SE of 3–6 replicates are shown. b Gating strategy for FACS-sorting based isolation of CRISPR/CAS9 gene-edited MC38 cells via incorporation of the LINGO2-H2-KK knock-in construct designated as “Δ-LINGO2” c Lingo2 mRNA transcript levels in Δ-LINGO2 MC38 cells as determined by QRT-PCR. Mean ± SE of triplicate wells. d Staurosporine-induced cytotoxicity at 6 h-post exposure of MC38 vs. Δ-LINGO2 cells following exposure to Fc (1 μg/mL) or TFF3-Fc (1 μg/mL or 23.81 nM) in DMEM 1% FBS. Mean ± SE of triplicate wells. e Time-course of phospo-EGFR (Y-1068) vs. total EGFR levels compared to beta-actin loading control in MC38 vs. Δ-LINGO2 cells exposed to Fc vs. TFF3-Fc (1 μg/mL). f Reciprocal co-immunoprecipitation of LINGO2-Flag and EGFR-GFP in co-transfected HEK293 cells. IP was performed with anti-Flag followed by IB with anti-GFP (left) or IP with anti-GFP followed by IB with anti-Flag (right). g mRNA expression levels of Amphiregulin (Areg) and h Epiregulin (Ereg) compared to Gapdh in parental MC38 vs Δ-LINGO2 cells following exposure to either media alone or rEGF (1 μg/mL) Mean ± SE of triplicate wells shown. i Phospho-EGFR (Y-1068) and total EGFR levels in parental MC38 vs Δ-LINGO2 at baseline or after stimulation with rEGF (1 μg/mL). j Co-IP of LINGO2-Flag and EGFR-GFP complexes in the presence of media only, soluble rIL-2, or rTFF3. k Kinetic analysis of cellular turnover for parental MC38 vs. Δ-LINGO2 cells in the presence or absence of the EGFR inhibitor Gefitinib (5  μM) treatment. Mean ± SE of six replicates are shown. Results of unpaired two-tailed t tests shown as p values in c, d, g, h and two-way ANOVa analyses in k
Fig. 3
Fig. 3
LINGO2/EGFR axis controls DSS colitis severity. a Western blot showing phospo-EGFR (Y-1068) vs. total EGFR levels compared to beta-actin loading control in small intestinal lysates from individual WT vs. Lingo2KO mice. Each lane is an individual mouse b H&E stained colon tissue from naive WT and Lingo2KO mice. Magnification ×40, scale bar 10 μm. c Serum levels of FITC-Dextran in WT vs Lingo2KO mice 4 h after oral gavage. d Percentage of small intestinal crypt cells per high power field that stained double positive for E-cadherin and Ki-67 in naive WT vs Lingo2KO mice. Mean ± SE of two independent experiments with the results of unpaired two tailed t tests shown. e Schematic of DSS treatment protocol. f Percent change from initial body weight caused by DSS administration at 2.5% w/v in cohorts of WT versus Lingo2KO mice. g Disease activity index (DAI) clinical scores in WT versus Lingo2KO mice from mice in f. Mean ± SE of 8–10 mice/group are shown. h H&E (left) and PAS (right) stain for WT and Lingo2KO rectum 11 days post 2.5% DSS treatment. Representative images are shown. Magnification ×4 (left) scale bar 100 μm and ×40 (right) scale bar 10 μm. i Change in initial body weight and j clinical inflammation score in WT versus Lingo2KO mice post 2.5% DSS with or without Gefitinib treatment. Means ± SE of 8, 9 or 10 mice/group are shown. k, l Colon length in WT versus Lingo2KO- mice at day 11 post 2.5% DSS with or without Gefitinib. Means ± SE of 8, 9 or 10 mice/group and the results of two-way ANOVA analyses are shown
Fig. 4
Fig. 4
Non-hematopoietic and hematopoietic cells contribute to LINGO2-mediated protection from DSS colitis. a RT-PCR quantification of Lingo2 mRNA transcript levels in myeloid, B cell, T cell and intestinal epithelial cells isolated using magnetic beads from WT and Lingo2KO mice n = 3/group. Representative of two experiments with results of unpaired two tail t tests shown. b Change in initial body weight and c disease activity index and d clinical pathology inflammation score in colon tissues from irradiation bone marrow chimeras at 4 days following cessation of 2.5% DSS administration for donor-recipient combinations WT → WT, Lingo2KO- → Lingo2KO, WT → Lingo2KO, Lingo2KO- → WT. Mean ± SE of 4 or 5 mice/group and results of two-way ANOVA analyses are shown. e Representative photomicrograph images at ×20 showing H&E stained colon tissues from irradiation bone marrow chimeras in (bd). Scale 40 μm
Fig. 5
Fig. 5
TFF3 deficiency in mice does not increase susceptibility to DSS colitis. a Change in initial body weight, b disease activity index scores and c colon lengths following DSS administration in cohorts of co-housed WT versus Tff3KO mice. d Gefitinib treatment protocol during DSS administration. e Change in initial body weight, f disease activity index, g colon lengths and h colonic Egf mRNA transcript levels at time of sacrifice in WT vs. Tff3KO cohoused mice following 2.5% DSS treatment with or without Gefitinib. Means ± SE of 8, 9 or 10 mice/group and results of two-way ANOVA analyses are shown
Fig. 6
Fig. 6
A TFF3-LINGO2-EGFR axis controls host-immunity against hookworm infection. a Diagram of N. brasiliensis infection life cycle in mice. b Tff3 mRNA transcript levels in jejunum of WT C57BL/6 mice infected with 750 N. b. L3 Data show mean ± SE of 3 or 4mice/group. c Intestinal adult worm numbers in WT vs. Tff3KO mice at day 9 post-infection each symbol represents an individual mouse. d Secretion of IL-4, IL-5, IL-13 and IFN-γ levels from WT vs. Tff3KO mesenteric lymph node cells isolated at day 9 post-infection. Cytokine levels in response to media alone, anti-CD3 (1 μg/ml or N. b. crude adult extract (10 μg/ml) at 48 h. Experiment performed twice n = 4–5 mice/group. e Intestinal worm numbers at day 4 post-infection 9 days post infection with N. brasiliensis in WT versus Lingo2KO mice. Mean ± SE of 5 mice/group are shown Representative of four independent experiments. f Fecal egg numbers, shown as eggs per gram feces (EPG) in WT vs. Lingo2KO mice at days indicated. g IL-9 and h IL-13 production from isolated MLN on day 9 exposed to media or N. brasiliensis antigen extract. i Egg load in feces on day 7 from WT → Lingo2KO versus Lingo2KO → WT BM chimera mice at day 4 post infection. Means ± SE of 3 or 4 mice/group are shown. j Western blot showing intestinal levels of phospho-EGFR and total EGFR in mice at day 9 post-infection. Each represents an individual mouse. k Densitometry for data shown in j. l Adult worm burdens recovered from intestinal lumen at day 9 from WT and Lingo2KO mice treated with Gefitinib or vehicle during infection with N. b. infection. Means ± SE of 9 or 10 mice/group are shown. P values shown represent the results of unpaired two tail t tests except for l where two-way ANOVA analyses are shown

Similar articles

Cited by

References

    1. Farrell CL, et al. The effects of keratinocyte growth factor in preclinical models of mucositis. Cell Prolif. 2002;35(Suppl 1):78–85. doi: 10.1046/j.1365-2184.35.s1.8.x. - DOI - PMC - PubMed
    1. Gibson RJ, et al. The effect of keratinocyte growth factor on tumour growth and small intestinal mucositis after chemotherapy in the rat with breast cancer. Cancer Chemother. Pharm. 2002;50:53–58. doi: 10.1007/s00280-002-0460-4. - DOI - PubMed
    1. Salvati VM, et al. Keratinocyte growth factor and coeliac disease. Gut. 2001;49:176–181. doi: 10.1136/gut.49.2.176. - DOI - PMC - PubMed
    1. Egger B, et al. Keratinocyte growth factor ameliorates dextran sodium sulfate colitis in mice. Dig. Dis. Sci. 1999;44:836–844. doi: 10.1023/A:1026642715764. - DOI - PubMed
    1. Miyoshi H, et al. Prostaglandin E2 promotes intestinal repair through an adaptive cellular response of the epithelium. EMBO J. 2017;36:5–24. doi: 10.15252/embj.201694660. - DOI - PMC - PubMed

MeSH terms