

12 new susceptibility loci for prostate cancer identified by genome-wide association study in Japanese population
- PMID: 31562322
- PMCID: PMC6764957
- DOI: 10.1038/s41467-019-12267-6
12 new susceptibility loci for prostate cancer identified by genome-wide association study in Japanese population
Abstract
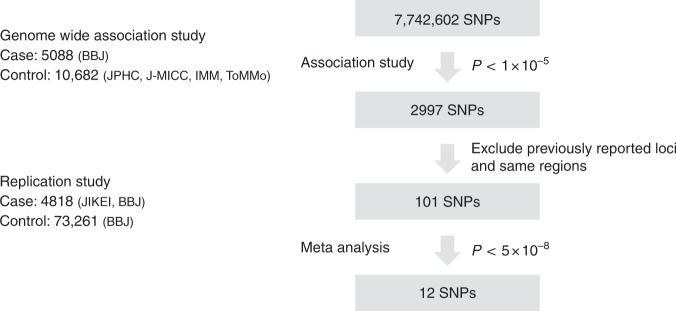
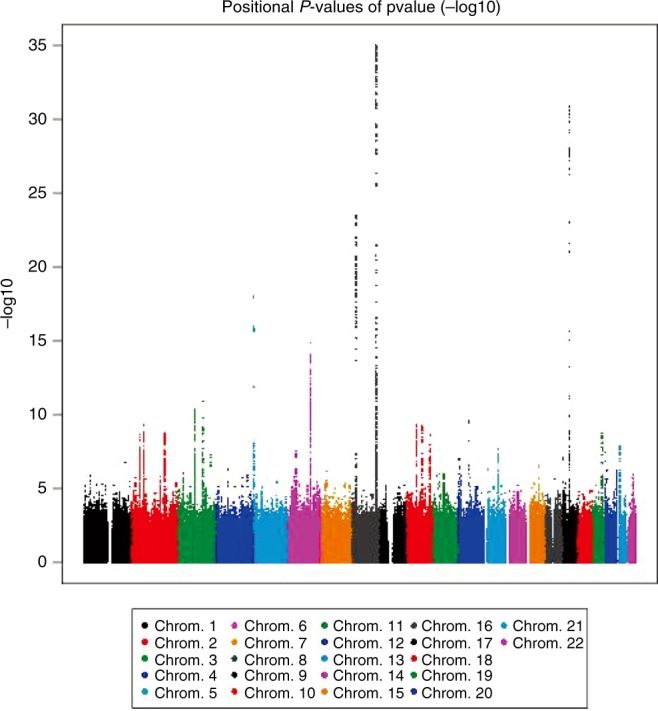
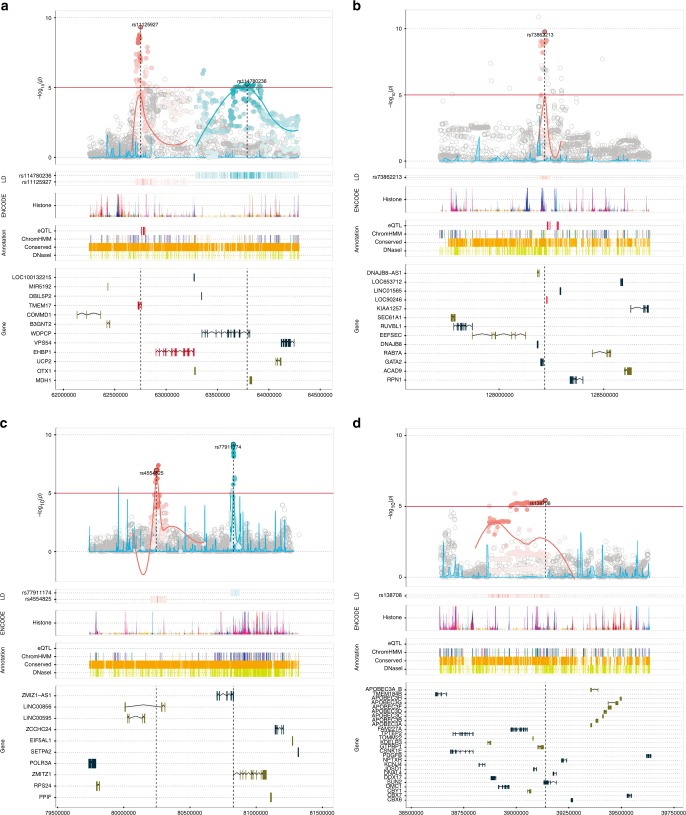
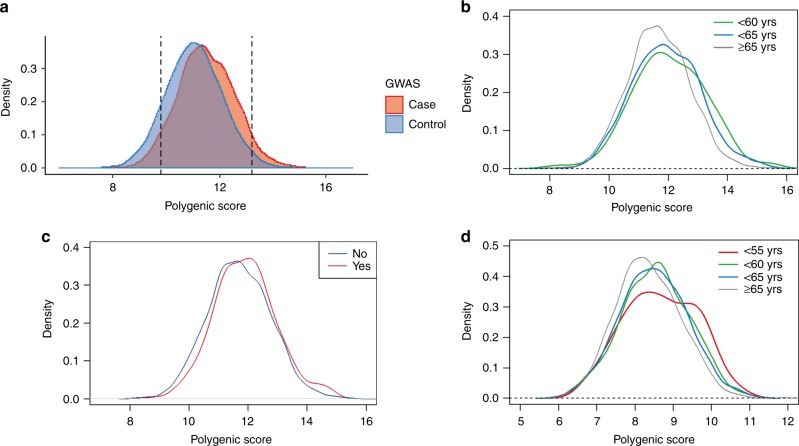
Genome-wide association studies (GWAS) have identified ~170 genetic loci associated with prostate cancer (PCa) risk, but most of them were identified in European populations. We here performed a GWAS and replication study using a large Japanese cohort (9,906 cases and 83,943 male controls) to identify novel susceptibility loci associated with PCa risk. We found 12 novel loci for PCa including rs1125927 (TMEM17, P = 3.95 × 10⁻¹⁶), rs73862213 (GATA2, P = 5.87 × 10⁻²³), rs77911174 (ZMIZ1, P = 5.28 × 10⁻²⁰), and rs138708 (SUN2, P = 1.13 × 10⁻¹⁵), seven of which had crucially low minor allele frequency in European population. Furthermore, we stratified the polygenic risk for Japanese PCa patients by using 82 SNPs, which were significantly associated with Japanese PCa risk in our study, and found that early onset cases and cases with family history of PCa were enriched in the genetically high-risk population. Our study provides important insight into genetic mechanisms of PCa and facilitates PCa risk stratification in Japanese population.
Conflict of interest statement
The authors declare no competing interests.
Figures
Similar articles
-
Prostate Cancer Susceptibility Loci Identified in GATA2 and ZMIZ1 in Chinese Population.Int J Genomics. 2022 Mar 24;2022:8553530. doi: 10.1155/2022/8553530. eCollection 2022. Int J Genomics. 2022. PMID: 35372566 Free PMC article.
-
Association of six susceptibility Loci with prostate cancer in northern chinese men.Asian Pac J Cancer Prev. 2012;13(12):6273-6. doi: 10.7314/apjcp.2012.13.12.6273. Asian Pac J Cancer Prev. 2012. PMID: 23464444
-
Genome-wide association studies identify two novel loci conferring susceptibility to diabetic retinopathy in Japanese patients with type 2 diabetes.Hum Mol Genet. 2021 May 17;30(8):716-726. doi: 10.1093/hmg/ddab044. Hum Mol Genet. 2021. PMID: 33607655 Free PMC article.
-
Systematic enrichment analysis of potentially functional regions for 103 prostate cancer risk-associated loci.Prostate. 2015 Sep;75(12):1264-76. doi: 10.1002/pros.23008. Epub 2015 May 25. Prostate. 2015. PMID: 26015065 Review.
-
Meta-analysis of genome-wide and replication association studies on prostate cancer.Prostate. 2011 Feb 1;71(2):209-24. doi: 10.1002/pros.21235. Prostate. 2011. PMID: 20690139 Review.
Cited by
-
Identification of Germline Genetic Variants that Increase Prostate Cancer Risk and Influence Development of Aggressive Disease.Cancers (Basel). 2021 Feb 12;13(4):760. doi: 10.3390/cancers13040760. Cancers (Basel). 2021. PMID: 33673083 Free PMC article. Review.
-
Leveraging genome-wide association studies to better understand the etiology of cancers.Cancer Sci. 2025 Feb;116(2):288-296. doi: 10.1111/cas.16402. Epub 2024 Nov 19. Cancer Sci. 2025. PMID: 39561785 Free PMC article. Review.
-
Treatment escalation and de-escalation of de-novo metastatic castration-sensitive prostate cancer.Nagoya J Med Sci. 2024 May;86(2):169-180. doi: 10.18999/nagjms.86.2.169. Nagoya J Med Sci. 2024. PMID: 38962407 Free PMC article. Review.
-
Prediction of clinically significant prostate cancer using polygenic risk models in Asians.Investig Clin Urol. 2022 Jan;63(1):42-52. doi: 10.4111/icu.20210305. Investig Clin Urol. 2022. PMID: 34983122 Free PMC article.
-
ZMIZ proteins: partners in transcriptional regulation and risk factors for human disease.J Mol Med (Berl). 2022 Jul;100(7):973-983. doi: 10.1007/s00109-022-02216-0. Epub 2022 Jun 7. J Mol Med (Berl). 2022. PMID: 35670836 Review.
References
-
- Center for Cancer Control and Information Services, National Cancer Center. Projected Cancer Statistics. http://ganjoho.jp/reg_stat/statistics/stat/short_pred.html (2015).
