. 2019 Sep 27;9(1):13949.
doi: 10.1038/s41598-019-50119-x.

Tissue-specific mouse mRNA isoform networks

Affiliations

Tissue-specific mouse mRNA isoform networks

Gaurav Kandoi et al. Sci Rep. .

Abstract

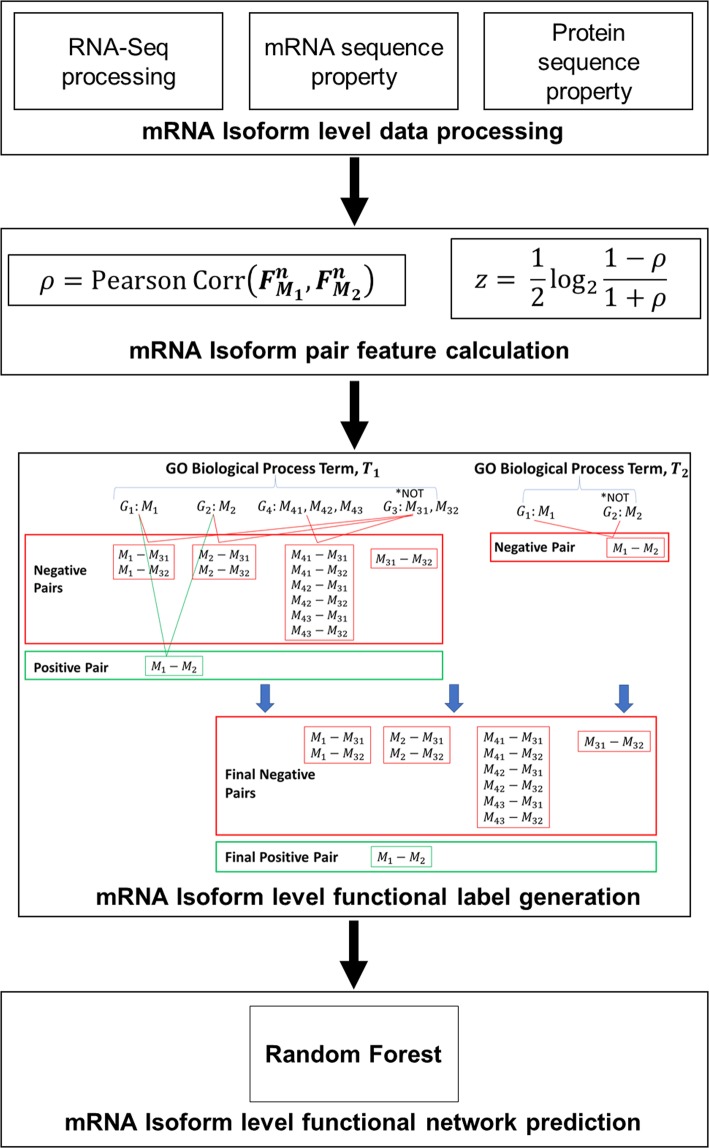
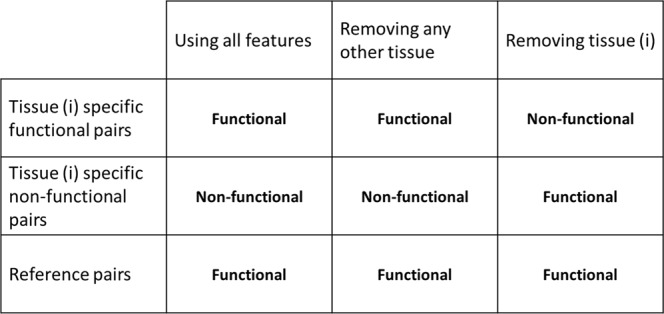
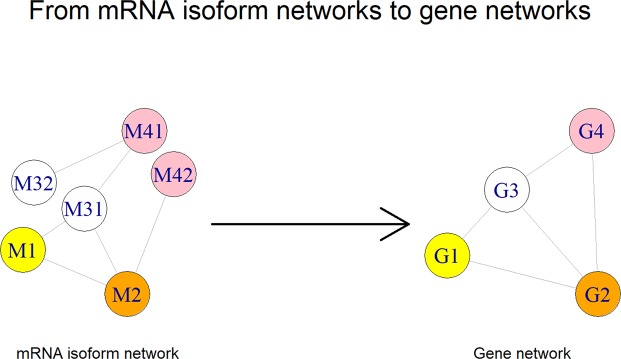
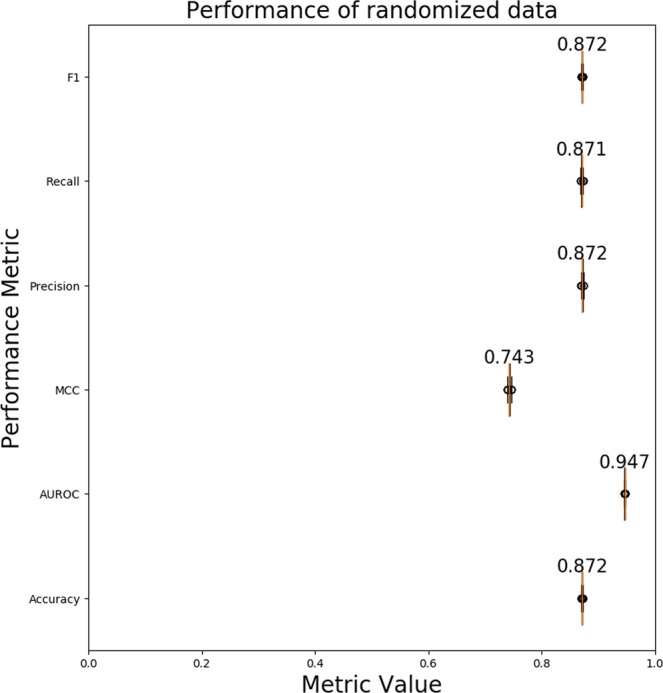
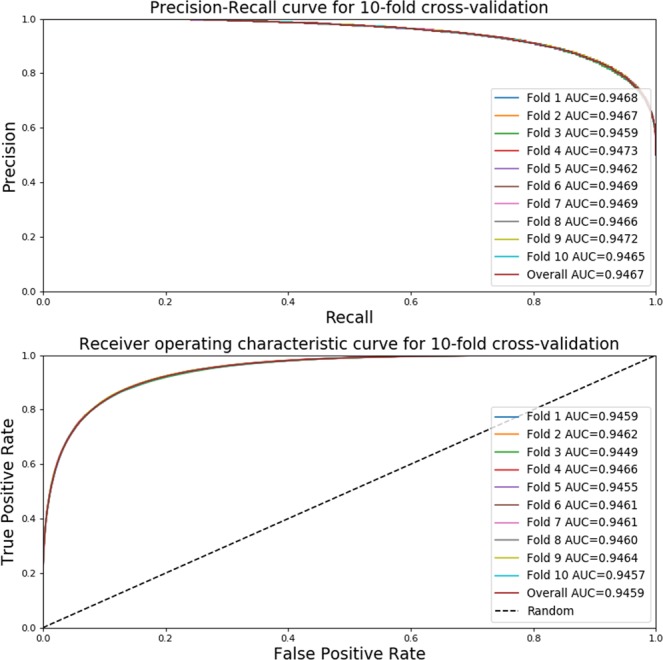
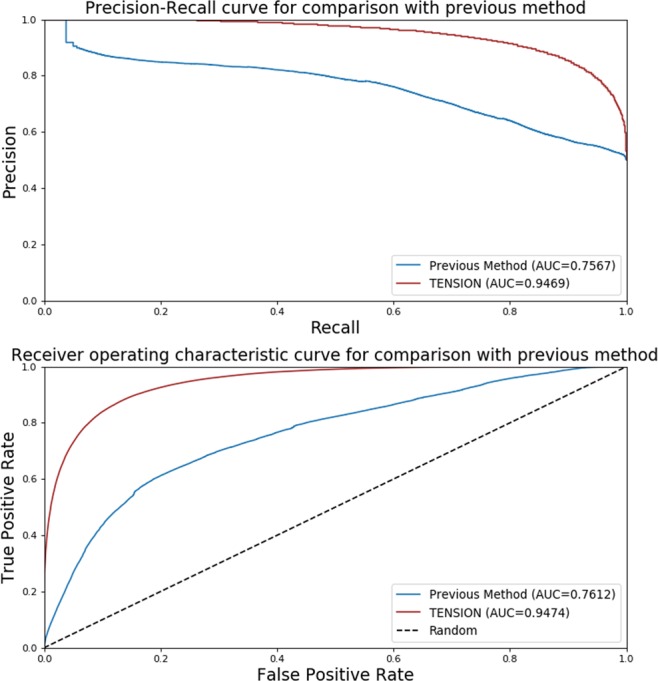
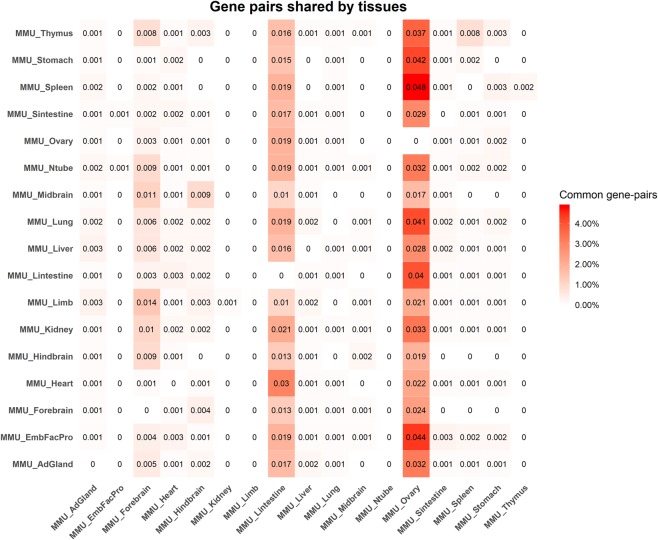
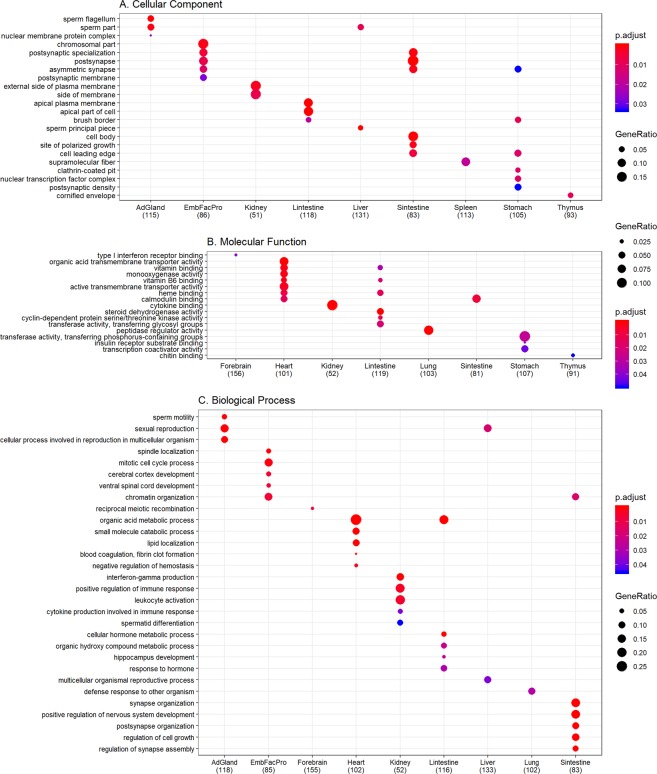
Alternative Splicing produces multiple mRNA isoforms of genes which have important diverse roles such as regulation of gene expression, human heritable diseases, and response to environmental stresses. However, little has been done to assign functions at the mRNA isoform level. Functional networks, where the interactions are quantified by their probability of being involved in the same biological process are typically generated at the gene level. We use a diverse array of tissue-specific RNA-seq datasets and sequence information to train random forest models that predict the functional networks. Since there is no mRNA isoform-level gold standard, we use single isoform genes co-annotated to Gene Ontology biological process annotations, Kyoto Encyclopedia of Genes and Genomes pathways, BioCyc pathways and protein-protein interactions as functionally related (positive pair). To generate the non-functional pairs (negative pair), we use the Gene Ontology annotations tagged with "NOT" qualifier. We describe 17 Tissue-spEcific mrNa iSoform functIOnal Networks (TENSION) following a leave-one-tissue-out strategy in addition to an organism level reference functional network for mouse. We validate our predictions by comparing its performance with previous methods, randomized positive and negative class labels, updated Gene Ontology annotations, and by literature evidence. We demonstrate the ability of our networks to reveal tissue-specific functional differences of the isoforms of the same genes. All scripts and data from TENSION are available at: https://doi.org/10.25380/iastate.c.4275191 .


Conflict of interest statement

The authors declare no competing interests.

Figures

Figure 1
Figure 1
Overview of TENSION workflow. A brief overview of TENSION is provided. We also illustrate the process of generating the mRNA isoform level labels using two dummy gene ontology biological process terms, T1 and T2. Functional mRNA isoform pairs (positive pairs) are shown in green and non-functional pairs (negative pairs) are shown in red. ρ: Pearson Correlation Coefficient; z: standard z-score; FM1n: nth feature of the mRNA M1; FM2n: nth feature of the mRNA M2.
Figure 2
Figure 2
Defining tissue specific functional and non-functional mRNA isoform pairs. Here we illustrate the process of classifying the mRNA isoforms as tissue specific functional, tissue specific non-functional or organism wide reference pairs. If the prediction is functional (positive) when using all 27 features but changes to non-functional (negative) after removing the tissue derived RNA-Seq feature, we assume such mRNA isoform pairs as tissue-specific functional pairs. Contrary to tissue-specific functional pairs, if the prediction changes from non-functional (negative) to functional (positive) after removing the tissue derived RNA-Seq feature, we assume such pairs as tissue-specific non-functional pairs. For the reference pairs, the prediction is constant after removing any tissue derived RNA-Seq feature.
Figure 3
Figure 3
Constructing gene level networks from mRNA isoform networks. Shown here is the process by which we construct gene level networks using the tissue-specific functional mRNA isoform pair networks. All edges from the mRNA isoforms of the same gene in the mRNA isoform network are transferred to the single gene node in the gene level network. The gene and its mRNA isoforms have the same color.
Figure 4
Figure 4
Performance evaluation on randomized datasets. A boxplot of various performance evaluation metrics calculated using 1000 randomized datasets. The median value is shown for the performance metrics. The width of the boxes along the x-axis represent the variability in the value of the performance metric across 1000 randomized datasets. Higher metric value and smaller box width is better. Abbreviations - AUROC: Area Under the Receiver Operating Characteristic Curve; MCC: Matthews Correlation Coefficient.
Figure 5
Figure 5
Performance evaluation on label shuffled datasets. A boxplot of performance evaluation metrics calculated using 1000 label shuffled datasets. The functional and non-functional labels for mRNA isoform pairs are randomly shuffled while still maintaining the class distribution (equal functional/non-functional pairs). The median value is shown for the performance metrics. The width of the boxes along the x-axis represent the variability in the value of the performance metric across 1000 label shuffled datasets. Higher metric value and smaller box width is better. The performance of a model which makes random guesses is about 0.5 (or 0 for MCC because it ranges from −1 to 1). Abbreviations - AUROC: Area Under the Receiver Operating Characteristic Curve; MCC: Matthews Correlation Coefficient.
Figure 6
Figure 6
Performance evaluation by 10-fold stratified cross-validation. The precision-recall and receiver operating characteristic curve for all 10 folds of the stratified cross-validation. Note that the performance is virtually identical for all folds suggesting the robustness of TENSION. A model with area under the curve closer to 1 is better while a model with an area under the curve of 0.5 is equivalent to making random guess. Abbreviations - AUC: Area Under the Curve.
Figure 7
Figure 7
Performance evaluation on validation dataset. The precision-recall and receiver operating characteristic curve for predictions on the validation dataset. The validation dataset is constructed by using the later version of gene ontology annotations, pathways and protein-protein interactions than those used for our original mRNA isoform level label generation. A model with area under the curve closer to 1 is better while a model with an area under the curve of 0.5 is equivalent to making random guess. Abbreviations - PR: Precision-Recall; ROC: Receiver Operating Characteristic.
Figure 8
Figure 8
Performance comparison with Bayesian network based multi-instance learning method. The precision-recall and receiver operating characteristic curve for performance comparison of TENSION with previously published Bayesian network based multi-instance learning method. The original training dataset was used to train both models and performance was calculated using the predictions made on the original testing dataset. Abbreviations - AUC: Area Under the Curve.
Figure 9
Figure 9
Fraction of gene pairs shared between tissues. The heatmap represents the fraction of gene pairs shared between two tissues. The numbers shown in the heatmap are not symmetric because the fraction is weighted by total gene pairs in that row’s tissue. The fraction is weighted by the total number of pairs in the tissue specified on row. For instance, spleen shares 4.8% of all gene pairs present in the spleen network with ovary. Darker shades refer to higher fractions of shared gene pairs. The numbers in the heatmap should be interpreted as reading a matrix rowwise. Abbreviations - AdGland: Adrenal glands; EmbFacPro: Embryonic facial prominence; Ntube: Neural Tube; Sintestine: Small intestine; Lintestine: Large intestine.
Figure 10
Figure 10
Gene ontology functional enrichment. Since the functional annotations are at the gene level, we use the central genes identified by both betweenness centrality (top 10%) and degree centrality (top 10%) to perform gene ontology enrichment. Only the top 5 terms for every tissue are shown here. The dot size represents the ratio of genes present in our central genes annotated to a gene ontology term to genes present in our central network. The color signifies the value of adjusted p-value from false discovery rate control using Benjamini-Hochberg, with lower adjusted p-values shown in darker intensities of red. (A) Enrichment for cellular component aspect of gene ontology. (B) Enrichment for molecular function aspect of gene ontology. (C) Enrichment for biological process aspect of gene ontology. Abbreviations – AdGland: Adrenal glands; EmbFacPro: Embryonic facial prominence; Sintestine: Small intestine; Lintestine: Large intestine.
Figure 11
Figure 11
Pathway enrichment analysis. We use the central genes identified by both betweenness centrality (top 10%) and degree centrality (top 10%) to perform pathway enrichment. Only the top 5 pathways for every tissue are shown here. The dot size represents the ratio of genes present in our central genes annotated to a pathway to genes present in out central network. The color signifies the value of adjusted p-value from false discovery rate control using Benjamini-Hochberg, with lower adjusted p-values shown in darker intensities of red. (A) Enrichment for reactome pathways. (B) Enrichment for KEGG pathways. Abbreviations - KEGG: Kyoto Encyclopedia of Genes and Genomes; AdGland: Adrenal glands; Sintestine: Small intestine; Lintestine: Large intestine.
Figure 12
Figure 12
mRNA isoforms of the same gene have different functional partners across tissues. Few examples where the mRNA isoforms of the same gene have different functional/non-functional partners in specific tissues. The mRNA isoforms of the same gene are represented in same shape. The node color, edge color and the edge label color are encoded based on the tissue for part A and B. Functional pairs have green, while non-functional pairs have red node color, edge color and edge label color in parts C and D. Lower edge weight reflects higher strength of functional mRNA isoform pair. (A) The mRNA isoform NM_026126.4 of gene Fundc2 forms a functional pair with different mRNA isoforms of Necab1 gene in heart and ovary. (B) The ovary enriched mRNA isoform NM_001277944.1 of gene Apoc2 forms a functional pair with another ovary enriched Nts mRNA isoform NM_024435.2 in ovary. Other Apoc2 mRNA isoform NM_001309795.1 is preferred in forebrain. (C) The Olfr1152 mRNA isoform NM_001011834.1 forms a functional pair with Agrp mRNA isoform NM_001271806.1 in hindbrain while the other pair involving Agrp mRNA isoform NM_007427.3.1 is non-functional in hindbrain. (D) The gene pair Iqcf6 and Gstcd result in four mRNA isoform pairs of which one pair is functional and two are non-functional in adrenal glands.
Figure 13
Figure 13
Validation of super-conserved genes. A heatmap showing the presence or absence of a tissue-specific functional interaction for the 20 super-conserved genes. The genes are on the y-axis and the tissues are on the x-axis. If a gene has a tissue-specific functional interaction, the corresponding block is filled green, or orange otherwise. Abbreviations - AdGland: Adrenal glands; EmbFacPro: Embryonic Facial Prominence; Lintestine: Large intestine; Ntube: Neural tube; Sintestine: Small intestine.
Figure 14
Figure 14
Similar tissues have similar mRNA isoform expression profile. A heatmap showing the Pearson correlation coefficient between pairs of tissue based on the median mRNA isoform expression values. The dendrogram on the rows and columns reflects the clustering of tissues. Green represents higher positive correlation between a pair of tissue while red reflects higher negative correlation. Similar tissues can be seen being clustered together.

References

    1. Li HD, Menon R, Omenn GS, Guan Y. The emerging era of genomic data integration for analyzing splice isoform function. Trends Genet. 2014;30:340–347. doi: 10.1016/j.tig.2014.05.005. - DOI - PMC - PubMed
    1. Chen K-F, Crowther DC. Functional genomics in Drosophila models of human disease. Brief. Funct. Genomics. 2012;11:405–415. doi: 10.1093/bfgp/els038. - DOI - PubMed
    1. Vitulo N, et al. A deep survey of alternative splicing in grape reveals changes in the splicing machinery related to tissue, stress condition and genotype. BMC Plant Biol. 2014;14:99. doi: 10.1186/1471-2229-14-99. - DOI - PMC - PubMed
    1. Xu Q, Modrek B, Lee C. Genome-wide detection of tissue-specific alternative splicing in the human transcriptome. Nucleic Acids Res. 2002;30:3754–66. doi: 10.1093/nar/gkf492. - DOI - PMC - PubMed
    1. Ellis JD, et al. Tissue-Specific Alternative Splicing Remodels Protein-Protein Interaction Networks. Mol. Cell. 2012;46:884–892. doi: 10.1016/j.molcel.2012.05.037. - DOI - PubMed

Publication types