. 2019 Sep 27;9(1):13954.
doi: 10.1038/s41598-019-50346-2.

A multi-source data integration approach reveals novel associations between metabolites and renal outcomes in the German Chronic Kidney Disease study

Affiliations

A multi-source data integration approach reveals novel associations between metabolites and renal outcomes in the German Chronic Kidney Disease study

Michael Altenbuchinger et al. Sci Rep. .

Abstract

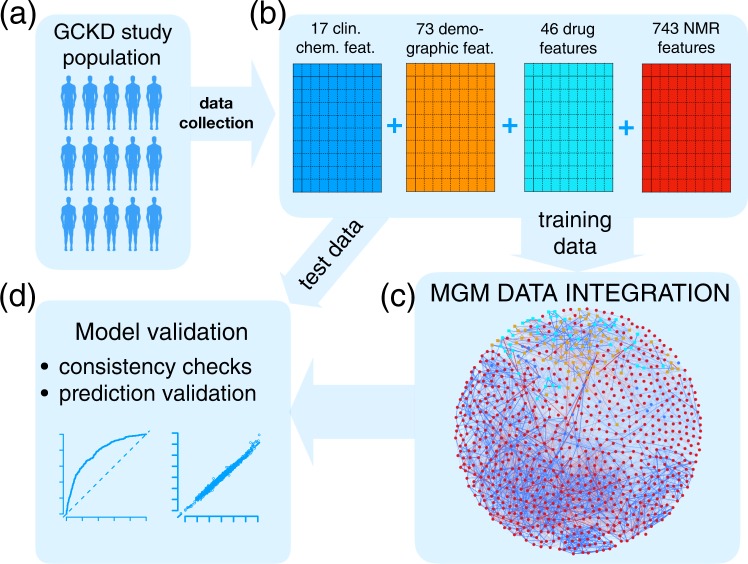
Omics data facilitate the gain of novel insights into the pathophysiology of diseases and, consequently, their diagnosis, treatment, and prevention. To this end, omics data are integrated with other data types, e.g., clinical, phenotypic, and demographic parameters of categorical or continuous nature. We exemplify this data integration issue for a chronic kidney disease (CKD) study, comprising complex clinical, demographic, and one-dimensional 1H nuclear magnetic resonance metabolic variables. Routine analysis screens for associations of single metabolic features with clinical parameters while accounting for confounders typically chosen by expert knowledge. This knowledge can be incomplete or unavailable. We introduce a framework for data integration that intrinsically adjusts for confounding variables. We give its mathematical and algorithmic foundation, provide a state-of-the-art implementation, and evaluate its performance by sanity checks and predictive performance assessment on independent test data. Particularly, we show that discovered associations remain significant after variable adjustment based on expert knowledge. In contrast, we illustrate that associations discovered in routine univariate screening approaches can be biased by incorrect or incomplete expert knowledge. Our data integration approach reveals important associations between CKD comorbidities and metabolites, including novel associations of the plasma metabolite trimethylamine-N-oxide with cardiac arrhythmia and infarction in CKD stage 3 patients.


Conflict of interest statement

The authors declare no competing interests.

Figures

Figure 1
Figure 1
Scheme of the Mixed Graphical Model (MGM) data integration approach. (a) Of the data ascertained from the GCKD study population, (b) a total of 17 clinical chemistry parameters (blue), 73 demographic parameters (orange), 46 drug treatment parameters (cyan), and 743 NMR spectral features (red) were chosen. The complete dataset was split into a training and a test cohort, respectively. The first (c) was used to estimate an MGM, modeling all conditional dependencies between all variables, whereas the latter (d) was used for MGM model validation. In the network representation of the estimated MGM, blue nodes represent clinical chemistry parameters, orange nodes represent demographic variables, cyan nodes represent drug treatment information, and red nodes correspond to NMR buckets. Continuous variables are represented as circles and discrete variables as rectangles. Positive and negative associations are shown as blue and red edges, respectively. The strength of the association, i.e., the weight of the corresponding coefficient, is encoded by the edge width.
Figure 2
Figure 2
(a) First order neighborhood of CKD-EPI eGFR values based on serum creatinine (eGFR). The first order neighborhood of a node, e.g., eGFR, includes, next to the node of interest, all nodes in the estimated MGM, which are directly connected to this particular node by only one edge. These are the only nodes which have been identified as being directly associated with eGFR. Positive associations are represented as blue, negative associations as red edges, respectively. The strength of the estimated association is encoded by the edge width. The edges are ordered according to their strength in a clock-wise manner for positive, and in an anti-clock-wise manner for negative associations, respectively. eGFR is strongly negatively associated with serum creatinine (crea) (edge weight = −11.19), strongly positively associated with male gender (gender) (edge weight = 7.51), and negatively associated with age (age) (edge weight = −2.71). Negative associations are revealed between eGFR and serum cystatin C values (CysC) (edge weight = −0.76), and the NMR bucket at 3.045 ppm (edge weight = −0.37), corresponding to creatinine, respectively. (b) First order neighborhood of elevated blood sugar (bl_sug) and (c) classification as diabetic patient (diabetic). Strong associations can be observed between bl_sug and diabetes medications (med_dm) (edge weight = 1.52), diabetic (edge weight = 1.27), and diabetic nephropathy (diab_neph) (edge weight = 1.15), respectively. Other strong associations are present between diabetic and med_dm (edge weight = 2.89), and the HbA1c value (hba1c) (edge weight = 2.37), respectively, as well as between 2 NMR buckets at 3.785 ppm (edge weight = 0.14) and 3.865 ppm (edge weight = 0.13), both corresponding to D-glucose, and bl_sug, and between diab_neph and classification as type-2 DM patient (dm_typ2) (edge weight = 7.1) and retinal laser therapy due to diabetes (ret_las) (edge weight = 0.47), respectively. (d) First order neighborhood of gout (gout). Strong positive associations between this phenotype and the NMR bucket at 8.115 ppm (edge weight = 0.27), corresponding to unidentified small peptides, alcohol (edge weight = 0.20), 8.125 ppm (edge weight = 0.19) (unidentified small peptides), as well as analgetic nephropathy (an_neph) (edge weight = 0.17), and strong negative associations with the NMR bucket at 3.565 ppm (edge weight = −0.16), identified as glycine, can be observed. Gout is also connected to bmi (edge weight = 0.15), anti-dementia medication (med_antidemenz) (edge weight = 0.14), waist-hip ratio (wh ratio) (edge weight = 0.13), and Morbus Wegener (morb_weg) (edge weight = −0.13). Supplementary Table S1 lists all abbreviations for the clinical parameters.
Figure 3
Figure 3
(a) The diagram shows the predictions of eGFR on the y-axis (in standard units [su]) based on the neighbors of eGFR on independent test data compared to the true values plotted on the x-axis. Predictions agree almost perfectly with the true values as indicated by the correlation coefficients corr between true and predicted values given in the lower right corners. The receiver operating characteristic (ROC) curve for predicting elevated blood sugar based on its neighborhood is shown in (b). The x-axis here represents the false, whereas the y-axis represents the true positive rate, respectively. The dashed line gives the diagonal, corresponding to the predictive performance of a randomly generated model. In the lower right corner, the area under the ROC curve (AUC), an indicator of the predictive power of a classifier, is given. A perfect classifier would achieve an AUC of 1 on independent test data, whereas a randomly generated classifier with no predictive power would achieve an AUC of 0.5, respectively. (cf) Show the ROC curves for the neighborhood models of the medical diagnosis of a patient as being diabetic, gout, cardiac arrhythmia (card_arr), and cardiac infarction (card_inf), respectively.
Figure 4
Figure 4
Effects of variable adjustment on univariate or MGM association analysis in the training set. (a) “top assoc.” shows the distribution of −log10(p-values) derived from a univariate regression. Here, we calculated p-values between all possible pairs of variables and collected all top associations. “top neigh.” shows the analogous distribution, where the top feature was selected by largest absolute edge weight in the MGM neighborhood. (b) The corresponding plot, where the p-values were corrected by the top five confounder variables of the univariate and MGM screening, respectively. (c) The corresponding plot, where we adjusted for the same five randomly selected features for both methods. (df) Show the differences between “top neigh.” and “top assoc.” in (a) to (c), respectively: (d) shows the −log10(p-values) of the MGM approach minus those of the univariate screening in (a), (e) shows the corresponding plot after adjusting for the respective top confounders, as shown in (b), and (f) shows the corresponding plot after adjusting for the randomly selected confounders, as shown in (c). The red points in each figure contrast the values on the y-axis with their respective rank. On the x-axis, the highest positive difference corresponds to 1 and the most negative to 0. The green shaded areas correspond to rank percentiles of negative, the violet shaded areas correspond to rank percentiles of positive differences, respectively.
Figure 5
Figure 5
Smooth scatter plot of adjusted p-values (x-axis) versus unadjusted (univariate) p-values (y-axis) for the univariate screening (a), and the MGM (b) in the training set. The red rectangles mark excerpts shown in detail in (c,d), respectively.
Figure 6
Figure 6
First order neighborhood of (a) cardiac arrhythmia (card_arr) and (b) cardiac infarction (card_inf). card_arr is strongly connected to vitamin K antagonists (med_vitK_ant) (edge weight = 1.50), heart failure (card_ins) (edge weight = 1.0), mitral valve insufficiency (mit_ins) (edge weight = 0.52), angina pectoris (br_pain) (edge weight = 0.39), dyspnea during physical strain (dyspn_str) (edge weight = 0.38) and during the night (dyspn) (edge weight = 0.26), other heart valve anomalies (oth_ins) (edge weight = 0.18), anti thrombotic drugs (med_antipl) (edge weight = 0.17), temporary dialysis (temp_dial), and were positively associated with an NMR bucket at 3.275 ppm (edge weight = 0.12), identified as trimethylamine-N-oxide (TMAO) and minor signals of D-glucose and betaine. card_inf is strongly connected to coronary angiopathy (cor_ves_enl) (edge weight = 1.80), cardiac surgery (card_surg) (edge weight = 1.32), aortic valve stenosis (ao_sten) (edge weight = −0.65), acute renal failure (acute_fail) (edge weight = 0.55), angina pectoris (br_pain) (edge weight = 0.49), heart failure (card_ins) (edge weight = 0.43), antiplatelet therapy (med_antipl_agg) (edge weight = 0.41), catheter angiography of peripheral arteries including angioplasty of a peripheral artery (cont_ag) (edge weight = 0.21), mitral valve insufficiency (mit_ins) (edge weight = 0.20), stroke (stroke) (edge weight = 0.19), serum cholesterol levels (chol) (edge weight = −0.16), anti thrombotic drugs (med_antipl) (edge weight = 0.16), and an NMR bucket at 3.275 ppm (edge weight = 0.14).

References

    1. Holle R, et al. Kora-a research platform for population based health research. Das Gesundheitswesen. 2005;67(S 01):19–25. doi: 10.1055/s-2005-858235. - DOI - PubMed
    1. Illig T, et al. A genome-wide perspective of genetic variation in human metabolism. Nature Genetics. 2010;42(2):137. doi: 10.1038/ng.507. - DOI - PMC - PubMed
    1. Moayyeri A, Hammond CJ, Valdes AM, Spector TD. Cohort profile: Twinsuk and healthy ageing twin study. International Journal of Epidemiology. 2012;42(1):76–85. doi: 10.1093/ije/dyr207. - DOI - PMC - PubMed
    1. Jha V, et al. Chronic kidney disease: global dimension and perspectives. The Lancet. 2013;382(9888):260–272. doi: 10.1016/S0140-6736(13)60687-X. - DOI - PubMed
    1. Levey AS, Coresh J. Chronic kidney disease. The Lancet. 2012;379(9811):165–180. doi: 10.1016/S0140-6736(11)60178-5. - DOI - PubMed

Publication types