. 2019 Sep 27;9(1):13977.
doi: 10.1038/s41598-019-50419-2.

PKN1 kinase-negative knock-in mice develop splenomegaly and leukopenia at advanced age without obvious autoimmune-like phenotypes

Affiliations

PKN1 kinase-negative knock-in mice develop splenomegaly and leukopenia at advanced age without obvious autoimmune-like phenotypes

Salman Mahmud Siddique et al. Sci Rep. .

Abstract

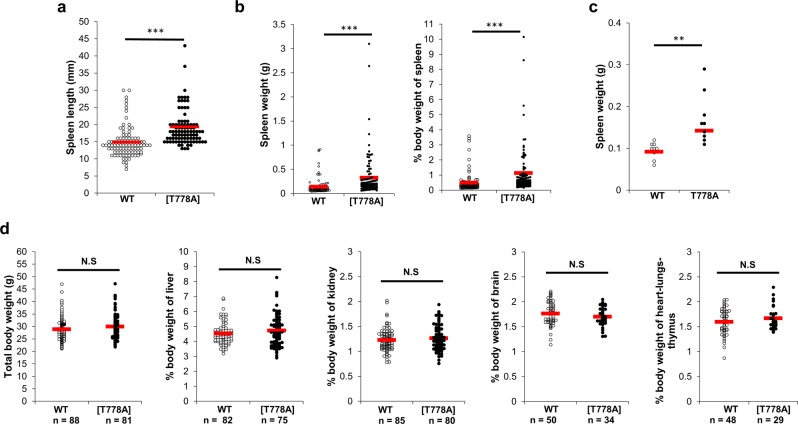
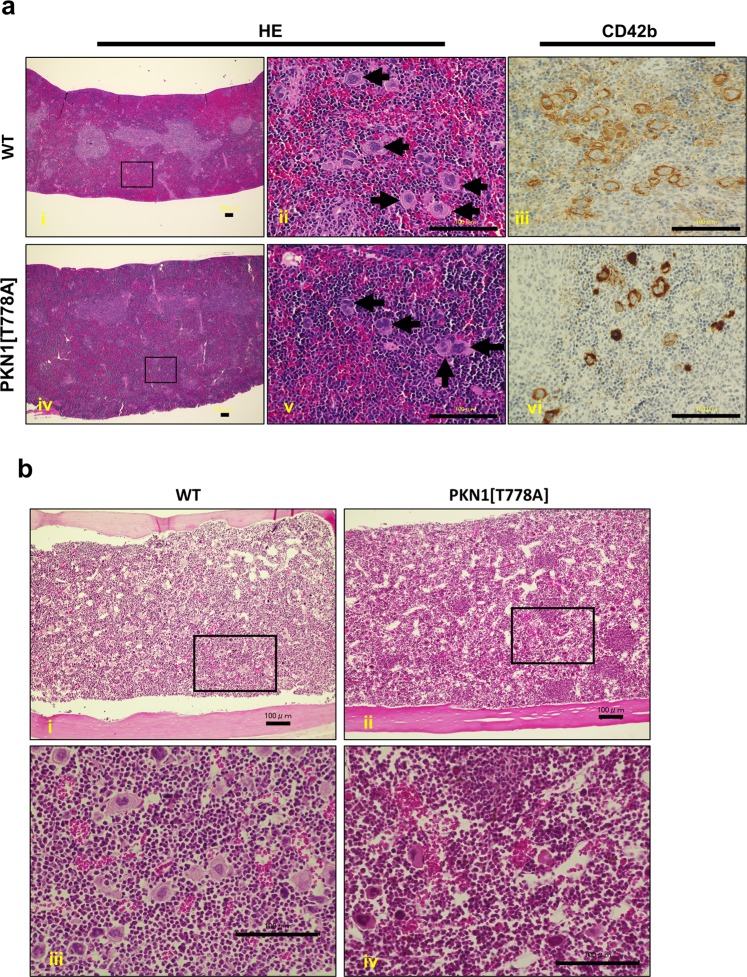
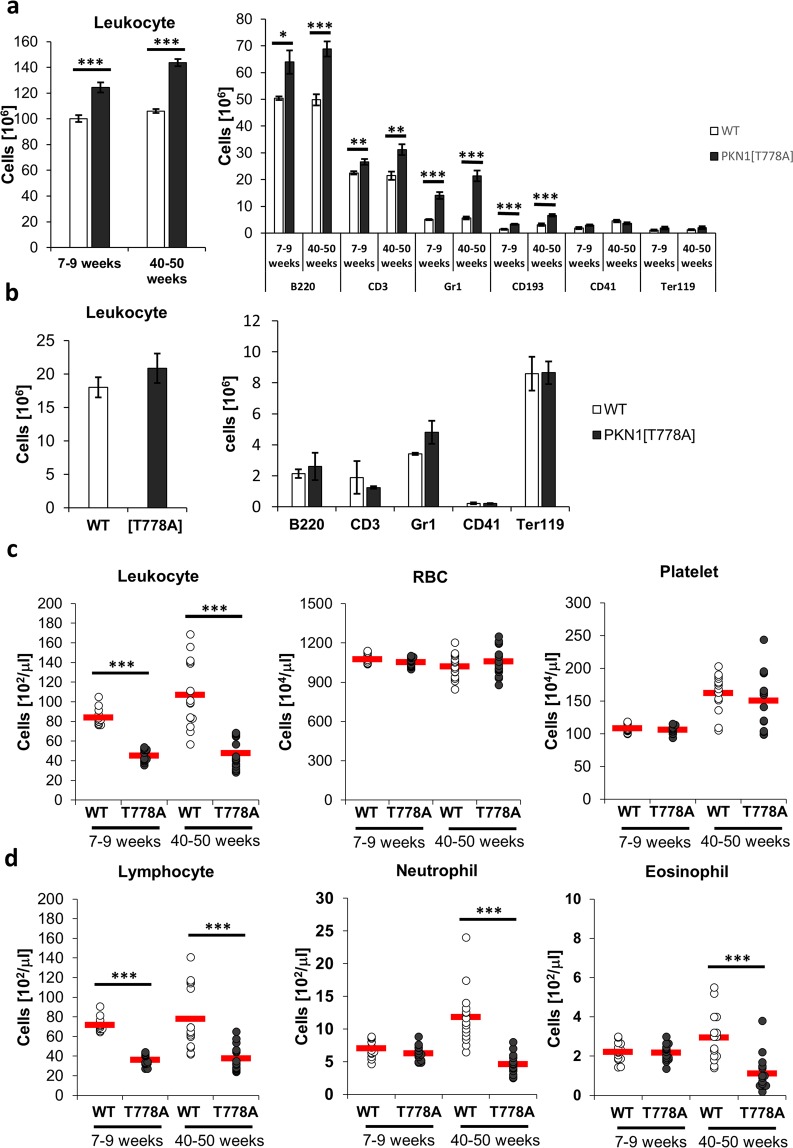
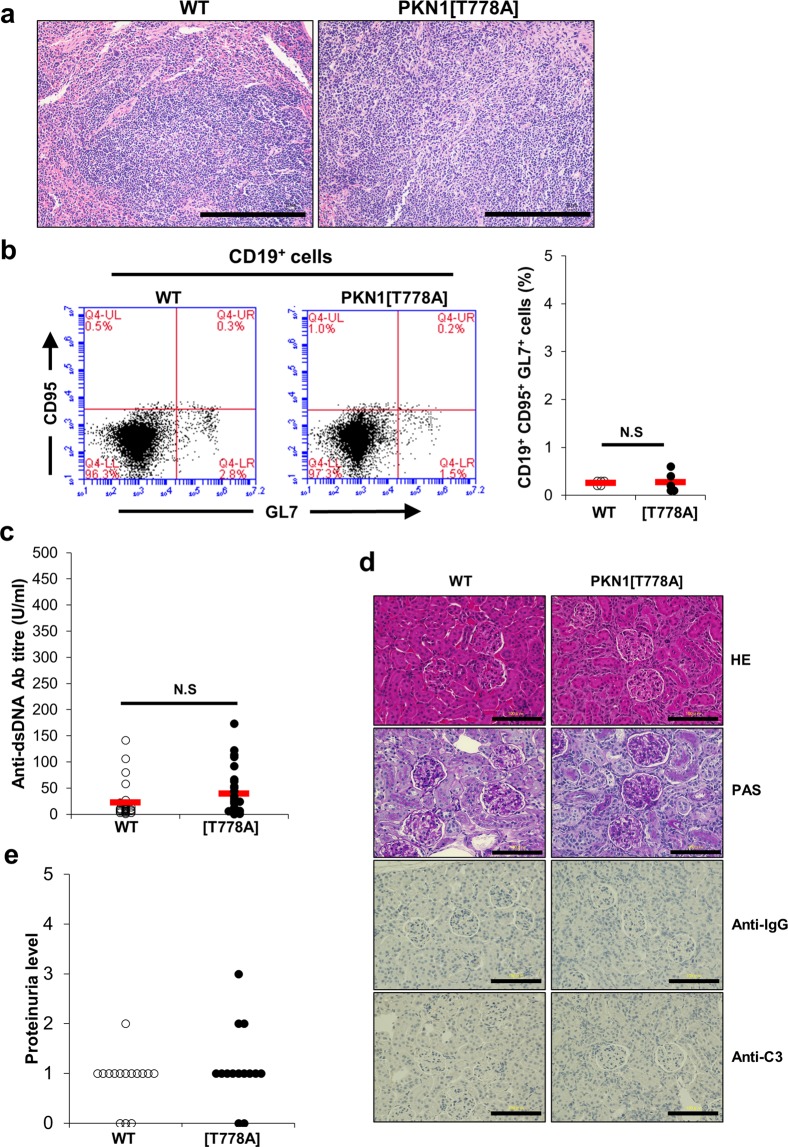
Protein kinase N1 (PKN1) knockout (KO) mice spontaneously form germinal centers (GCs) and develop an autoimmune-like disease with age. Here, we investigated the function of PKN1 kinase activity in vivo using aged mice deficient in kinase activity resulting from the introduction of a point mutation (T778A) in the activation loop of the enzyme. PKN1[T778A] mice reached adulthood without external abnormalities; however, the average spleen size and weight of aged PKN1[T778A] mice increased significantly compared to aged wild type (WT) mice. Histologic examination and Southern blot analyses of spleens showed extramedullary hematopoiesis and/or lymphomagenesis in some cases, although without significantly different incidences between PKN1[T778A] and WT mice. Additionally, flow cytometry revealed increased numbers in B220+, CD3+, Gr1+ and CD193+ leukocytes in the spleen of aged PKN1[T778A] mice, whereas the number of lymphocytes, neutrophils, eosinophils, and monocytes was reduced in the peripheral blood, suggesting an advanced impairment of leukocyte trafficking with age. Moreover, aged PKN1[T778A] mice showed no obvious GC formation nor autoimmune-like phenotypes, such as glomerulonephritis or increased anti-dsDNA antibody titer, in peripheral blood. Our results showing phenotypic differences between aged Pkn1-KO and PKN1[T778A] mice may provide insight into the importance of PKN1-specific kinase-independent functions in vivo.


Conflict of interest statement

The authors declare no competing interests.

Figures

Figure 1
Figure 1
Enlargement of spleen in aged PKN1[T778A] mice. (a) Comparison of splenic length between aged WT and PKN1[T778A] mice. n = 98, WT; 92, PKN1[T778A]. Data were analyzed by Mann-Whitney U test. ***P < 0.001. (b) Comparison of actual spleen weight (g) and % body weight of spleen between aged WT and PKN1[T778A] mice. n = 100, WT; 103, PKN1[T778A]. Data were analyzed by Mann-Whitney U test. ***P < 0.001. (c) Comparison of spleen weight (g) between WT and PKN1[T778A] mice of 40–50 weeks age. n = 9. Data were analyzed by unpaired t-test. **P < 0.01. (d) Comparison of total body weight (g) and % body weight of other major organs between aged WT and PKN1[T778A] mice. Data were analyzed by unpaired t-tests. NS, not significant.
Figure 2
Figure 2
Extramedullary hematopoiesis in aged mice. (a) Histological analysis of spleen. Representative observation from samples of spleens of aged mice are shown (i, ii, iii: WT; iv, v, vi: PKN1[T778A]). HE, hematoxylin & eosin staining; CD42b, immunostaining for CD42b to detect megakaryocytes. ii and v are higher magnifications of the boxed area of i and iv respectively. Arrows indicate the presence of megakaryocytes. Scale bar: 100 μm. (b) Representative hematoxylin & eosin staining of femoral sections from an aged WT and PKN1[T778A] mouse pair (i, iii: WT; ii, iv: PKN1[T778A]). Scale bar: 100 μm.
Figure 3
Figure 3
Comparable incidence of lymphomagenesis between aged PKN1[T778A] and WT mice. Representative observation of HE staining from samples of spleen with distorted follicular structure (upper and middle panel) and normal follicular structure (lower panel) from aged WT and PKN1[T778A] mice. Scale bar: 500 μm.
Figure 4
Figure 4
Cell count of spleen, bone marrow and peripheral blood from WT and PKN1[T778A] mice. (a) Spleen (n = 5) and (b) bone marrow (n = 3) cells of WT and PKN1[T778A] mice were characterized by flow cytometric analysis using fluorophore conjugated antibodies against indicated cell markers. Bone marrow cells were counted as the number of cells per femur. (c) Peripheral blood count (n = 15) and (d) leukocyte cellularity in the peripheral blood (n = 15). Data were analyzed by unpaired t-tests. *P < 0.05, **P < 0.01, ***P < 0.001.
Figure 5
Figure 5
Absence of autoimmune-like phenotypes in aged PKN1[T778A] mice. (a) Representative HE staining of spleen sections from WT and PKN1[T778A] mice >60 weeks of age both showing absence of germinal center (GC) within the follicles. Scale bar: 500 μm. (b) Flow cytometric analysis of GC B cells from splenocytes that were stained with CD19, GL7 and CD95. Statistical analysis of CD95+ GL7+ B cells in splenic CD19+ B cells. Data were analyzed by unpaired t-test. n = 5. NS, not significant. (c) Serum Anti-dsDNA titer in >1 year aged mice evaluated by ELISA. Data were analyzed by Mann-Whitney U test. n = 27, WT; 28, PKN1[T778A]. NS, not significant. (d) Absence of glomerulonephritis in aged PKN1[T778A] mice. Hematoxylin-eosin staining (HE, Top), Periodic acid-Schiff staining (PAS, Second), immune staining with anti-IgG antibodies (Anti-IgG, Third) and anti-C3 antibodies (Anti-C3, Bottom) of kidney sections from >1 year aged WT and PKN1[T778A] mice. Scale bar: 100 μm. (e) Urine protein level measured. Data represents experiment of Day-1 among 3 consecutive days. Data were analyzed by Mann-Whitney U test. n = 15, WT; 14, PKN1[T778A].
Figure 6
Figure 6
Measurement of phosphorylation of Akt at S473. (a) Representative image of immunoblotting (cropped images). Full length images are shown in Supplementary Fig. S5. Lane 1–3: WT samples; 1X, 2X and 4X dilutions. Lane 4–6: PKN1[T778A] samples; 1X, 2X and 4X dilutions. Molecular weight of Akt and P-Akt are 59 KDa and 60 KDa respectively. (b) Quantification of Akt phosphorylation at S473 position (relative to total Akt protein). Data represents average of six individual experiments. Data were analyzed by unpaired t-test.

References

    1. Mukai H. The structure and function of PKN, a protein kinase having a catalytic domain homologous to that of PKC. J Biochem. 2003;133:17–27. doi: 10.1093/jb/mvg019. - DOI - PubMed
    1. Kitagawa M, Mukai H, Shibata H, Ono Y. Purification and characterization of a fatty acid-activated protein kinase (PKN) from rat testis. Biochem J. 1995;310(Pt 2):657–664. doi: 10.1042/bj3100657. - DOI - PMC - PubMed
    1. Mukai H, et al. Activation of PKN, a novel 120-kDa protein kinase with leucine zipper-like sequences, by unsaturated fatty acids and by limited proteolysis. Biochem Biophys Res Commun. 1994;204:348–356. doi: 10.1006/bbrc.1994.2466. - DOI - PubMed
    1. Takahashi M, Mukai H, Toshimori M, Miyamoto M, Ono Y. Proteolytic activation of PKN by caspase-3 or related protease during apoptosis. Proc Natl Acad Sci USA. 1998;95:11566–11571. doi: 10.1073/pnas.95.20.11566. - DOI - PMC - PubMed
    1. Morrice NA, Gabrielli B, Kemp BE, Wettenhall RE. A cardiolipin-activated protein kinase from rat liver structurally distinct from the protein kinases C. J Biol Chem. 1994;269:20040–20046. - PubMed

Publication types