. 2020 Feb;18(2):306-317.
doi: 10.1111/jth.14653. Epub 2019 Nov 1.

A mathematical model of coagulation under flow identifies factor V as a modifier of thrombin generation in hemophilia A

Affiliations

A mathematical model of coagulation under flow identifies factor V as a modifier of thrombin generation in hemophilia A

Kathryn G Link et al. J Thromb Haemost. 2020 Feb.

Abstract

Background: The variability in bleeding patterns among individuals with hemophilia A, who have similar factor VIII (FVIII) levels, is significant and the origins are unknown.

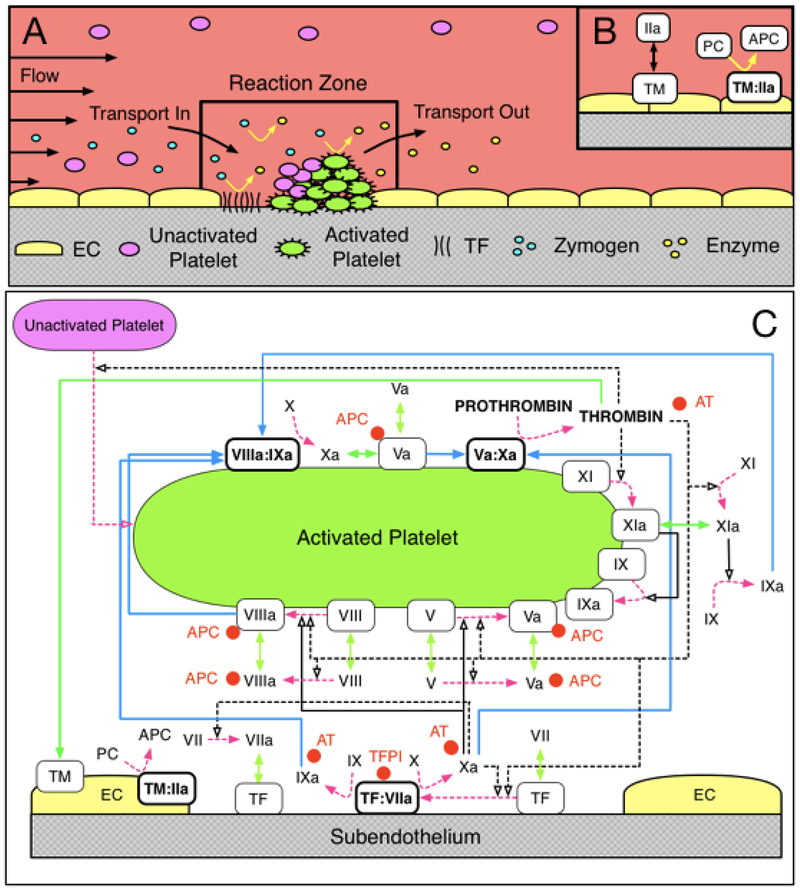
Objective: To use a previously validated mathematical model of flow-mediated coagulation as a screening tool to identify parameters that are most likely to enhance thrombin generation in the context of FVIII deficiency.

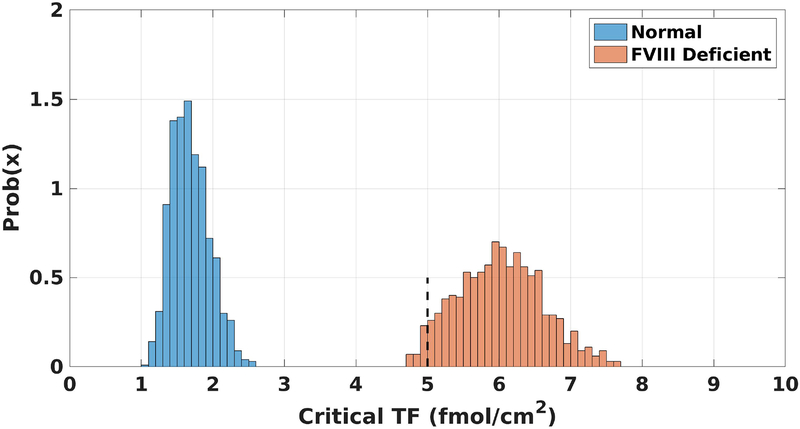
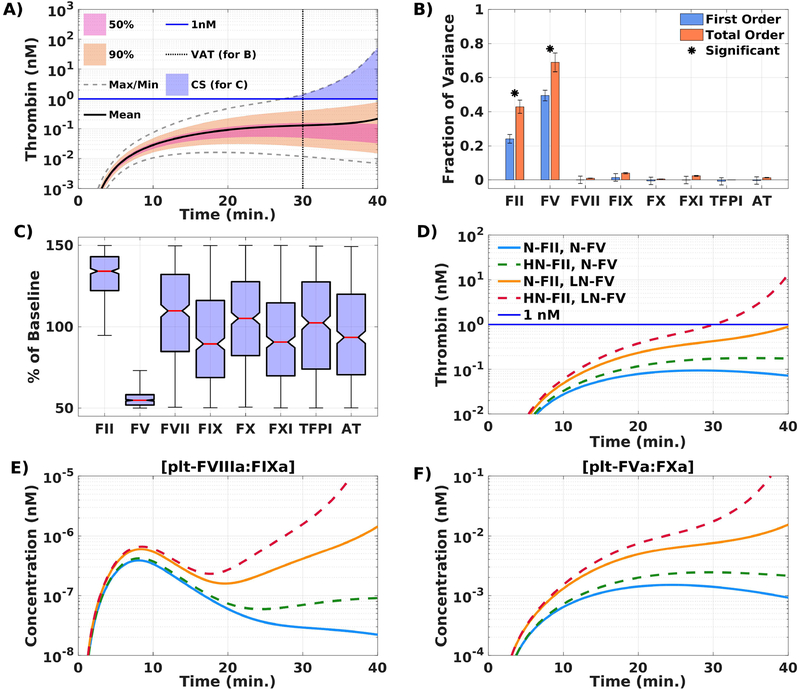
Methods: We performed a global sensitivity analysis (GSA) on our mathematical model to identify potential modifiers of thrombin generation. Candidates from the GSA were confirmed by calibrated automated thrombography (CAT) and flow assays on collagen-tissue factor (TF) surfaces at a shear rate of 100 per second.

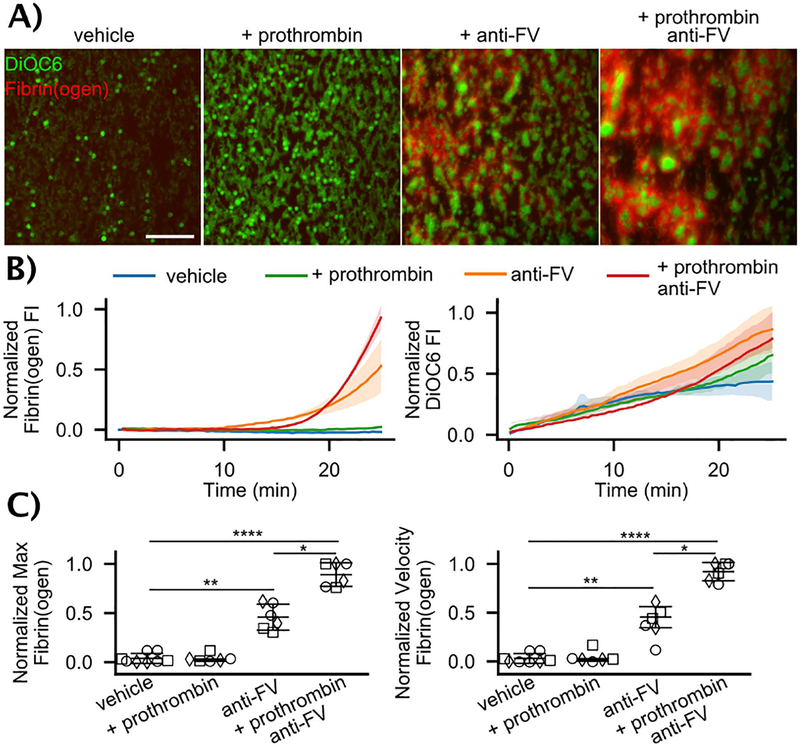
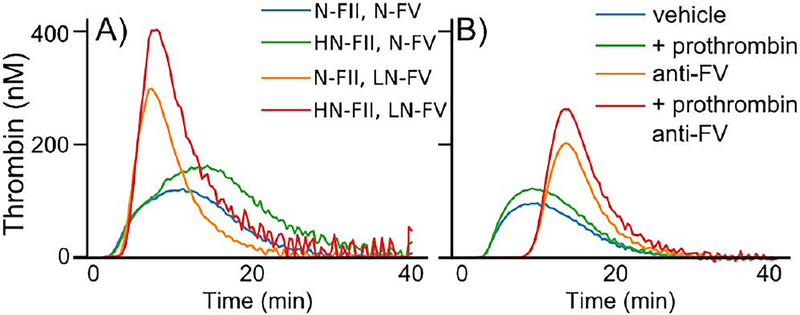
Results: Simulations identified low-normal factor V (FV) (50%) as the strongest modifier, with additional thrombin enhancement when combined with high-normal prothrombin (150%). Low-normal FV levels or partial FV inhibition (60% activity) augmented thrombin generation in FVIII-inhibited or FVIII-deficient plasma in CAT. Partial FV inhibition (60%) boosted fibrin deposition in flow assays performed with whole blood from individuals with mild and moderate FVIII deficiencies. These effects were amplified by high-normal prothrombin levels in both experimental models.

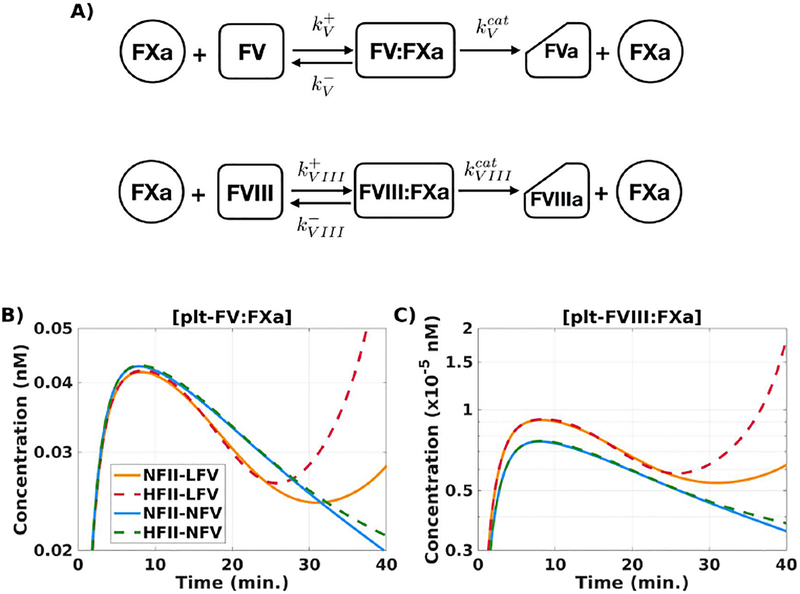
Conclusions: These results show that low-normal FV levels can enhance thrombin generation in hemophilia A. Further explorations with the mathematical model suggest a potential mechanism: lowering FV reduces competition between FV and FVIII for factor Xa (FXa) on activated platelet surfaces (APS), which enhances FVIII activation and rescues thrombin generation in FVIII-deficient blood.

Keywords: factor V; factor VIII; hemophilia A; hemorheology; hemostasis.


Conflict of interest statement

Disclosure of Conflicts of Interest

The authors declare no competing financial interests.

Figures

Figure 1.
Figure 1.. Schematic of coagulation reactions included in our model.
Schematic (A) of the reaction zone where platelet deposition and coagulation reactions are tracked, and (B) of the endothelial zone into which thrombin can diffuse from the reaction zone, and in which thrombin binds to thrombomodulin and produces activated protein C (APC) which can diffuse into the reaction zone. (C) Dashed magenta arrows show cellular or chemical activation processes. Blue arrows show chemical transport in the fluid or on a surface. Green segments with two arrowheads depict binding and unbinding from a surface. Rectangular boxes denote surface-bound species. Solid black lines with open arrows show enzyme action in a forward direction, while dashed black lines with open arrows show feedback action of enzymes. Red disks show chemical inhibitors.
Figure 2.
Figure 2.. Critical TF distributions.
The probability density function for the necessary level of TF needed in the model for normal (blue) and FVIII deficient (orange) plasma to achieve an amplified thrombin response, i.e., 1 nM thrombin by 40 minutes. Dashed black line at 5 fmol/cm2 is the fixed TF level for all simulations in this work.
Figure 3.
Figure 3.. FV is a modifier of thrombin generation in a mathematical model of flow-mediated coagulation.
Global sensitivity analysis identifies FV as a modifier of thrombin generation. (A) Thrombin concentration time series generated by uniformly and independently varying plasma protein levels ± 50% from normal (110,000 total simulations); mean (solid black line), boundaries that encompass 50% (pink), and 90% of the data (orange), and the maximum/minimum of the computed solutions (gray-dashed); blue line drawn at 1nM. VAT = variance analysis time, CS = condition for samples. (B) First (blue) and total (orange) order Sobol indices are plotted as mean ± standard deviation computed with 5,000 bootstrap samples of the original 110,000 simulations. (C) Plasma protein levels distributions shown as box-and-whisker plots (mean in red, whiskers drawn at 3 times the interquartile range), conditioned on achieving more than 1nM of total thrombin by 40 min. Effects of specific variations in plasma levels of FII and FV on thrombin generation in the mathematical model. [“N” denotes normal (100%),“LN” denotes low-normal (50%), and “HN” denotes high-normal (150%) of the respective baseline plasma level; N-FII= 1400 nM, N-FV = 10 nM.] (D) Total thrombin; (E) platelet tenase (plt-FVIIIa:FIXa); (F) prothrombinase (plt-FVa:FXa); during a time course of 40 min. Description of labels are given in Table 1. All simulations performed at TF = 5 fmol/cm2.
Figure 4.
Figure 4.. Flow assays with whole blood from FVIII deficient individuals.
(A) Representative images of DiOC6 labeled platelets and leukocytes and Alexa Fluor 555 labeled fibrin(ogen) on collagen-TF surfaces at 100 s−1 after 25 min for vehicle control, 50 μg/mL exogeneous prothrombin, 100 μg/mL anti-FV, and exogenous prothrombin and anti-FV. Scale bar = 50 μm. Individual fluorescent channels are found in Fig. S2. (B) Representative fibrin(ogen) and platelet/leukocyte accumulation dynamics in terms of normalized fluorescent intensity (FI). (C) Fibrin(ogen) normalized maximum fluorescence intensity and rate of deposition (normalized velocity) for FVIII levels of ○ = 3.0%, ☐= 7.5%, ◇ = 8.5%. See SI and Fig. S8 for calculation of metrics. P-values represented as *, **, and **** for 10−2,10−4, and 10−7, respectively. Images are from a Olympus IX81 microscope driven by cellSens software and equipped with 16-bit CCD camera (Orca-R2, Hamamatsu) and a 40X air objective (NA 0.6).
Figure 5.
Figure 5.. Calibrated automated thrombography.
(A) FII and FV levels were varied using immunodepleted plasmas and purified FII and FV in the presence of an anti-FVIII function blocking antibody. ‘N’, ‘H’, and ‘L’ corresponds to normal, high, and low levels of the respective protein. (B) FVIII deficient (<10%) plasma treated with vehicle control, 50 μg/mL exogenous prothrombin, 100 μg/mL anti-FV, and exogenous prothrombin and anti-FV. All assays conducted with 5 pM TF and phospholipids. Tables S1 and S2 contain the measured prothrombin, FV, and FVIII levels corresponding to each curve.
Figure 6.
Figure 6.. Substrate competition for FXa: a potential mechanism.
(A) Kinetic scheme of substrate competition of FV and FVIII for FXa. [“N” denotes normal (100%),“LN” denotes low-normal (50%), and “HN” denotes high-normal (150%) of the respective baseline plasma level; N-FII = 1400 nM, N-FV = 10 nM.] (B) plt-FVa:FXa, complex on platelet surface; (C) plt-FVIII:FXa, tenase complex on platelet surface; during a time course of 40 min. Description of labels are given in Table 1. All simulations performed at TF = 5 fmol/cm2.

References

    1. Blanchette VS, Key NS, Ljung LR, et al. Definitions in hemophilia: communication from the SSC of the ISTH. J Thromb Haemost. 2014;12:1935–1939. - PubMed
    1. Carcao MD, Berg HM, Ljung R, Mancuso ME, PedNet, Rodin Study Group. Correlation between phenotype and genotype in a large unselected cohort of children with severe hemophilia A Blood. 2013;121:3946–52, S1. - PubMed
    1. Nogami K, Shima M. Phenotypic heterogeneity of hemostasis in severe hemophilia. Semin Thromb Hemost. 2015; 41:826–831. - PubMed
    1. Franchini M, Mannucci PM. Modifiers of clinical phenotype in severe congenital hemophilia. Thromb Res. 2017;156:60–64. - PubMed
    1. Schlitt T, Brazma A. Current approaches to gene regulatory network modelling. BMC Bioinformatics.2007;8 Suppl 6:S9. - PMC - PubMed

Publication types