

Differences in service utilization at an urban tribal health organization before and after Alzheimer's disease or related dementia diagnosis: A cohort study
- PMID: 31563535
- PMCID: PMC6874738
- DOI: 10.1016/j.jalz.2019.06.4945
Differences in service utilization at an urban tribal health organization before and after Alzheimer's disease or related dementia diagnosis: A cohort study
Abstract
Introduction: The prevalence, mortality, and healthcare impact of Alaska Native and American Indian (ANAI) people with Alzheimer's disease and related dementias (ADRD) are unknown.
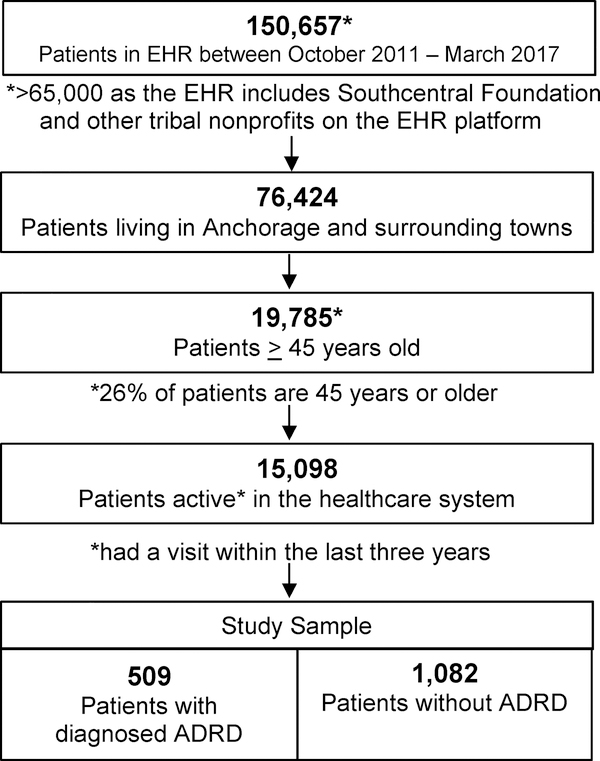
Methods: We conducted a cohort study of electronic health record data that compared healthcare service utilization in patients with and without an ADRD diagnosis. Zero-inflated negative binomial regression with robust standard errors was used to estimate utilization rates.
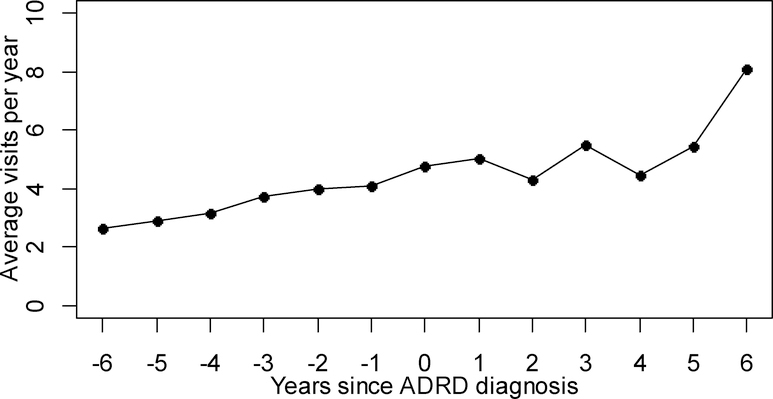
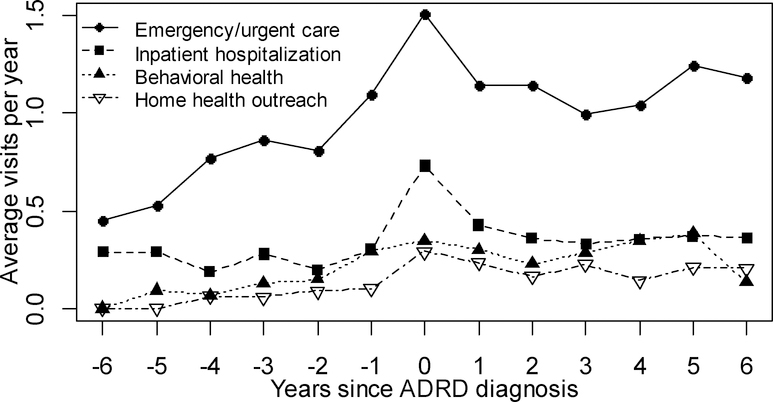
Results: Compared with patients without ADRD, utilization rates were similar before but higher after ADRD diagnosis. For those with diagnosed ADRD, utilization increased gradually over time with sharp upward change during the year of diagnosis.
Discussion: This is the only study quantifying changes in healthcare service utilization before and after ADRD diagnosis among ANAI people, which is crucial for tailoring geriatric care for ANAI populations.
Keywords: Alaska Native; Alzheimer disease; American Indian; Delivery of healthcare; Dementia; Geriatrics; Health services.
Copyright © 2019 the Alzheimer's Association. Published by Elsevier Inc. All rights reserved.
Figures
Similar articles
-
Alzheimer's disease and related dementia diagnoses among American Indian and Alaska Native adults aged ≥45 years, Indian Health Service System, 2016-2020.J Am Geriatr Soc. 2024 Sep;72(9):2834-2841. doi: 10.1111/jgs.19058. Epub 2024 Aug 8. J Am Geriatr Soc. 2024. PMID: 39115437 Free PMC article.
-
Wisconsin Healthcare Utilization Cost Among American Indians/Alaska Natives with and without Alzheimer's Disease and Related Dementias.J Alzheimers Dis. 2023;91(1):183-189. doi: 10.3233/JAD-220393. J Alzheimers Dis. 2023. PMID: 36373315 Free PMC article.
-
Healthcare utilization of Mexican-American Medicare beneficiaries with and without Alzheimer's disease and related dementias.PLoS One. 2020 Jan 15;15(1):e0227681. doi: 10.1371/journal.pone.0227681. eCollection 2020. PLoS One. 2020. PMID: 31940401 Free PMC article.
-
Alzheimer's disease and its related dementias in US Native Americans: A major public health concern.Ageing Res Rev. 2023 Sep;90:102027. doi: 10.1016/j.arr.2023.102027. Epub 2023 Aug 5. Ageing Res Rev. 2023. PMID: 37544432 Free PMC article. Review.
-
A Systematic Review of Environmental Health Outcomes in Selected American Indian and Alaska Native Populations.J Racial Ethn Health Disparities. 2020 Aug;7(4):698-739. doi: 10.1007/s40615-020-00700-2. Epub 2020 Jan 23. J Racial Ethn Health Disparities. 2020. PMID: 31974734
Cited by
-
Patterns of Healthcare Use and Mortality After Alzheimer's Disease or Related Dementia Diagnosis Among Alaska Native Patients: Results of a Cluster Analysis in a Tribal Healthcare Setting.J Alzheimers Dis Rep. 2022 Jul 11;6(1):401-410. doi: 10.3233/ADR-210062. eCollection 2022. J Alzheimers Dis Rep. 2022. PMID: 36072365 Free PMC article.
-
Which factors preceding dementia identification impact future healthcare use trajectories: multilevel analyses in administrative data.BMC Geriatr. 2024 Jan 23;24(1):89. doi: 10.1186/s12877-023-04643-1. BMC Geriatr. 2024. PMID: 38263052 Free PMC article.
-
The Association of Cultural Participation and Social Engagement With Self-Reported Diagnosis of Memory Problems Among American Indian and Alaska Native Elders.J Aging Health. 2021 Aug-Sep;33(7-8_suppl):60S-67S. doi: 10.1177/08982643211014971. J Aging Health. 2021. PMID: 34167346 Free PMC article.
-
Validating a predictive algorithm for suicide risk with Alaska Native populations.Suicide Life Threat Behav. 2022 Aug;52(4):696-704. doi: 10.1111/sltb.12853. Epub 2022 Mar 15. Suicide Life Threat Behav. 2022. PMID: 35293010 Free PMC article.
-
An outcome-wide analysis of the effects of diagnostic labeling of Alzheimer's disease and related dementias on social relationships.Alzheimers Dement. 2024 Mar;20(3):1614-1626. doi: 10.1002/alz.13574. Epub 2023 Dec 5. Alzheimers Dement. 2024. PMID: 38053452 Free PMC article.
References
-
- Assocation As. 2018 Alzheimer’s Disease Facts and Figures. Alzheimers Dementia 2018;14(3):367–429
Publication types
MeSH terms
Grants and funding
LinkOut - more resources
Full Text Sources
Medical
