. 2020 Feb 20;22(2):240-252.
doi: 10.1093/neuonc/noz183.

TSPO deficiency induces mitochondrial dysfunction, leading to hypoxia, angiogenesis, and a growth-promoting metabolic shift toward glycolysis in glioblastoma

Affiliations

TSPO deficiency induces mitochondrial dysfunction, leading to hypoxia, angiogenesis, and a growth-promoting metabolic shift toward glycolysis in glioblastoma

Yi Fu et al. Neuro Oncol. .

Erratum in

Abstract

Background: The ligands of mitochondrial translocator protein (TSPO) have been widely used as diagnostic biomarkers for glioma. However, the true biological actions of TSPO in vivo and its role in glioma tumorigenesis remain elusive.

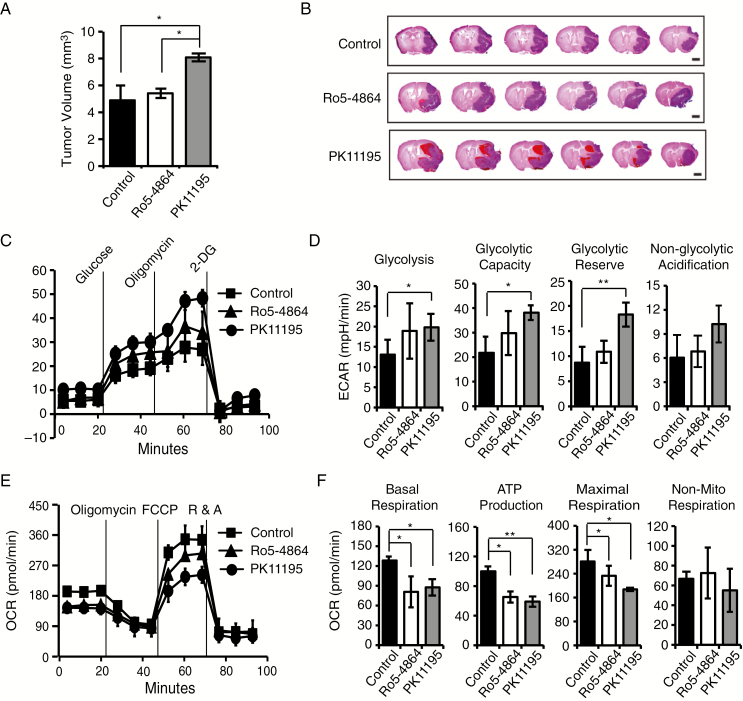
Methods: TSPO knockout xenograft and spontaneous mouse glioma models were employed to assess the roles of TSPO in the pathogenesis of glioma. A Seahorse Extracellular Flux Analyzer was used to evaluate mitochondrial oxidative phosphorylation and glycolysis in TSPO knockout and wild-type glioma cells.

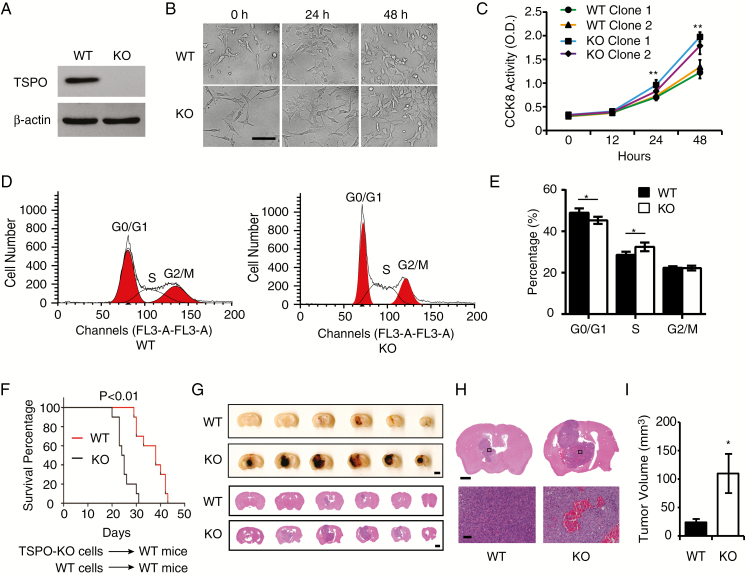
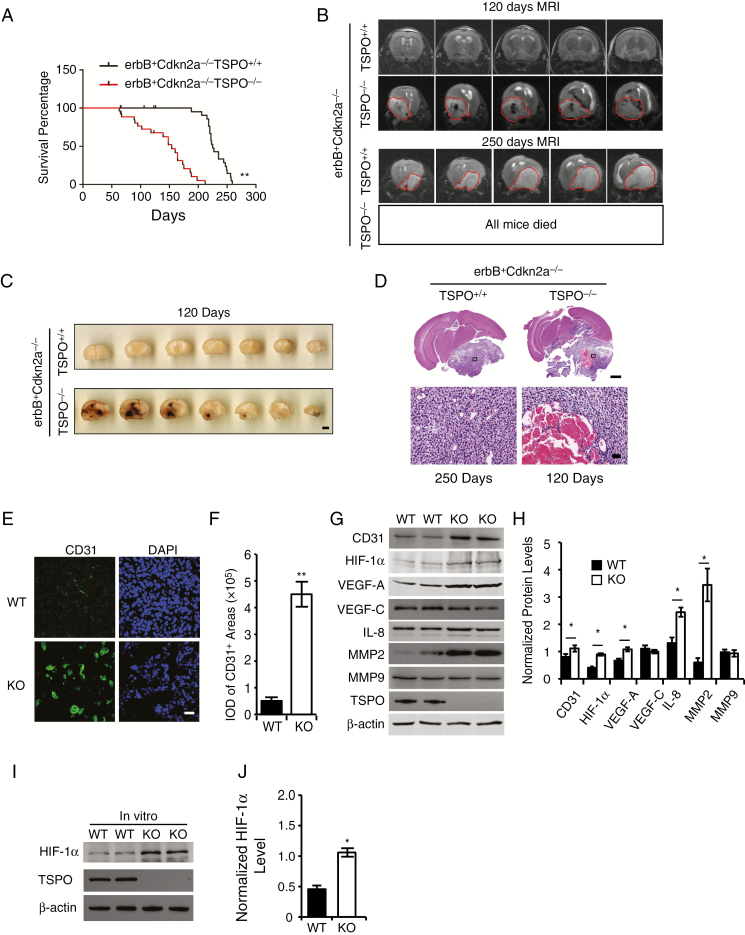
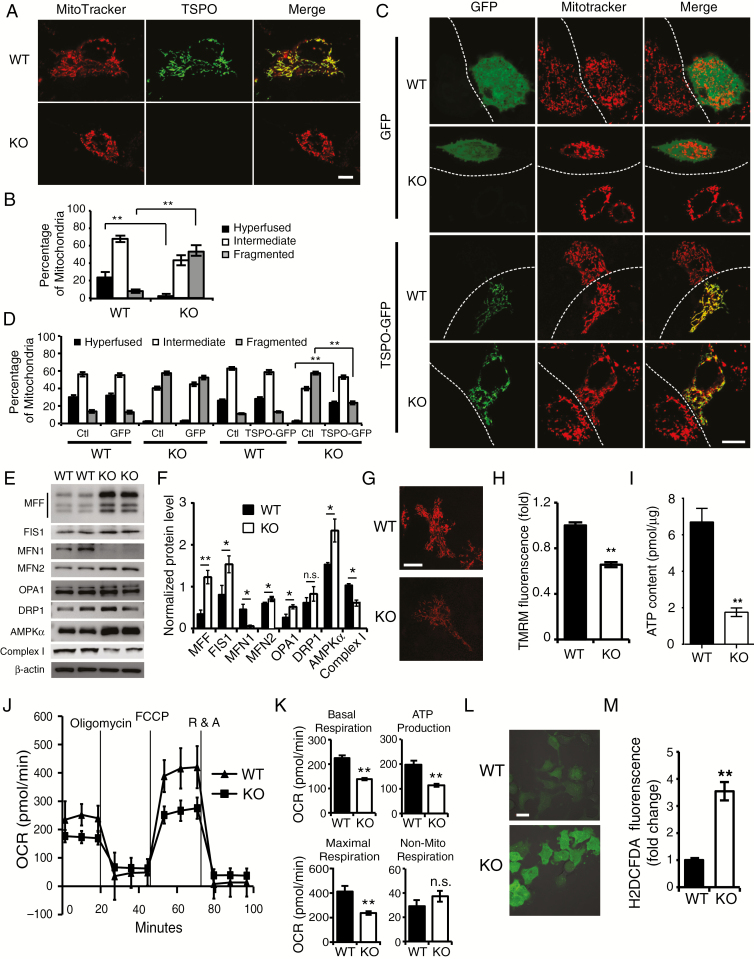
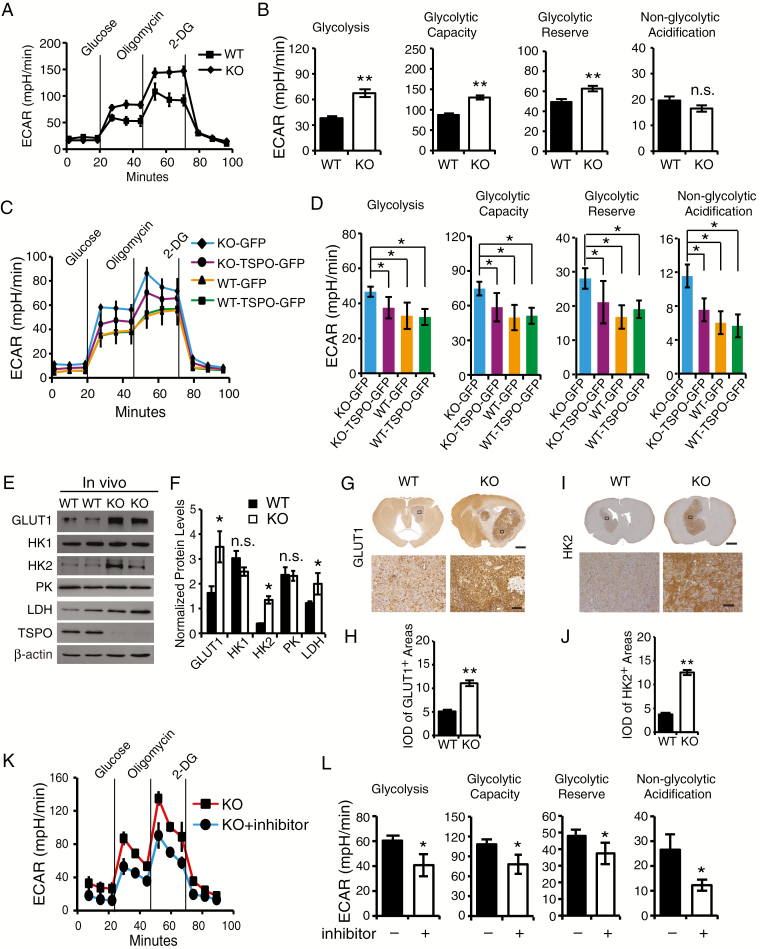
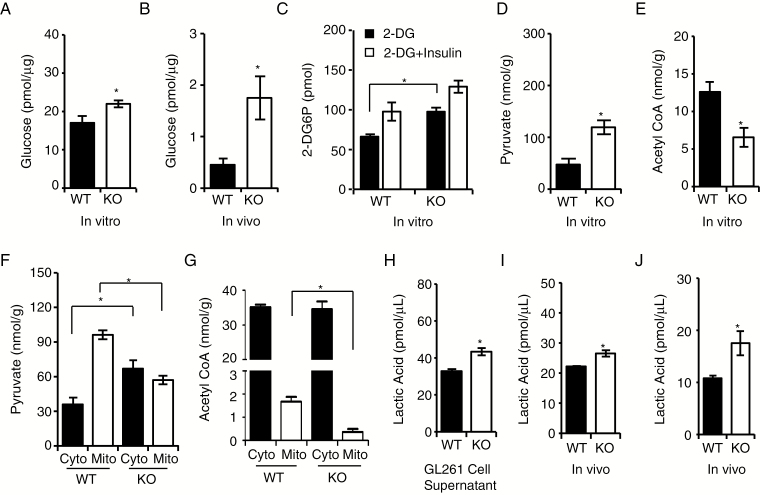
Results: TSPO deficiency promoted glioma cell proliferation in vitro in mouse GL261 cells and patient-derived stem cell-like GBM1B cells. TSPO knockout increased glioma growth and angiogenesis in intracranial xenografts and a mouse spontaneous glioma model. Loss of TSPO resulted in a greater number of fragmented mitochondria, increased glucose uptake and lactic acid conversion, decreased oxidative phosphorylation, and increased glycolysis.

Conclusion: TSPO serves as a key regulator of glioma growth and malignancy by controlling the metabolic balance between mitochondrial oxidative phosphorylation and glycolysis.1. TSPO deficiency promotes glioma growth and angiogenesis.2. TSPO regulates the balance between mitochondrial oxidative phosphorylation and glycolysis.

Keywords: TSPO; angiogenesis; glioma; glycolysis; mitochondrial oxidative phosphorylation.


Figures

Fig. 1
Fig. 1
TSPO deletion promotes the proliferation of glioma cells and the growth of glioma in an intracranial xenograft glioma model. (A) Western blot verified the loss of TSPO expression in TSPO-KO GL261 cells in which the gene was knocked out using the CRISPR/Cas9 system. (B) Images of TSPO-KO and WT GL261 cells were acquired at 0, 24, and 48 hours of culture. Scale bar, 100 μm. (C) CCK-8 assay. (D) Flow cytometry for cell cycle analysis. (E) Quantitation of the percentages of cells in different phases of the cell cycle shown in (D). (F) Survival curves for the mouse intracranial xenograft glioma model following the injection of WT or KO GL261 cells into the brains of WT mice. (G) Representative images of a series of slices from one mouse brain with glioma without staining (upper panel) or with HE staining (lower panel) captured 20 days after the intracranial injection of KO or WT cells. Scale bar, 1 mm for upper images and 100 μm for lower images. (H and I) High-resolution images of HE-stained brain slices (H) and the quantification of tumor volumes (I). Scale bar, 100 μm. Three independent experiments were performed. The data are presented as means ± SEM. *P < 0.05 and **P < 0.01 as determined using Student’s t-test (C, E, and I) and the Gehan-Breslow-Wilcoxon test (F).
Fig. 2
Fig. 2
TSPO deletion promotes glioma pathogenesis and malignancy in a spontaneous primary glioma mouse model by increasing hypoxia-induced angiogenesis. (A) Survival curves for S100b-v-ErbB+Cdkn2a-/-TSPO-/- mice (n = 27) and S100b-v-ErbB+Cdkn2a-/-TSPO+/+ littermates (n = 26). (B) The upper panel shows representative MRIs of the brains of S100b-v-ErbB+Cdkn2a-/-TSPO-/- mice and S100b-v-ErbB+Cdkn2a-/-TSPO+/+ littermates at the age of 120 days. The circled regions indicate the gliomas, which appear dark, suggesting extensive hemorrhaging in the gliomas. The lower panel shows a representative brain MRI of an S100b-v-ErbB+Cdkn2a-/-TSPO+/+ mouse at the age of 250 days. The circled regions indicate the gliomas, which appear relatively white, suggesting little hemorrhaging. No brain MRIs were obtained from S100b-v-ErbB+Cdkn2a-/-TSPO-/- mice because all of these mice died before 210 days. (C) Representative images of a series of slices from S100b-v-ErbB+Cdkn2a-/-TSPO-/- mice and S100b-v-ErbB+Cdkn2a-/-TSPO+/+ littermates at the age of 120 days. Scale bar, 2 mm. (D) Representative images of HE-stained brain slices from S100b-v-ErbB+Cdkn2a-/-TSPO-/- mice (120 days) and S100b-v-ErbB+Cdkn2a-/-TSPO+/+ littermates (250 days). Scale bar, 1 mm for upper images and 100 μm for lower images. (E) Representative images of CD31 immunofluorescence staining of glioma tissues. Scale bar, 20 μm. (F) Quantification of CD31 levels in glioma tissues. (G) Western blot analysis of the levels of the angiogenesis-associated proteins in glioma tissues. (H) Quantification of the relative levels of angiogenesis-associated proteins shown in panel G compared with β-actin. (I) Western blot analysis of HIF-1α levels in TSPO-KO cells compared with WT cells. (J) Normalized HIF-1α levels in panel I. Three independent experiments were performed. The data are presented as means ± SEM. *P < 0.05 and **P < 0.01 as determined using Student’s t-test (F, H, and J) or the Gehan-Breslow-Wilcoxon test (A).
Fig. 3
Fig. 3
TSPO deficiency results in a larger number of fragmented mitochondria and a metabolic shift toward glycolysis. (A) Representative images of the mitochondria in KO and WT cells visualized with MitoTracker staining (red). TSPO was stained with an anti-TSPO antibody (green). Scale bar, 10 μm. (B) Quantification of different types of Mito-DsRed2-labeled mitochondria in (A). (C) Representative confocal microscopy images of the mitochondrial morphology in WT and KO cells transfected with TSPO-GFP or GFP expression vectors. Scale bar, 10 μm. (D) Quantification of different types of Mito-DsRed2-labeled mitochondria in (C). (E) Western blot analysis of the levels of mitochondrial fission/fusion proteins in TSPO-KO and WT GL261 cells. (F) Quantification of the western blot results shown in (E). (G and H) Representative images (G) and quantitative analysis (H) of TMRM staining in TSPO-KO and WT GL261 cells. Scale bar, 10 μm. (I) Measurement of ATP levels in TSPO-KO and WT GL261 cells. (J) Mitochondrial stress test to detect mitochondrial energy metabolism and respiratory functions in WT and KO GL261 cells. (K) Quantification of the mitochondrial stress test in (J). (L) Representative images (L) and quantification of ROS production (M) in both TSPO-KO and WT GL261 cells incubated with H2DCFDA. Scale bar, 10 μm. Three independent experiments were performed. The data are presented as means ± SEM. *P < 0.05, **P < 0.01, and n.s., not significant as determined using Student’s t-test (B, D, F, H, I, K, and M).
Fig. 4
Fig. 4
TSPO deficiency enhances glycolysis in GL261 cells and gliomas. (A) The glycolytic stress test to measure glycolytic activities in TSPO-KO and WT GL261 cells. (B) Quantification of glycolysis, glycolytic capacity, glycolytic reserve and nonglycolytic acidification in (A). (C) Measurement of glycolytic activities in TSPO-KO and WT GL261 cells transfected with TSPO-GFP or GFP expression constructs. (D) Quantification of glycolytic activities in (C). (E) Western blot analysis of the levels of GLUT1, HK1, HK2, PK, and LDH in TSPO-KO and WT gliomas. (F) Normalized levels of the proteins shown in (E). (G) Representative images of immunohistochemical staining with an anti-GLUT1 antibody to examine GLUT1 expression in TSPO-KO and WT gliomas. Scale bar, 1 mm for images in the upper panels and 100 μm for images in the lower panels. (H) Quantification of GLUT1 expression in TSPO-KO or WT gliomas shown in (G). (I) Representative images of immunohistochemical staining with an anti-HK2 antibody to examine HK2 expression in TSPO-KO and WT gliomas. Scale bar, 1 mm for images in the upper panels and 100 μm for images in the lower panels. (J) Quantification of HK2 expression in TSPO-KO and WT gliomas shown in (I). (K) Measurement of glycolytic activities in TSPO-KO GL261 cells treated with the HIF-1α inhibitor PX-478 hydrochloride. (L) Quantification of glycolytic activities in (K). Three independent experiments were performed. The data are presented as means ± SEM. *P < 0.05, **P < 0.01, and n.s., not significant as determined using Student’s t-test (B, D, F, H, J, and L).
Fig. 5
Fig. 5
TSPO regulates glucose uptake and lactic acid conversion. (A and B) Glucose fluorometric assay to measure glucose levels in GL261 cells (in vitro) (A) and gliomas (in vivo) (B). (C) Glucose uptake assay to examine glucose uptake capacities in TSPO-KO and WT cells. Insulin stimulation was used as a positive control. (D) Colorimetric assay to measure pyruvate levels in TSPO-KO and WT GL261 cells. (E) Fluorometric assay to detect acetyl CoA levels in TSPO-KO and WT GL261 cells. (F) Colorimetric assay to measure pyruvate levels in the isolated mitochondria and cytosol from TSPO-KO and WT GL261 cells. (G) Fluorometric assay to measure acetyl CoA levels in isolated mitochondria and cytosol from TSPO-KO and WT GL261 cells. (H–J) Fluorometric assay to measure lactic acid levels in cell culture supernatants (H), GL261 cells (I), and gliomas (J). Three independent experiments were performed. The data are presented as means ± SEM. *P < 0.05 and **P < 0.01 as determined using Student’s t-test (A, B, C, D, E, F, G, H, I, and J).
Fig. 6
Fig. 6
A TSPO antagonist promotes glioma growth by suppressing mitochondrial energy metabolism and increasing glycolysis. (A) Quantification of tumor volumes from mice 30 days after the intracranial injection of WT GL261 cells and treatment with PK11195, Ro5-4864, or PBS. PBS served as the control. (B) Representative images of HE staining in a series of slices from the brains of mice treated with PK11195, Ro5-4864, or PBS. Scale bar, 2 mm. (C) Measurement of glycolytic activities in GL261 cells treated with different compounds. (D) Quantification of glycolytic activities in (C). (E) Mitochondrial stress test to detect mitochondrial energy metabolism and respiratory functions in GL261 cells treated with different compounds. (F) Quantification of the mitochondrial stress test in panel (E). The data are presented as means ± SEM. *P < 0.05 and **P < 0.01 as determined using Student’s t-test (A, D, and F).

References

    1. Li F, Liu J, Garavito RM, Ferguson-Miller S. Evolving understanding of translocator protein 18 kDa (TSPO). Pharmacol Res. 2015;99:404–409. - PMC - PubMed
    1. Lacapère JJ, Papadopoulos V. Peripheral-type benzodiazepine receptor: structure and function of a cholesterol-binding protein in steroid and bile acid biosynthesis. Steroids. 2003;68(7–8):569–585. - PubMed
    1. Banati RB, Middleton RJ, Chan R, et al. . Positron emission tomography and functional characterization of a complete PBR/TSPO knockout. Nat Commun. 2014;5:5452. - PMC - PubMed
    1. Wang H, Zhai K, Xue Y, et al. . Global deletion of TSPO does not affect the viability and gene expression profile. PLoS One. 2016;11(12):e0167307. - PMC - PubMed
    1. Kelly-Hershkovitz E, Weizman R, Spanier I, et al. . Effects of peripheral-type benzodiazepine receptor antisense knockout on MA-10 Leydig cell proliferation and steroidogenesis. J Biol Chem. 1998;273(10):5478–5483. - PubMed

Publication types