. 2019 Dec 3;30(6):1131-1140.e7.
doi: 10.1016/j.cmet.2019.08.023. Epub 2019 Sep 26.

Miro1 Marks Parkinson's Disease Subset and Miro1 Reducer Rescues Neuron Loss in Parkinson's Models

Affiliations

Miro1 Marks Parkinson's Disease Subset and Miro1 Reducer Rescues Neuron Loss in Parkinson's Models

Chung-Han Hsieh et al. Cell Metab. .

Abstract

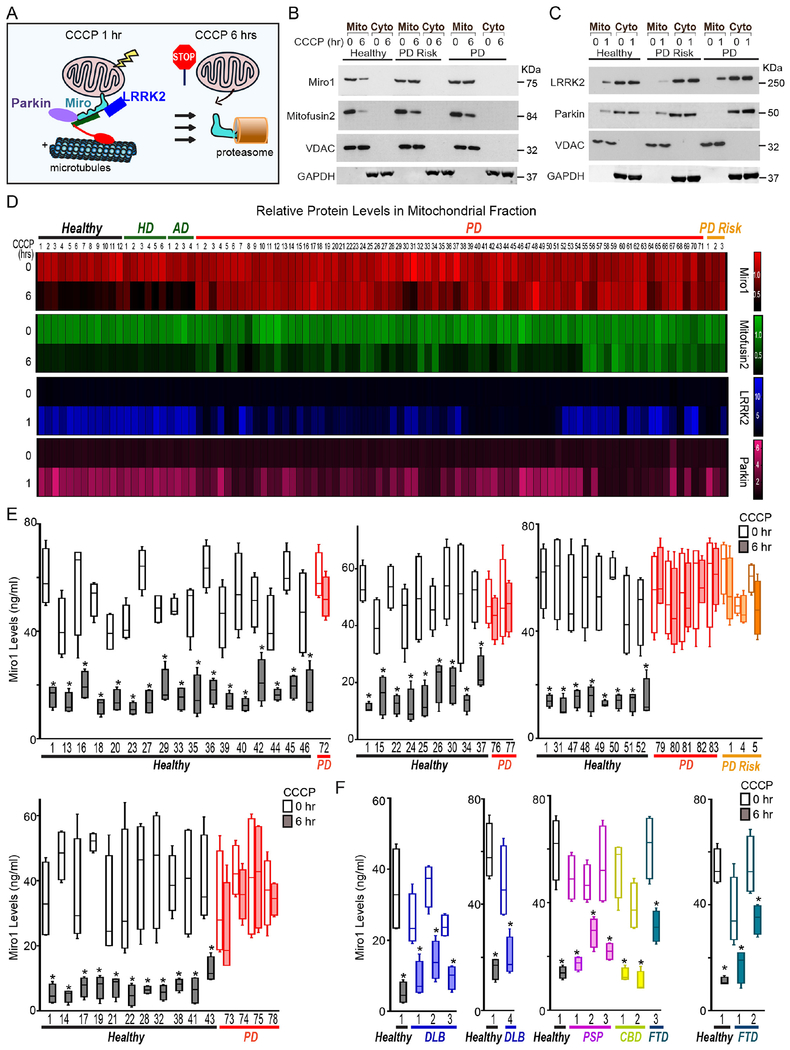
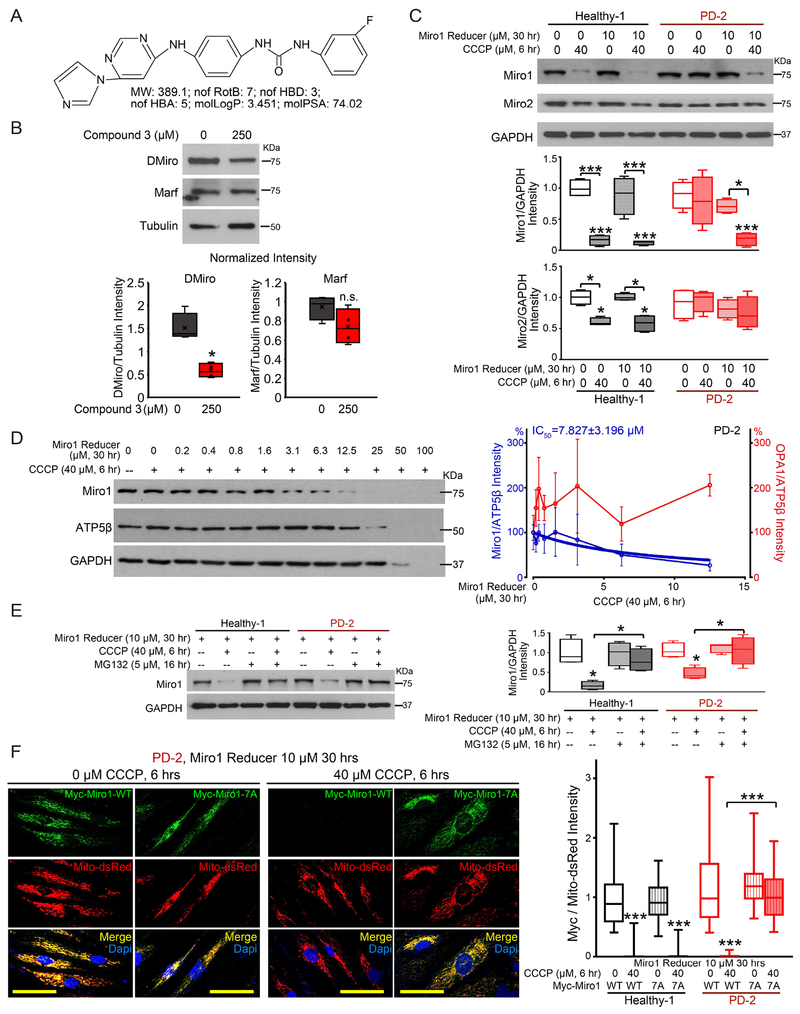
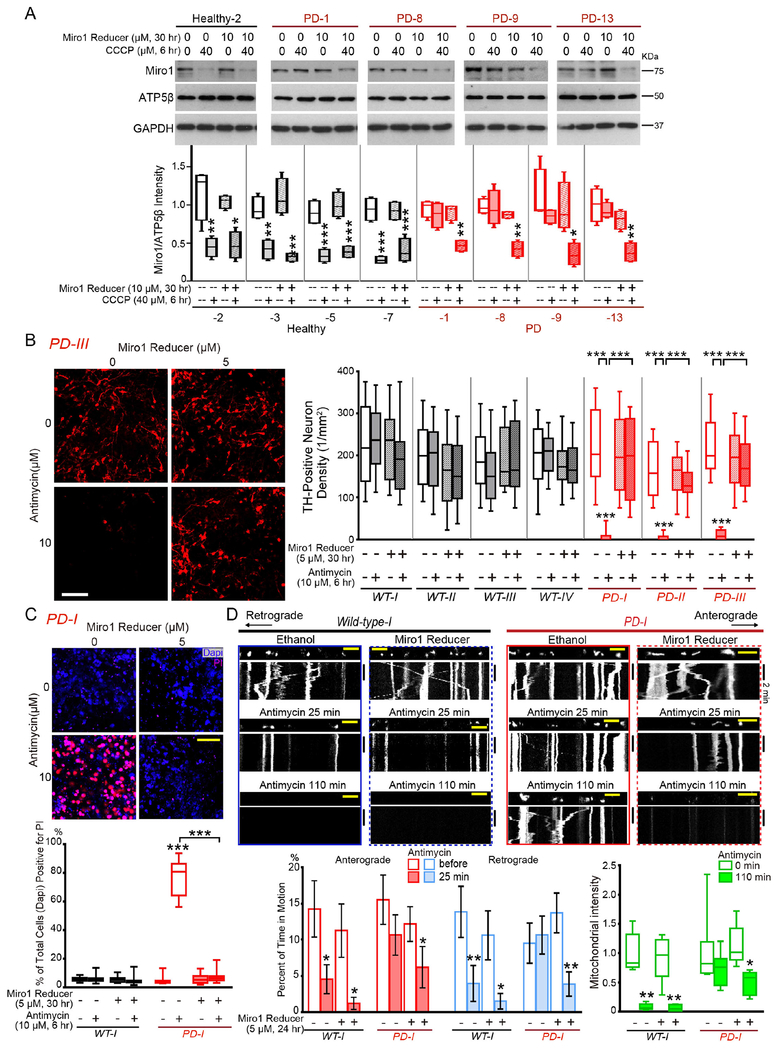
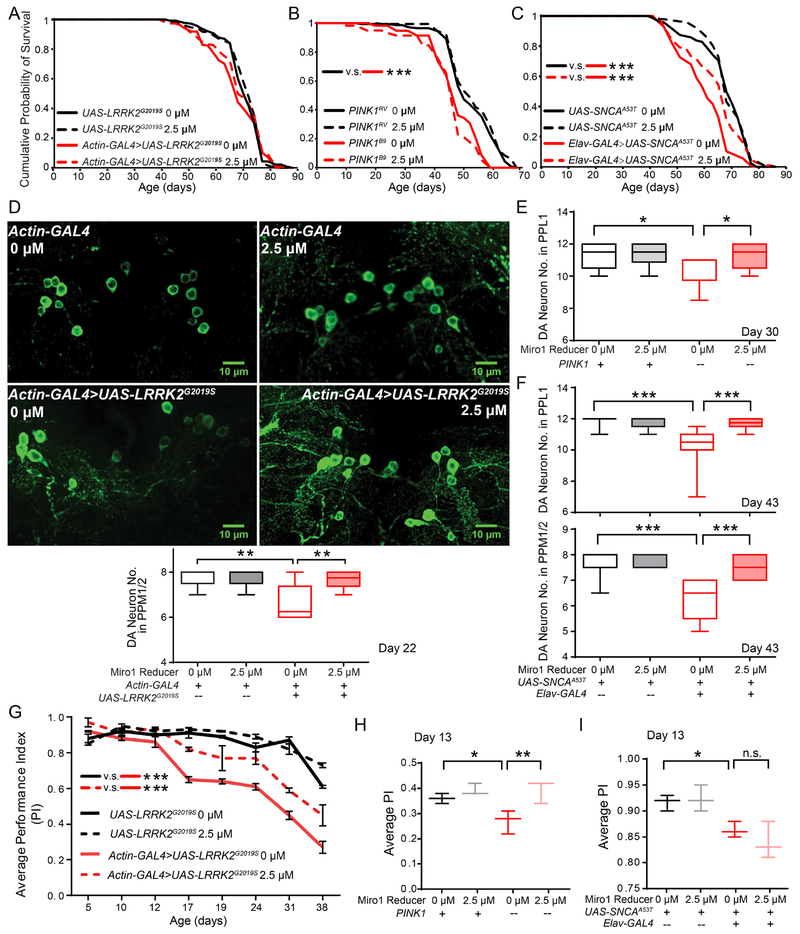
The identification of molecular targets and pharmacodynamic markers for Parkinson's disease (PD) will empower more effective clinical management and experimental therapies. Miro1 is localized on the mitochondrial surface and mediates mitochondrial motility. Miro1 is removed from depolarized mitochondria to facilitate their clearance via mitophagy. Here, we explore the clinical utility of Miro1 for detecting PD and for gauging potential treatments. We measure the Miro1 response to mitochondrial depolarization using biochemical assays in skin fibroblasts from a broad spectrum of PD patients and discover that more than 94% of the patients' fibroblast cell lines fail to remove Miro1 following depolarization. We identify a small molecule that can repair this defect of Miro1 in PD fibroblasts. Treating patient-derived neurons and fly models with this compound rescues the locomotor deficits and dopaminergic neurodegeneration. Our results indicate that tracking this Miro1 marker and engaging in Miro1-based therapies could open new avenues to personalized medicine.

Keywords: Miro1; Parkinson; biomarker; diet; fibroblast; fly; iPSC; mitochondria; mitophagy; neurons; small molecules; therapy.


Conflict of interest statement

NO COMPETING FINANCIAL INTERESTS

Figures

Figure 1.
Figure 1.. Miro1 Response to CCCP in Fibroblasts.
(A) Schematic representation of our readouts. (B, C) Examples of the readouts using Healthy-1, PD-2, and risk-2. (D) Heat maps show the relative mitochondrial protein levels. The intensity of each band in the mitochondrial fraction is normalized to that of the mitochondrial loading control VDAC from the same blot and expressed as a fraction of the mean of Healthy-1 with DMSO treatment; this control was included in every experiment. Mean values are imported into heat maps. n=3-35. (E-F) ELISA of Miro1. n=4 with duplicates each time. Comparison within the same subject. Throughout the paper, *: P<0.05; **: P<0.01; ***: P<0.001. See also Figure S1–S3, Table S1–S2.
Figure 2.
Figure 2.. Miro1 Reducer Eliminates the Miro1 Defect in PD Fibroblasts.
(A) Chemical properties of Miro1 Reducer. (B) Wild-type flies (w1118) were fed with DMSO alone (0 μM Miro1 Reducer) or Miro1 Reducer in DMSO at 250 μM for 7 days, and lysed and blotted as indicated. The band intensities are normalized to those of Tubulin from the same blots. n=4. (C-E) Fibroblasts were treated, lysed, and blotted as indicated. (C) Band intensities are normalized to those of GAPDH from the same blots and compared to “Healthy-1, no treatment” except otherwise indicated. n=4. (D) Band intensities are normalized to those of ATP5β from the same blots and expressed as a percentage of the mean of “0 μM Miro1 Reducer with CCCP”. Mean±S.E.M is shown. n=3. (E) Band intensities are normalized to those of GAPDH from the same blots and compared to “Healthy-1, no CCCP, no MG132” except otherwise indicated. n=4. (F) Healthy-1 and PD-2 fibroblasts were transfected as indicated, and immunostained with anti-Myc (Miro1, green) and stained with Dapi (blue). The Miro1 intensity is normalized to that of mito-dsRed from the same cell and quantified across 37-62 cells from 5 fields each transfection, 3 independent transfections. Scale bars: 50 μm. For (C-F), both CCCP and Miro1 Reducer were dissolved in DMSO. Cells were pretreated with Miro1 Reducer 24 hrs before the application of CCCP for another 6 hrs. The same volume of DMSO was applied at the same time in negative controls. Cell line information is in Table S1. See also Figure S3–S4.
Figure 3.
Figure 3.. Miro1 Reducer Rescues Parkinson’s Neurodegeneration.
(A) Fibroblasts were treated, lysed, and blotted as indicated. Band intensities are normalized to those of ATP5β from the same blots and compared to “Healthy-2, no treatment”. n=4. (B-C) iPSC-derived neurons were treated as indicated and immunostained with anti-TH (B) or stained with PI and Dapi (C). Both Antimycin A and Miro1 Reducer were dissolved in ethanol. Neurons were pretreated with Miro1 Reducer 24 hrs before the application of Antimycin A for another 6 hrs. The same volume of ethanol was applied at the same time in negative controls. (B) The density of TH-positive neurons is calculated in each condition under 20×, from 10 fields each experiment, 3-4 experiments. The neuron densities without Antimycin A are not significantly different among all conditions (p=0.0682). (C) The percentage of Pi-positive cells out of total cells (Dapi-positive) is calculated. n=20 fields each experiment, 4 experiments. For (B-C), comparisons with “Wild-type-I, no treatment” except otherwise indicated. (D) Mitochondrial movement (mito-dsRed) in representative axons pretreated with 5 μM Miro1 Reducer for 24 hrs, and then after treatment with 100 μM Antimycin A. The first frame of each live-imaging series is shown above a kymograph generated from the movie. Graphs of Mean±S.E.M show the percent of time each mitochondrion is in motion (red and blue, compared to “Wild-type-I, before treatment”), and the mitochondrial intensity normalized to that of the same axonal region at “0 min” and expressed as a fraction of the mean of “Wild-type-I, 0 min”. n=33-77 mitochondria from 5-8 axons from 5-8 separate transfections. Scale bars: (B, C) 100 μm; (D) 10 μm. See also Figure S3–S4.
Figure 4.
Figure 4.. Miro1 Reducer Rescues PD-Relevant Phenotypes in Flies.
For all panels, when Miro1 Reducer was not added, the same volume of the solvent, DMSO, was supplied in fly food. Drug administration (2.5 μM) was started from day 2. (A-C) Survival curves of LRRK2G2019S (A), PINK1B9 (imprecise excision, null) and PINK1RV (the precise excision control for PINK1B9) (B), and SNCAA53T flies (C). n=58-150. (D) Dopaminergic (DA) neurons in the PPM1/2 clusters of 22-day old flies were immunostained with anti-TH. (D-F) Quantification of the DA neuron number in the PPL1 or PPM1/2 cluster (total number divided by 2 for each brain). (D) LRRK2 G2019S. n=6-8 brains. (E) PINK1B9 (“−”) and PINK1RV (“+”). n=9-16. (F) SNCAA53T. n=9-11. (G-I) Climbing ability (Average PI±S.E.M) of adult flies. n=24-47 flies. See also Figure S3–S4.

References

    1. Bartels T (2016). Conformation-Specific Detection of alpha-Synuclein: The Search for a Biomarker in Parkinson Disease. JAMA Neurol. - PubMed
    1. Bonifati V (2002). Deciphering Parkinson’s disease--PARK8. The Lancet Neurology 1, 83. - PubMed
    1. Bruns RF, and Watson IA. (2012). Rules for identifying potentially reactive or promiscuous compounds. J Med Chem 55, 9763–9772. - PubMed
    1. Byers B, Cord B, Nguyen HN, Schule B, Fenno L, Lee PC, Deisseroth K, Langston JW, Pera RR, and Palmer TD (2011). SNCA triplication Parkinson’s patient’s iPSC-derived DA neurons accumulate alpha-synuclein and are susceptible to oxidative stress. PloS one 6, e26159. - PMC - PubMed
    1. Castillo-Quan JI, Li L, Kinghorn KJ, Ivanov DK, Tain LS, Slack C, Kerr F, Nespital T, Thornton J, Hardy J, et al. (2016). Lithium Promotes Longevity through GSK3/NRF2-Dependent Hormesis. Cell Rep 15, 638–650. - PMC - PubMed

Publication types

MeSH terms