. 2019 Oct 7;29(19):3200-3215.e5.
doi: 10.1016/j.cub.2019.08.008. Epub 2019 Sep 26.

Shared Song Detector Neurons in Drosophila Male and Female Brains Drive Sex-Specific Behaviors

Affiliations

Shared Song Detector Neurons in Drosophila Male and Female Brains Drive Sex-Specific Behaviors

David Deutsch et al. Curr Biol. .

Erratum in

Abstract

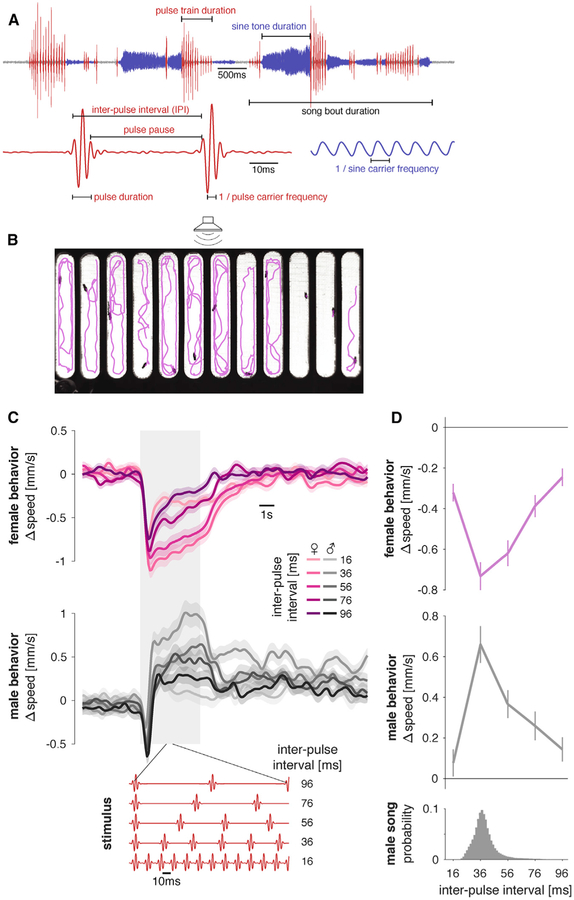
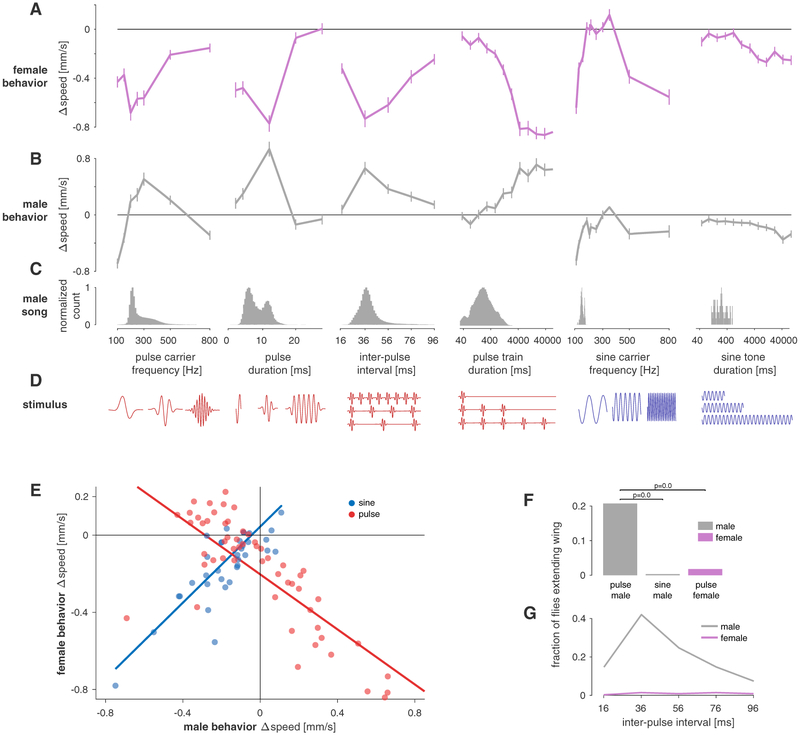
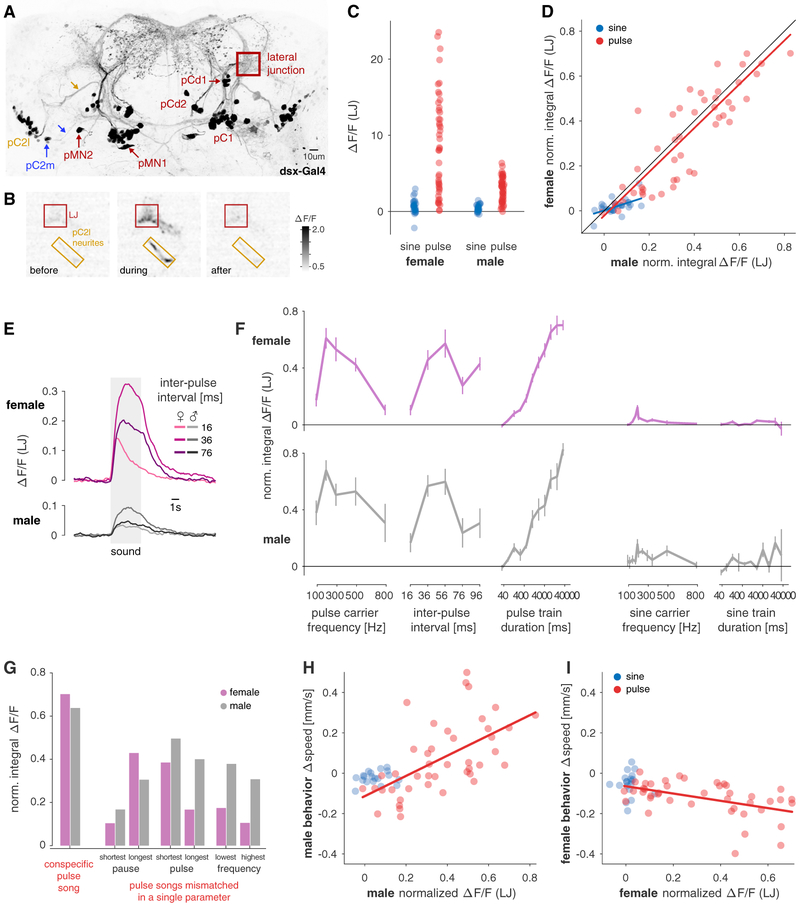
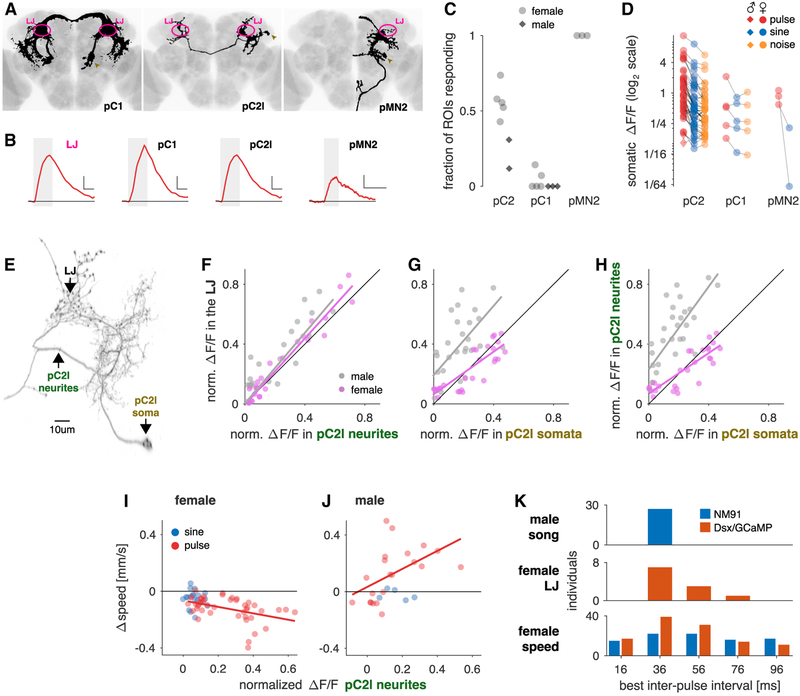
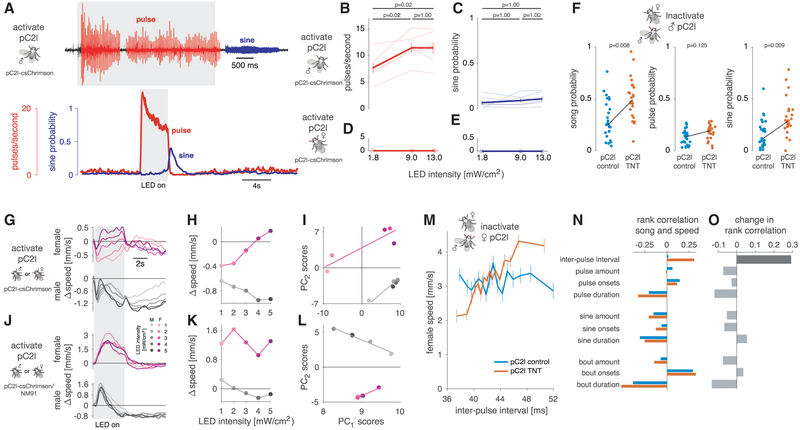
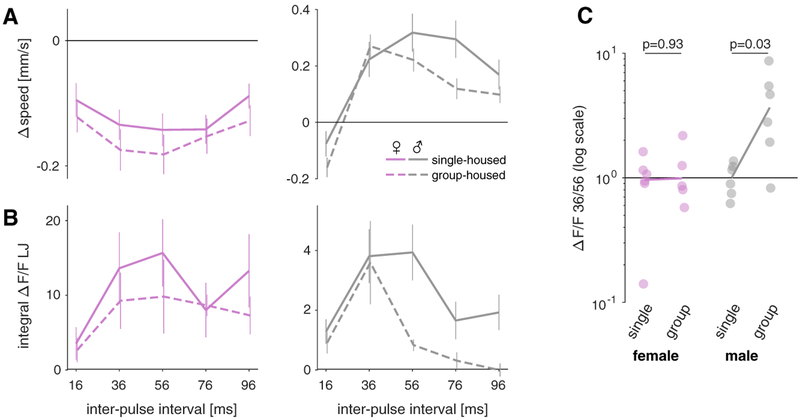
Males and females often produce distinct responses to the same sensory stimuli. How such differences arise-at the level of sensory processing or in the circuits that generate behavior-remains largely unresolved across sensory modalities. We address this issue in the acoustic communication system of Drosophila. During courtship, males generate time-varying songs, and each sex responds with specific behaviors. We characterize male and female behavioral tuning for all aspects of song and show that feature tuning is similar between sexes, suggesting sex-shared song detectors drive divergent behaviors. We then identify higher-order neurons in the Drosophila brain, called pC2, that are tuned for multiple temporal aspects of one mode of the male's song and drive sex-specific behaviors. We thus uncover neurons that are specifically tuned to an acoustic communication signal and that reside at the sensory-motor interface, flexibly linking auditory perception with sex-specific behavioral responses.

Keywords: Drosophila; acoustic communication; auditory; behavior; courtship; neural circuits; pattern recognition; sensorimotor transformation; sexually dimorphic; social experience; song detection.


Conflict of interest statement

DECLARATION OF INTERESTS

The authors declare no competing interests.

Figures

Figure 1.
Figure 1.. FLyTRAP Assay for Comparing Locomotor Tuning for Courtship Song Stimuli in Males and Females
(A) Drosophila melanogaster produces song in bouts that can consist of two modes: sine song corresponds to a weakly amplitude modulated oscillation with a species-specific carrier frequency (~150 Hz) and pulse song corresponds to trains of Gabor-like wavelets each with a carrier frequency between 220 and 450 Hz and a duration between 6 and 12 ms. These pulses are produced at an inter-pulse interval (IPI) of 30–45 ms. (B) FLyTRAP consists of a behavioral chamber that is placed in front of a speaker through which sound is presented. Fly movement is tracked using a camera. Shown is a single video frame of females in the assay with fly tracks for the preceding 20 s overlaid in magenta. See Video S1. (C) Locomotor responses of females (magenta) and males (gray) for pulse trains with different IPIs (see legend). The gray shaded box indicates the duration of the sound stimulus. Red traces at the bottom of the plot show short snippets of five of the stimuli presented in this experiment. The baseline speed was subtracted before trial averaging. (D) Speed tuning curves for different IPIs in females (magenta) and males (gray) are obtained by averaging the speed traces in the 6 s following stimulus onset. The histogram at bottom shows the IPI distribution found in male song (data from 47 males of NM91 wild-type strain totaling 82,643 pulses). Lines and shaded areas or error bars in (C) and (D) correspond to the mean ± SEM across 112 male and 112 female flies. All Δspeed values from the wild-type strain NM91. See also Figure S1, Video S1, and Table S1.
Figure 2.
Figure 2.. Responses to Song Playback Are Sex Specific and Tuned for Multiple Features of Pulse and Sine Song (A and B) Locomotor tuning curves for females
(A, magenta) and males (B, gray) for 6 different features of pulse and sine song. Lines and error bars correspond to the mean ± SEM across flies (see Table S1 for a description of all stimuli and n flies). (C) Distribution of the six different song features tested in (A) and (B) in the natural courtship song of Drosophila melanogaster males (data from 47 males of NM91 wild-type strain totaling 82,643 pulses and 51 min of sine song from 5,269 song bouts). Histograms are normalized to a maximum of 1.0. (D) Pictograms (not to scale) illustrating each song feature examined in (A)–(C). Pulse and sine song features are marked red and blue, respectively. (E) Changes in speed for males and females for all pulse (red) and sine (blue) stimuli tested (data are from A, B, and Figure S2). Each dot is the average behavioral response for one pulse or sine stimulus. Responses to sine stimuli are strongly and positively correlated between sexes (r = 0.89, p = 6 × 10⁻⁸). Pulse responses are also strongly but negatively correlated (r = −0.63, p = 5 × 10⁻¹⁰). Blue and red lines correspond to linear fits to the responses to sine and pulse song, respectively. (F) Fraction of trials for which male and female flies extended their wings during the playback of pulse song (five different IPIs as in Figures 1C and 1D) and sine song (150 Hz, quantified only for males). Solitary males (gray) frequently extend their wings in response to pulse but not to sine song. Solitary females (magenta) do not extend wings for pulse song. See also Video S2. p values were obtained from a two-sided chi-square test. (G) Fraction of trials that evoke wing extension in males (gray) and females (magenta) as a function of IPI. In males, wing extension and locomotor behavior (Figure 1D) exhibit strikingly similar tuning with a peak at the conspecific IPI. Females almost never extend their wing for any IPI. All behavioral data are from the wild-type strain NM91. All correlation values are Spearman’s rank correlation. See also Figures S1 and S2, Video S2, and Table S1.
Figure 3.
Figure 3.. Neuronal Tuning of Dsx+ Neurons in the LJ Matches Behavioral Tuning for Pulse Stimuli in Males and Females
(A) Anatomy of Dsx+ neurons in the female brain. Max z-projection of a confocal stack of a fly brain in which all Dsx+ are labeled with GFP. 5/8 cell types (pC1, pC2l [yellow], pC2m [blue], pMN1, pMN2) project to the LJ, while 3 cell types (pCd1, pCd2, aDN) do not. Yellow and blue arrows point to the neurites that connect pC2l and pC2m to the LJ. See also Figures S4B and S4C. (B) Grayscale image (see color bar) of calcium responses (ΔF/F) to a pulse train (IPI 36 ms) in a region of interest (ROI) centered around the LJ (red) and the pC2l neurites (yellow) in a female. Shown are snapshots of the recording at three different time points relative to stimulus onset—before (T = −10 s), during (T = 1.2 s), and after (T = 20 s) the stimulus. Flies express GCaMP6m in all Dsx+ cells. Conspecific pulse song elicits strong increases in fluorescence in the LJ and the pC2 neurites. (C) LJ responses to sine (blue) and pulses (red) stimuli in females (left) and males (right). Individual dots correspond to average integral ΔF/F responses (across 3–12 flies per stimulus) for individual pulse and sine stimuli. Many pulse stimuli evoke much stronger responses than the most effective sine stimulus (p = 8 × 10⁻¹¹ for females and p = 2 × 10⁻¹¹ for males, two-sided rank-sum comparison of sine and pulse responses). (D) Comparison of male and female LJ responses to sine (blue) and pulse (red) stimuli. Responses to both song modes are correlated strongly for pulse (r = 0.85, p = 1 × 10⁻¹⁴) and moderately for sine (r = 0.48, p = 0.007) stimuli. Individual dots correspond to the average integral ΔF/F for each pulse or sine stimulus. Before averaging, the responses of each animal were normalized to compensate for inter-individual differences in calcium levels (see STAR Methods for details). (E) Fluorescence traces from the LJ in females (top, magenta) and males (bottom, gray) for pulse trains with three different IPIs (see legend, average over 6 individuals for each sex). In both sexes, the LJ responds most strongly to the conspecific IPI of 36 ms (Figure 1D). Responses are much weaker for shorter (16 ms) and longer (76 ms) IPIs. Calcium responses in the LJ are smaller in males than in females (cf. C). See Video S3. (F) Tuning curves of calcium responses in the female (magenta) and the male (gray) LJ for features of pulse and sine song (cf. behavioral tuning in Figures 2A and 2B). Lines and error bars correspond to the mean ± SEM across flies. Integral ΔF/F normalized as in (D). (G) pC2 calcium responses to the conspecific pulse song (left), pulse song stimuli with a mismatch in a single feature (right) in males (gray) and females (magenta). A single mismatch reduces neuronal responses by at least 20% and up to 80%, indicating the high, multi-feature selectivity of pC2 in both sexes. The conspecific pulse song is shown as a reference (pulse duration 12 ms, pulse pause 24 ms, pulse carrier frequency 250 Hz, 112 pulses). Mismatch stimuli differed only in a single parameter from the reference (shortest pause: 4 ms, longest pause: 84 ms; shortest pulse: 4 ms, longest pulse: 60 ms, lowest frequency: 100 Hz, highest frequency: 800 Hz). (H and I) Comparison of behavioral and neuronal tuning in males (H) and females (I). Behavioral and neuronal data are from flies of the same genotype (Dsx/GCaMP). We obtained similar results when comparing the neuronal responses to behavioral data from wild-type strain NM91, Figures S3H and S3I. Each dot corresponds to the average Δspeed and the average normalized integral ΔF/F for a given pulse or sine stimulus. Lines indicate linear fits. In males (H), behavioral and neuronal responses are positively correlated for pulse (red, r = 0.61, p = 1 × 10⁻⁵) but not for sine stimuli (blue, r = 0.17, p = 0.49). In females (I), behavioral and neuronal responses are negatively correlated for pulse (red, r = −0.53, p = 3 × 10⁻⁴ but not for sine stimuli (blue, r = 0.28, p = 0.25). All Δspeed and ΔF/F values are from Dsx/GCaMP flies and the two measurements were made in separate individuals. (K) additionally shows behavioral data from the wild-type strain NM91. All correlation values are Spearman’s rank correlation. See also Figures S2 and S3, Video S3, and Table S1.
Figure 4.
Figure 4.. pC2 Neurons Are Pulse Song Detectors Common to Both Sexes
(A) Individual Dsx+ neuron types (black) with somas in the female central brain in which we detected calcium responses for pulse or sine song, registered to a common template brain (gray) (see STAR Methods for details). Of the 8 Dsx+ cell types in the central brain, pC2l, pC2m, the single female-only neuron pMN2, and a small number of pC1 neurons (and only in some individuals) respond to courtship sounds. The LJ is marked in magenta, and somata are marked with golden arrowheads. (B) Example somatic fluorescence traces from single somata of the pC1, pC2, and pMN2 cells in response to pulse trains (IPI = 36 ms, single trial responses). Fluorescence trace from the LJ (magenta) shown for comparison. The gray box marks the duration of the sound stimulus. In each panel, horizontal and vertical scale bars correspond to 6 s and 0.25 ΔF/F, respectively. Horizontal black line marks ΔF/F = 0. (C) Fraction of cells in Dsx+ clusters with detectable somatic calcium responses to pulse or sine song (females, light gray dots; males, dark gray squares; each dot is the fraction per fly). Complete clusters were imaged using volumetric scan for pC1, pC2, and single plane scans for pMN2. We did not distinguish between pC2l/m, since in most flies both groups are spatially intermingled at the level of cell bodies. Note that all flies included showed calcium responses to sound in the LJ, even when we did not detect responses in specific somata. (D) Peak somatic ΔF/F for pulse (red, 36 ms IPI), sine (blue, 150 Hz), and noise (orange, 100–900 Hz). Dots correspond to the trial average for each fly. Lines connect responses recorded in the same animal. Note that responses are plotted on a log scale—the average of the ratio between sine and pulse for all cells is ~2.6. 36/38 pC2, 4/5 pC1, and 2/2 pMN2 prefer pulse over sine. See also Video S4. (E) High-resolution confocal scan of a single pC2l neuron (obtained via a stochastic labeling technique, see STAR Methods for details). Only the side ipsilateral to the cell body is shown. The neurites in the LJ appear varicose, indicating that they contain pre-synaptic sites. (F) Normalized integral ΔF/F values recorded simultaneously in the LJ, and the neurites that connect the LJ with the somata of pC2l (and no other Dsx+ cell type) are highly correlated in females (magenta, r = 0.99, p = 1 × 10−71, n = 10–24 flies/stimulus) and males (gray, r = 0.75, p = 4 × 10⁻¹³, n = 1–6 flies/stimulus). Each point corresponds to an individual stimulus (pulse or sine) averaged over flies. The high correlation indicates that calcium responses in the LJ reflect responses in pC2l neurons. Magenta and gray lines in (F)–(H) correspond to a least-squares fit to the individual data points. (G) Normalized integral ΔF/F recorded first in the LJ and then in single pC2l somata in the same fly are highly correlated in both sexes (females: r = 0.86, p = 8 × 10⁻¹⁰, n = 8 flies/stimulus, males: r = 0.73, p = 4 × 10⁻⁶, n = 1 fly/stimulus), demonstrating that calcium responses in the LJ represent the responses of individual pC2l cells, with some variability across individual cells and animals. (H) Normalized integral ΔF/F responses from the pC2l neurites and from single pC2l somata in different flies are highly correlated in both sexes (females: r = 0.89, p = 2 × 10⁻¹¹, n = 8 flies/stimulus, males: r = 0.79, p = 1 × 10⁻⁷, n = 1 fly/stimulus). The pC2l neurites reflect the average activity of individual pC2l neurons, with some variability across individual cells and animals. (I and J) Comparison of calcium responses in the pC2l neurites and male (I) or female (J) speed for the same stimuli. Calcium and speed data come from different flies of the same genotype (Dsx/GCaMP). Similar results were obtained when using speed data from wild-type flies (NM91) instead (Figures S4G and S4H). pC2l and behavioral responses are highly correlated for pulse with a sex-specific sign (female, I: pulse: r = −0.49, p = 1 × 10⁻³, sine: r = −0.09, p = 0.73; male, J: pulse: r = 0.70, p = 5 × 10⁻⁴, sine: r = −0.20, p = 0.78), just as for the LJ (cf. Figure 3I). The match between neuronal and behavioral tuning for pulse song indicates that pC2l neurons detect the pulse song. Each point corresponds to the average response to an individual pulse or sine stimulus (Δspeed: n ~ 100 flies per stimulus, ΔF/F: n = 10–24 female and 1–6 male flies/stimulus). (K) Comparison across individuals of most frequent IPIs in male song (n = 75,528 pulses from 27 males) and preferred IPIs in the female LJ (integral ΔF/F; n = 11 females) and behavior (Δspeed; n = 112 females NM91 and 92 females Dsx/GCaMP). Song and speed are shown for NM91 (blue); LJ and speed are shown for Dsx/GCaMP (orange). While all males produce songs with IPIs around 36 ms, female neuronal and behavioral tuning for IPI is much more variable (SDs: 2.4 ms for male song, 14 ms for female ΔF/F [for integral ΔF/F (shown), 7 ms for peak ΔF/F], 23 and 27 ms for the speed of NM91 and Dsx/GCaMP females, respectively). Notably, variability in female speed is larger than in the female LJ, indicating that pathways parallel to or downstream of the LJ contribute to the behavior. All Δspeed and ΔF/F values are from flies expressing GCaMP6m under the control of Dsx-Gal4 and were measured in separate individuals. All correlation values are Spearman’s rank correlation. See also Figure S4, Video S4, and Table S1.
Figure 5.
Figure 5.. Testing the Necessity and Sufficiency of pC2 Neurons for Song and Locomotor Behaviors
(A) Song evoked in males by optogenetic activation (627 nm LEDs, intensity 13 mW/cm2) of a driver line that labels pC2l and pCd neurons (R42B01∩Dsx, referred to as pC2l-csChrimson). Top trace shows a song recording marking pulse and sine song in red and blue, respectively. The gray area indicates the duration (4 s) of optogenetic activation. Pulse song is evoked during activation while sine song occurs immediately following activation. Bottom plots show pulse rate (red) and sine song probability (blue) averaged over 7 flies (18 stimulation epochs per animals). See Video S5. Activation of pC2l using a different genotype (pC2l-csChrimson/NM91) has similar effects (Figures S6A and S6B) (B and C) Average pulse rate (B) and sine song probability (C) evoked in the 6 s following LED light onset (LED duration is 4 s). Dose-response curves for individuals are shown as thin lines; population averages (mean ± SEM) are shown as thick lines with error bars. p values result from two-sided sign tests and are adjusted for multiple comparisons using Bonferroni’s method. Same data as in (A) are shown. (D and E) Same as (B) and (C) but for females (n = 3 flies). Activation of pC2l (and pCd) in the female does not evoke song—pC2l activation drives singing in a sex-specific manner (F) Song of males courting wild-type NM91 females. pC2l synaptic output in the males was inhibited using TNT via the R42B01XDsx driver. Dots correspond to the amount of all song (left), pulse song (middle), and sine song (right) per fly (pC2l TNT (n = 24)—orange, pC2l control (n = 25)—blue). Black lines connect the means of the two genotypes. p values show the outcome of a two-sided rank-sum test. Inhibiting pC2l output leads to more overall singing and sine song, but not to more pulse song, indicating that pC2l biases singing toward pulse song during courtship. Other song features are not affected (see Figures S5F and S5G). (G and H) Optogenetic activation of R42B01∩Dsx using csChrimson (pC2l-csChrimson) evokes locomotor responses with sex-specific dynamics. Changes in speed (G) and tuning curves (H) were corrected for intrinsic light responses by subtracting the responses of control flies with the same genotype that were not fed retinal (see Figure S6A). Females (top, magenta) slow for weak and speed for strong activation with multi-phasic dynamics. Males decrease their speed and responses outlast the optogenetic stimulus (bottom, gray). See Figure S6A for n flies. The gray area indicates the duration of LED stimulation (4 s). (I) Principal-component analysis (PCA) of male and female locomotor speed traces (12 s following stimulus LED or sound onset, traces taken from G). Shown are first and second principal-component (PC) scores of females (magenta) and males (gray) for sound (squares) and optogenetic stimulation (circles). Lines correspond to linear fits for each sex. Female and male responses to different LED occupy different areas in PC space, indicating that the locomotor dynamics are sex specific. (J and K) Same as (G) and (H) but with a different genotype (pC2l-csChrimson/NM91—see STAR Methods for details). Females (top, magenta) speed throughout the stimulation (J) and for all LED intensities (K). Males (bottom, gray) first speed and then slow for all LED intensities. The evoked locomotor dynamics differ between genotypes (I) but are always sex specific. (L) Same as (I) but with the pC2l-csChrimson/NM91 phenotype. Again, male and female locomotor responses are different, since they occupy different regions in PC space (compare [I]). (M) Locomotor tuning for inter-pulse interval during natural courtship obtained from single females that were courted by a wild-type NM91 male. pC2l synaptic output in the females was inhibited with TNT using the R42B01Dsx driver. Lines and error bars correspond to the mean ± SEM speed over 48 females per genotype tested (pC2l TNT–orange, pC2l control – blue, see methods for details on how the tuning curves were computed). pC2l control females (blue) do not change their speed with IPI within the range commonly produced by males (r = 0.02, p = 0.59, compare Figure 1D). pC2l TNT females (orange) accelerate for longer IPIs (r = 0.31, p = 3×10–30). (N) Rank correlation between female speed and different song features during natural courtship (pC2l control – blue, pC2l TNT – orange). (O) Difference between the rank correlations for control (blue) and pC2l TNT (orange) flies in (N). pC2l inactivation specifically changes the correlation between female speed and IPI (dark gray, p = 6×10⁻⁸). All other changes in correlation are much smaller and not significant (p > 0.18). p values were obtained by fitting an ANCOVA model (see methods for details) and were corrected for multiple comparisons using the Bonferroni method. All correlation values are Spearman’s rank correlation. See also Figure S5 and Video S5.
Figure 6.
Figure 6.. Behavioral and pC2 Responses Are Similarly Modulated by Social Experience
(A) Changes in speed for pulse trains measured using FLyTRAP with different IPIs in single-housed (solid line) or group-housed (dashed lines) female (left, magenta) and male flies (right, gray). Plots show mean ± SEM across 92/116 group-housed and 137/71 single-housed female/male flies. Female IPI tuning is not strongly affected by housing conditions. By contrast, males change their speed more selectively when group housed. (B) Calcium responses from the LJ for pulse trains with different IPIs in single-housed (solid line) or group-housed (dashed lines) female (left, magenta) and male flies (right, gray). Plots show mean ± SEM across 5–6 female or male flies in each condition. In females, group housing only weakly suppresses LJ responses for some IPIs. By contrast, male LJ responses are selectively suppressed for long IPIs, which sharpens the IPI tuning. (C) Ratio of calcium responses to 36 and 56 ms IPIs in single-housed or group-housed female (left, magenta) and male flies (right, gray). Individual dots correspond to individual flies; the solid lines connect the population average ratios. p values were obtained from a two-sided Wilcoxon rank-sum test. All Δspeed and ΔF/F values are from flies expressing GCaMP6m under the control of Dsx-Gal4, and the two measurements were made in separate flies. See also Figure S6.

References

    1. Yang CF, and Shah NM (2014). Representing Sex in the Brain, One Module at a Time. Neuron 82, 261–278. - PMC - PubMed
    1. Dulac C, and Wagner S (2006). Genetic Analysis of Brain Circuits Underlying Pheromone Signaling. Annu. Rev. Genet 40, 449–467. - PubMed
    1. Wang L, and Anderson DJ (2010). Identification of an aggression-promoting pheromone and its receptor neurons in Drosophila. Nature 463, 227–231. - PMC - PubMed
    1. Kurtovic A, Widmer A, and Dickson BJ (2007). A single class of olfactory neurons mediates behavioural responses to a Drosophila sex pheromone. Nature 446, 542–546. - PubMed
    1. Billeter J-C, Atallah J, Krupp JJ, Millar JG, and Levine JD (2009). Specialized cells tag sexual and species identity in Drosophila melanogaster. Nature 461, 987–991. - PubMed

Publication types

LinkOut - more resources