. 2019 Dec 5;25(6):830-845.e8.
doi: 10.1016/j.stem.2019.08.017. Epub 2019 Sep 26.

PRDM16 Maintains Homeostasis of the Intestinal Epithelium by Controlling Region-Specific Metabolism

Affiliations

PRDM16 Maintains Homeostasis of the Intestinal Epithelium by Controlling Region-Specific Metabolism

Rachel R Stine et al. Cell Stem Cell. .

Abstract

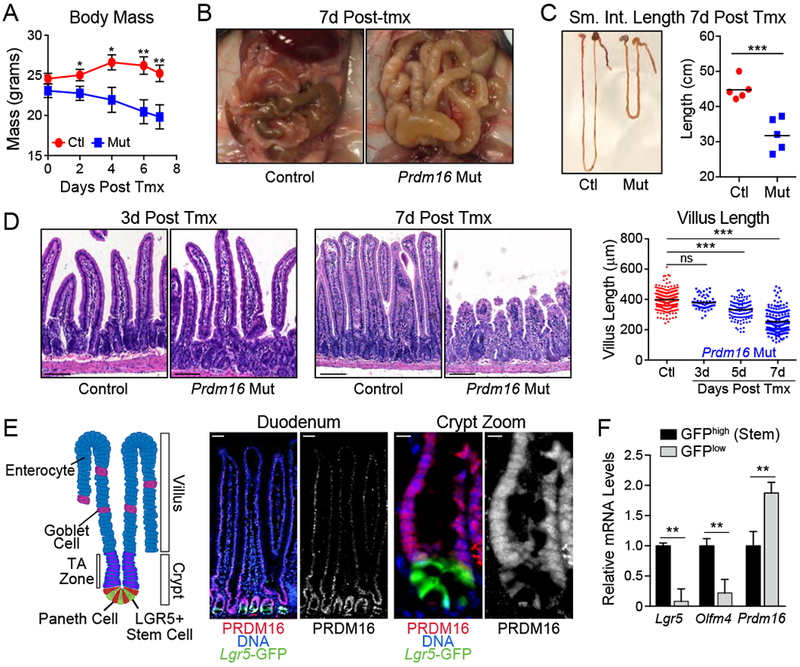
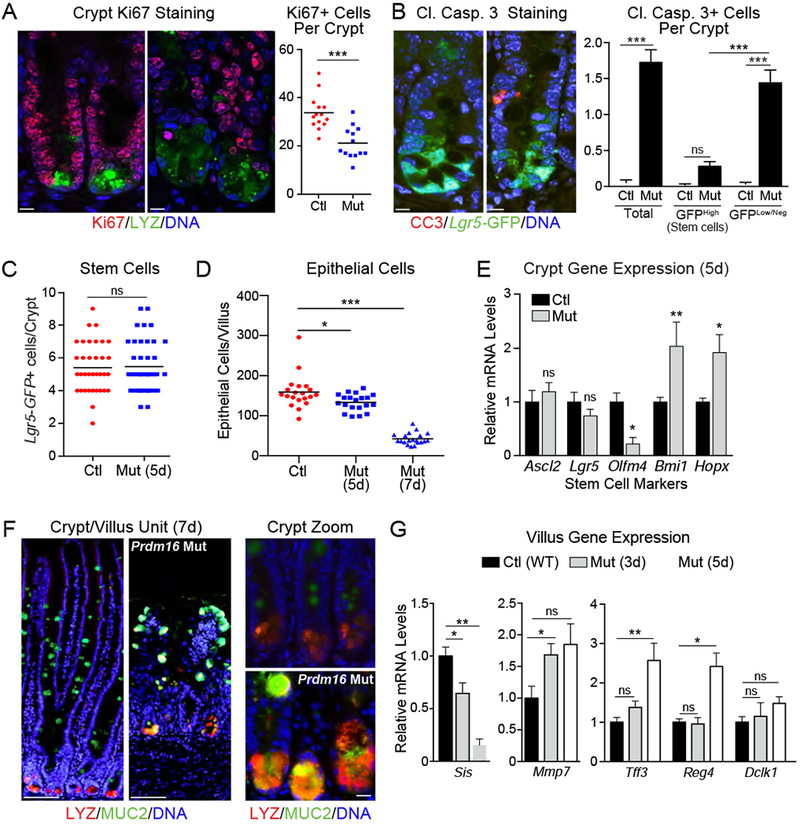
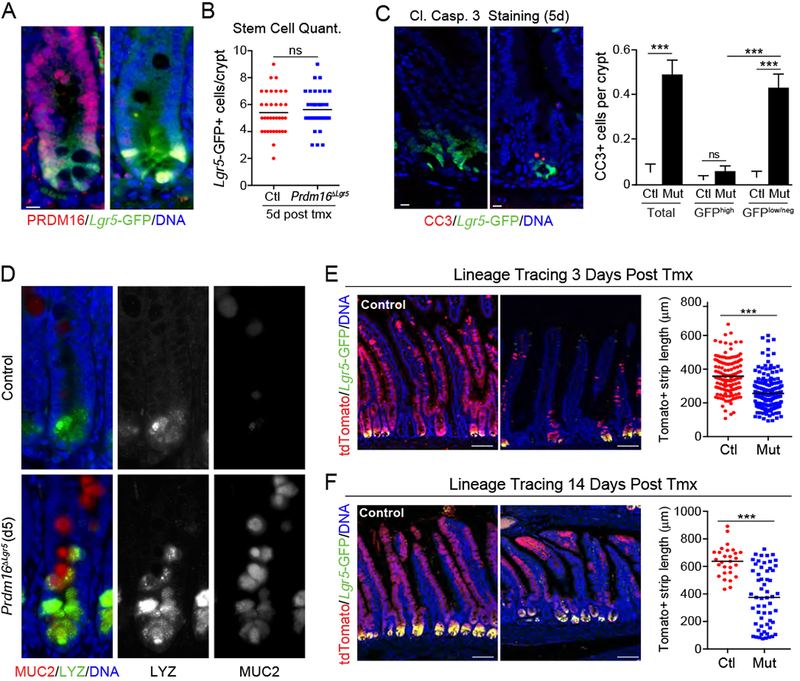
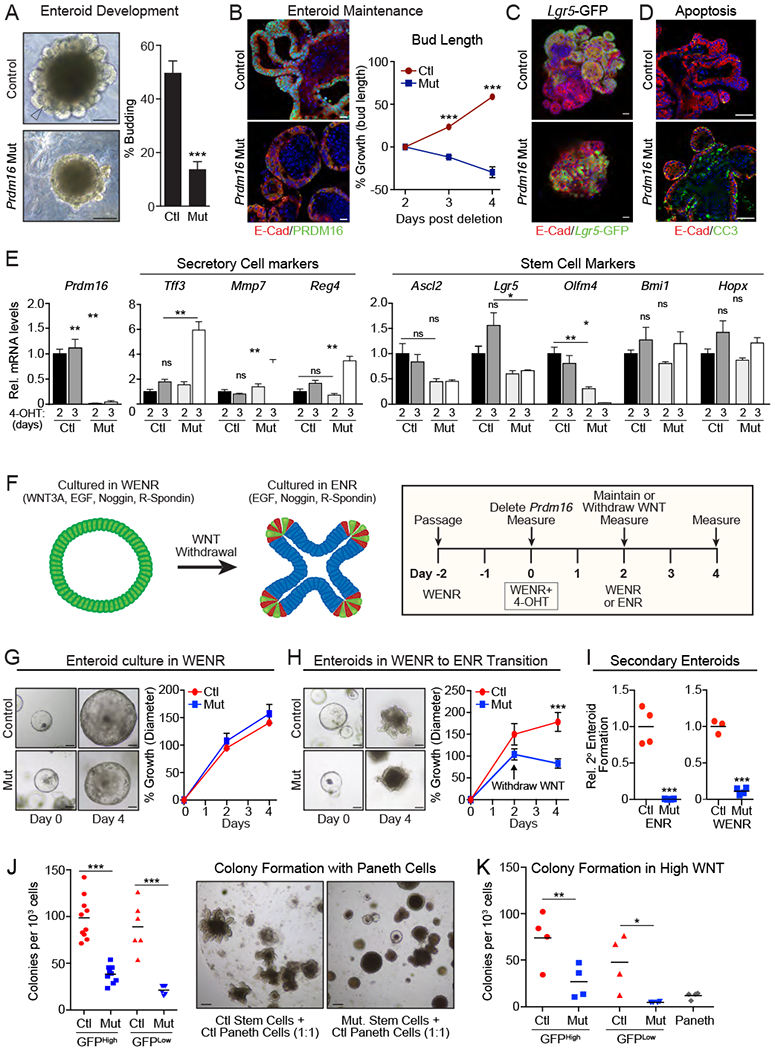
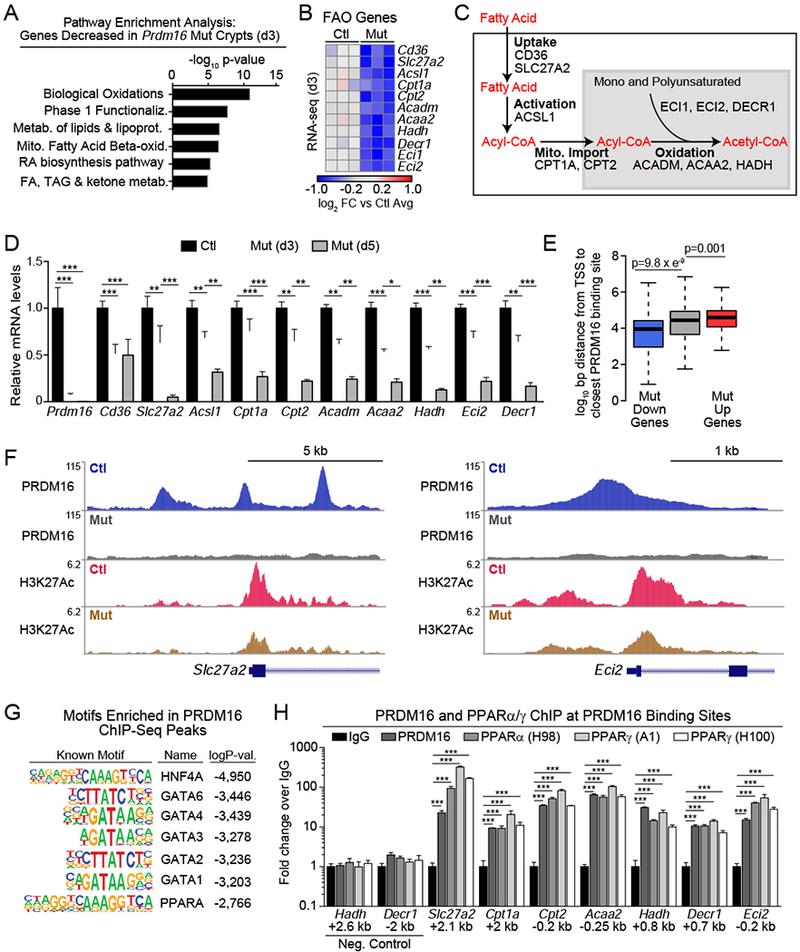
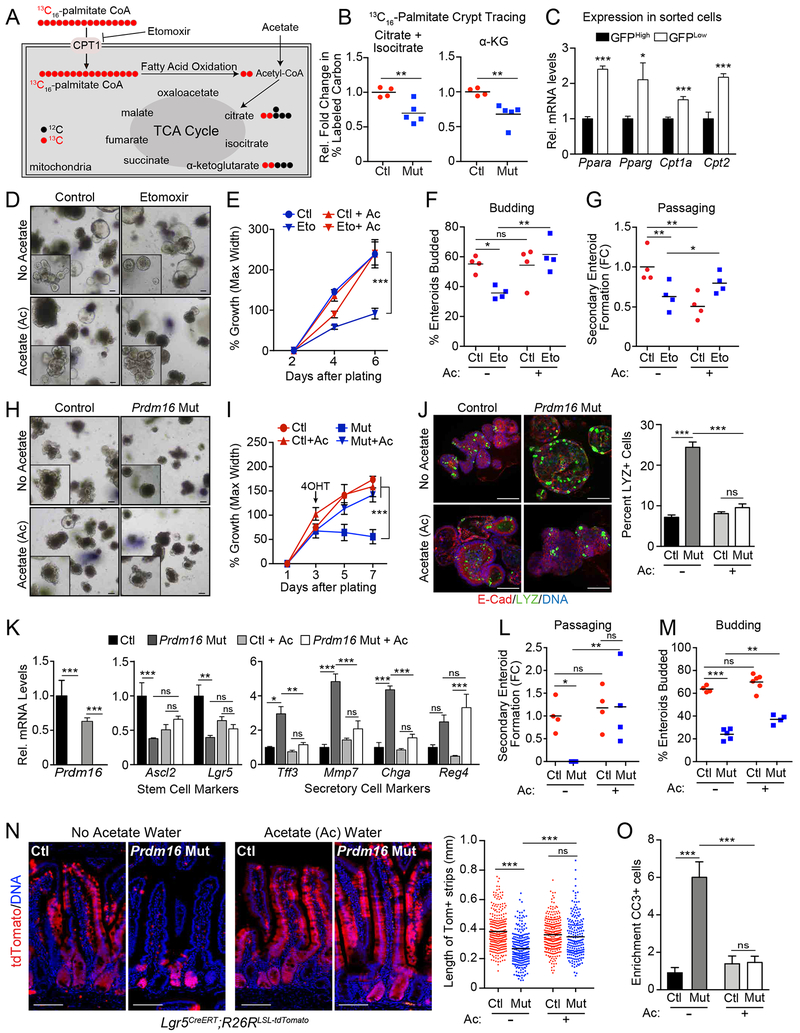
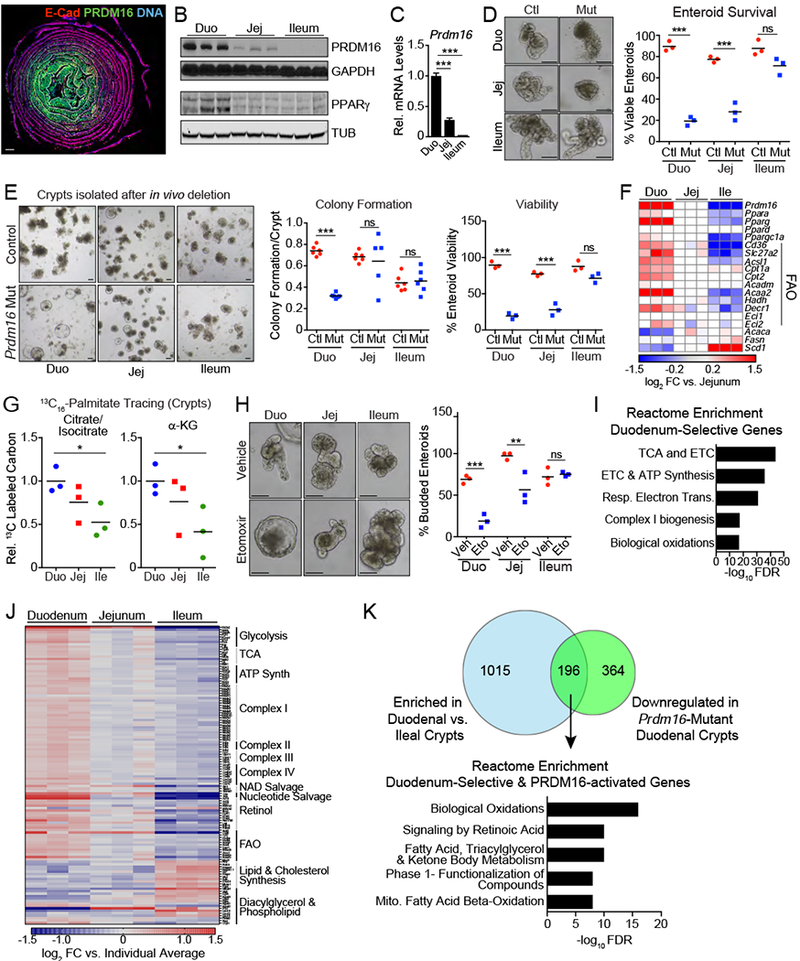
Metabolic pathways dynamically regulate tissue development and maintenance. However, the mechanisms that govern the metabolic adaptation of stem or progenitor cells to their local niche are poorly understood. Here, we define the transcription factor PRDM16 as a region-specific regulator of intestinal metabolism and epithelial renewal. PRDM16 is selectively expressed in the upper intestine, with enrichment in crypt-resident progenitor cells. Acute Prdm16 deletion in mice triggered progenitor apoptosis, leading to diminished epithelial differentiation and severe intestinal atrophy. Genomic and metabolic analyses showed that PRDM16 transcriptionally controls fatty acid oxidation (FAO) in crypts. Expression of this PRDM16-driven FAO program was highest in the upper small intestine and declined distally. Accordingly, deletion of Prdm16 or inhibition of FAO selectively impaired the development and maintenance of upper intestinal enteroids, and these effects were rescued by acetate treatment. Collectively, these data reveal that regionally specified metabolic programs regulate intestinal maintenance.

Keywords: PRDM16; apoptosis; differentiation; duodenum; fatty acid oxidation; intestinal stem cell; intestine; metabolism; transit amplifying cell.


Conflict of interest statement

Declaration of Interests: The authors declare no competing interests.

Figures

Figure 1:
Figure 1:. Prdm16 is required for small intestine maintenance.
A-D) Phenotypes of Control (Prdm16loxP/loxP) and Prdm16 mutant (R26RCreERT2; Prdm16loxP/loxP) animals after injection with tmx. A) Body mass following tmx injection. n=4 mice/group. B) Gross appearance of small intestines at 7d post tmx. C) Small intestine length at 7d post tmx. D) Hematoxylin/eosin histology of duodenum at 3d and 7d post tmx (left) with quantification of villus length at 3d, 5d, and 7d (right). n=4 mice/group. E) (left) Schematic of intestinal villus/crypt structure and cell identities. TA Zone=Transit Amplifying Zone. (center, right) Duodenal sections stained for PRDM16 (red) and Lgr5-GFP (green). full villus (center), crypt compartment (right). DNA: DAPI, blue. Sub-panels: [left, overlay] [right] PRDM16 alone (white). F) mRNA levels of Prdm16 and stem cell markers in FACS isolated Lgr5GFP-low or -high epithelial cells from duodenal crypts. n=3 mice. All panels show mean ± SEM, *p<0.05, **p<0.01, ***p<0.001. Scale Bars: 100 μm (D,E Left), 10 μm (E Right).
Figure 2:
Figure 2:. Prdm16 deletion induces crypt apoptosis and disrupts cell type composition.
A) (left) Immunofluorescence staining of Ki67+ (red) proliferative cells in crypts of Control (Prdm16loxP/loxP) and Prdm16 mutant (R26RCreERT2; Prdm16loxP/loxP) mice 5d after tmx injection. Lysozyme (LYZ; green), DNA (DAPI, blue). (right) Quantification of Ki67+ cells/crypt. n=13 to 14 crypts, 3 mice per group. B) (left) Immunofluorescence staining of Cleaved Caspase 3 (CC3; red) in duodenal crypts from Control (corn oil-treated) and Prdm16 mutant (Mut; tmx-treated) R26RCreERT2; Lgr5GFP/CreERT2; Prdm16loxP/loxP mice (at 5d). Lgr5-GFP (green), DNA (DAPI, blue). (right) Quantification of CC3+ stem (GFPhi) or TA (GFPlow/neg) cells. n=88-91 crypts from 3 mice. C) Quantification of Lgr5-GFP+ stem cells in mice from (B). n=35-41 crypts from 3 mice. D-G) Control (Prdm16loxP/loxP) and Prdm16 mutant (R26RCreERT2; Prdm16loxP/loxP) (Mut) mice were injected with tmx. D) Counts of epithelial cells/villus at 5d and 7d post tmx. n=20 villi from 3 mice. E) mRNA levels of stem cell markers in isolated crypts 5d post tmx. n=5-7 mice. F) Immunofluorescence in villi and crypts at 7d post tmx. Full villus (left), magnified crypt (right). Goblet cell marker (Mucin 2; MUC2, green), Paneth cell marker (Lysozyme; LYZ, red), DNA (DAPI, blue). arrowheads = MUC2/LYZ double-positive cells. G) mRNA levels of absorptive (left) and secretory cell (right) markers in isolated villi or crypts (for Mmp7) at 3d and 5d post tmx. n= 4-7 mice. All panels show mean ± SEM, *p<0.05, **p<0.01, ***p<0.001. Scale bars: 10 μm (A,B, F right); 100 μm (F left).
Figure 3:
Figure 3:. Loss of Prdm16 in stem cells leads to TA cell apoptosis and diminished epithelial differentiation
A-D) Lgr5GFP/Cre-ERT2;Prdm16loxP/loxP mice were treated with tmx (mutant; Prdm16ΔLgr5) or vehicle (corn oil; Control). A) Immunostaining of PRDM16 (red) and Lgr5-GFP (green) in duodenal crypts at 7d post tmx. DNA (DAPI, blue). B) Quantification of Lgr5GFP+ stem cells per crypt at 5d. n=35 crypts from 3 mice. C) (left) Duodenal crypts stained for cleaved Caspase 3 (CC3; red) at 5d. (right) Quantification of CC3+ stem (GFPhi) or TA (GFPlow/neg) cells using an intensity threshold (Thermal LUT in Image J). Controls were shared with experiment in Figure 2B. n=91-188 crypts from 3 mice per group. D) Immunostaining of Mucin2 (MUC2; red) and Lysozyme (LYZ; green) in duodenal crypts at 5d. Arrowheads indicate MUC2/LYZ double-positive cells. n=3 mice. E-F) Lineage tracing of Lgr5+ stem cell progeny in Control (Prdm16loxP/+) and Prdm16 mutant (Prdm16loxP/oxP; Prdm16ΔLgr5) reporter mice (Lgr5GFP/Cre-ERT2;R26Rlox-stop-lox-tdTomato). Marked epithelial strip length was measured for continuous streaks of tdTomato+ (Red) epithelial cells ascending the villi at: E) 3d [n=132-190 villi from 3 mice] or F) 14d [n=28-58 villi from 3 mice] post tmx. Lgr5-GFP (green), DNA (DAPI, blue). All panels show mean ± SEM, *p<0.05, **p<0.01, ***p<0.001. Scale bars: 10 μm (A, C, ; (D) 100 μm (E, F).
Figure 4:
Figure 4:. Prdm16 is required for the development and maintenance of duodenal enteroids.
(A) Images and quantification of budding (defined as one or more bud) in Control (Prdm16loxP/loxP) and Prdm16 mutant (R26RCre-ERT2;Prdm16loxP/loxP) duodenal enteroids grown in ENR, 3d following 4-OHT treatment. Arrowhead shows bud. n=410-554 enteroids. B) Growth or regression of buds following 4-OHT treatment of mature budded enteroids. % growth = change in bud length / initial bud length for n=7-8 enteroids. PRDM16 (green), E-Cadherin (red), DNA (DAPI, blue). C) Immunostaining of Lgr5-GFP+ (green) stem cells in control and Prdm16-mutant enteroids, 4d after inducing deletion. Enteroids were from Lgr5GPP/CreERT2; Prdm16loxP/loxP (control) or R26RCreERT2; Lgr5GFP/CreERT2; Prdm16loxP/loxP (Mut) mice and treated with vehicle (control) or 4-OHT (Mut). E-Cadherin (red), DNA (DAPI, blue). D) Cleaved Caspase 3 (CC3+) apoptotic cells (green) in control (Prdm16loxP/loxP) and Prdm16 mutant (R26RCre-ERT2;Prdm16loxP/loxP) duodenal enteroids 3d after treatment with 4-OHT. E-Cadherin (red), DNA (DAPI, blue). E) mRNA levels of cell type-specific marker genes in control and Prdm16 mutant enteroids at 2d and 3d post 4-OHT treatment. n=4. F-I) Control and Prdm16 mutant enteroids were established in Wnthigh medium (WENR), prior to treatment with 4-OHT to delete Prdm16. F) Schematic of experimental protocol. G) Enteroid growth in WENR. n=11-13 enteroids. % growth = mean change in diameter / initial diameter. H) Enteroid growth during transfer from WENR to ENR medium. n=16-23 enteroids. I) Secondary enteroids formed per well from passaged fragments of Control or Prdm16 mutant enteroids cultured in WENR or ENR medium. n=3-4 wells. J-K) Colony formation efficiency of GFPhi and GFPlow cells isolated by FACS from control (Lgr5GFP/Cre-ERT2; Prdm16loxP/+) or Prdm16 mutant (R26RCreERT2; Lgr5GFP/CreERT2; Prdm16loxP/loxP) mice 3d after in vivo tamoxifen injection, when co-cultured with control Paneth Cells (J; n=10 wells) or in high WNT conditions (K; n=4 wells). All panels show mean ± SEM, *p<0.05, **p<0.01, ***p<0.001. Scale bars: 100 μm (A, G, H, J); 20 μm (B); 50 μm (C,D).
Figure 5:
Figure 5:. PRDM16 binds and promotes the expression of fatty acid oxidation genes
A-B) RNA-seq analysis of isolated duodenal crypts from Prdm16loxP/loxP (control) or R26RCre-ERT2;Prdm16loxP/loxP (mutant) animals at 3d after tmx injection. A) Pathway analysis of down-regulated genes (FDR<0.05) in mutant crypts. B) Downregulated FAO genes meeting a threshold of FDR<0.1 are displayed in a heat map of log2 fold-change (FC) relative to mean expression in controls. n=3 mice per group. C) Schematic of key steps of FAO to acetyl-CoA generation with associated enzymes. D) mRNA levels of FAO genes in control and Prdm16 mutant crypts at 3d and 5d after tmx injection. n=4 (control/mutant d3), n=5 (mutant d5). E) Distance of PRDM16 ChIP-Seq peaks from the transcriptional start site (TSS) of downregulated (blue), unchanged (gray), or upregulated (red) genes in Prdm16-mutant crypts by RNA-seq at 3d post tmx. F) ChIP-seq tracks for PRDM16 and H3K27Ac at FAO genes Slc27a2 and Eci2 in control and mutant duodenal crypts. G) Transcription factor binding motifs enriched at PRDM16 ChIP-seq peaks. H) CHIP-qPCR analysis of PRDM16, PPARα and PPARγ (two antibodies) binding at PRDM16-ChIP-seq binding regions near FAO gene promoters in duodenal crypts. Negative control sites are ~3 kb from PRDM16 peaks. Distance from TSS is shown in kilobases (kb), fold-change shown relative to normal-IgG control ChIP. n=3 biological ChIP replicates. Panels (D,H) show mean ± SEM, *p<0.05, **p<0.01, ***p<0.001.
Figure 6:
Figure 6:. PRDM16 regulates intestinal growth and maintenance by promoting FAO.
A-B) Mass spectrometry analysis of 13C16-palmitate incorporation into TCA cycle metabolites. A) schematic. B) Relative 13C-labeling of the citrate/isocitrate and α-ketoglutarate pools in control (Prdm16loxP/loxP) vs. Prdm16 mutant (R26RCreERT2; Prdm16loxP/loxP) crypts isolated 3d after tmx injection. 13C-labeling = Σ (% of isotopomer multiplied by labeled carbons in isotopomer) divided by the number of carbons in molecule. n=4-5 mice per group. C) mRNA levels of indicated FAO genes in FACS-isolated Lgr5-GFPHi or Lgr5-GFPlow epithelial cells from the duodenum of Lgr5GPP/Cre-ERT2 mice. n=3 mice. D-G) Wildtype enteroids (in ENR medium) were treated with: (1) vehicle or etomoxir, and (2) sodium chloride (No Acetate) or Acetate (Ac). D) Brightfield images with magnified inset. E) Quantification of enteroid growth. n=32-41 enteroids. F) Quantification of enteroid budding (one or more buds). n=4 wells. G) Secondary enteroid formation from fragments of passaged enteroids. n=4 wells. Etomoxir (Eto), 50 μM in water; NaAc/NaCl, 5 mM in water. Enteroids were treated with NaAc / NaCl for 2d before addition of Eto treatment. H-N) Control or Prdm16 mutant enteroids (in ENR medium) were treated with 5mM sodium acetate (Ac) or 5mM sodium chloride (No Acetate). H) Brightfield images with magnified insets. I) Enteroid growth. n=16-21 enteroids. J) Immunostaining of Lysozyme-positive (green) Paneth cells in control and Prdm16-mutant enteroids, 4d after inducing deletion. Enteroids were from Prdm16loxP/loxP (control) or R26RCreERT2; Prdm16loxP/loxP (Mut) mice and treated with 4-OHT with additional treatment of acetate or no acetate treatment (NaCl, 5mM). E-Cadherin (red), DNA (DAPI, blue). Percentage of enteroid cells positive for Lysozyme staining are quantified in the graph. K) mRNA levels of cell type-specific marker genes in control and Prdm16 mutant enteroids at 4days post 4-OHT treatment with or without acetate treatment. n=4. L) Secondary enteroid formation from fragments of passaged enteroids. M) Enteroid budding (defined as one or more bud). n=4-6 wells. n=4 wells; NaAc/NaCl, 5 mM in water. Enteroids were pretreated with NaAc / NaCl for 2d after plating but before treatment with 4-OHT. N) Lineage tracing of stem cell progeny in Prdm16loxP/+ (control) or Prdm16loxP/loxP (mutant) tdTomato reporter mice. Animals received drinking water containing either 150 mM NaAc (Ac) or NaCl (No Acetate) 2d before tmx treatment. Length of marked villus epithelial cell strips was measured for continuous strips of Tomato+ (red) epithelial cells ascending the villi at 4d post tmx treatment. n=200-291 villi measured from >=4 mice per group. tdTomato (red), DNA (DAPI, blue). O) Quantification of Cleaved caspase-3 positive cells per tdTomato positive crypt relative to the number of cleaved caspase-3 positive cells in tdTomato negative crypts. N=303-423 crypts from 3 or more mice per group. All panels show mean ± SEM, *p<0.05, **p<0.01, ***p<0.001. Scale bars: 100 μm (D, H, J); 50 μm (N).
Figure 7:
Figure 7:. PRDM16-driven FAO selectively regulates the development and maintenance of upper intestinal enteroids
A) “Swiss roll” immunostaining of PRDM16 (green) in small intestine, with duodenum at the center and ileum at the periphery. E-cadherin (red), DNA (DAPI, blue). Panel is stitched composite of 10X images. B) Western blot analysis of PRDM16 and PPARγ expression in duodenal, jejunal, and ileal crypts. Loading controls are GAPDH and α-Tubulin (TUB). n=3 mice. C) mRNA levels of Prdm16 in duodenal, jejunal, and ileal crypts. n=3 mice. D) (left) Control (Prdm16loxP/loxP) and Prdm16 mutant (R26RCreERT2; Prdm16loxP/loxP) enteroids derived from duodenal, jejunal, and ileal crypts. Enteroids were analyzed 7d post 4-OHT treatment. (right) Quantification of viable enteroids. n=54-121 enteroids, n=3 wells. E) Enteroid formation from duodenal, ileal, and jejunal crypts of control (Prdm16loxP/loxP) and Prdm16 mutant (R26RCreERT2; Prdm16loxP/loxP) mice 3d after tmx injection. Colony formation and viability were assessed 2d and 7d after plating, respectively. F) Expression heat map of Prdm16, Ppar isoforms, FAO, and fatty acid synthesis genes, as measured by qRT-PCR. n=3 mice. G) Mass spectrometry analysis of relative 13C-labeling of the citrate/isocitrate and α-ketoglutarate pools in duodenal, jejunal, and ileal crypts after a 90-minute incubation in 13C16-palmitate (relative to duodenum). 13C-labeling = Σ (% of isotopomer multiplied by labeled carbons in isotopomer) divided by the number of carbons in molecule. n=3 mice. H) Quantification of budding (one or more buds) in duodenal, jejunal, and ileal enteroids following treatment with vehicle or etomoxir (Eto; 50 μM). n=79-239 from 4 wells. I-K) RNA-seq analysis of wildtype crypts from duodenum, jejunum, and ileum. n=3. I) Reactome enrichment analysis of genes with selective expression in duodenal vs. ileal crypts. J) Expression heat map of a curated set of metabolism genes showing relative regional expression. Scale is log2 fold change versus average expression across crypts for each individual replicate. K) Venn diagram of overlap between duodenal crypt-enriched genes and genes downregulated in Prdm16 mutant crypts (top). Intersecting gene set was used for Reactome enrichment analysis (bottom). All panels show mean ± SEM, *p<0.05, **p<0.01, ***p<0.001. Scale bars: 1 mm (A), 100 μm (D, E, H). Duo= duodenal, Jej=jejunal, Ile=ileal. Ctl= Control. Veh=vehicle.

Similar articles

Cited by

References

    1. Aguilo F, Avagyan S, Labar A, Sevilla A, Lee DF, Kumar P, Lemischka IR, Zhou BY, and Snoeck HW (2011). Prdm16 is a physiologic regulator of hematopoietic stem cells. Blood 117, 5057–5066. - PMC - PubMed
    1. Andersson-Rolf A, Fink J, Mustata RC, and Koo BK (2014). A video protocol of retroviral infection in primary intestinal organoid culture. J Vis Exp, e51765. - PMC - PubMed
    1. Baregamian N, Mourot JM, Ballard AR, Evers BM, and Chung DH (2009). PPAR-gamma agonist protects against intestinal injury during necrotizing enterocolitis. Biochem Biophys Res Commun 379, 423–427. - PMC - PubMed
    1. Barker N, van Es JH, Kuipers J, Kujala P, van den Born M, Cozijnsen M, Haegebarth A, Korving J, Begthel H, Peters PJ, et al. (2007). Identification of stem cells in small intestine and colon by marker gene Lgr5. Nature 449, 1003–1007. - PubMed
    1. Beyaz S, Mana MD, Roper J, Kedrin D, Saadatpour A, Hong SJ, Bauer-Rowe KE, Xifaras ME, Akkad A, Arias E, et al. (2016). High-fat diet enhances stemness and tumorigenicity of intestinal progenitors. Nature 531, 53–58. - PMC - PubMed

Publication types

MeSH terms