. 2019 Dec 5;76(5):838-851.e5.
doi: 10.1016/j.molcel.2019.08.028. Epub 2019 Sep 26.

Metabolic Diversity in Human Non-Small Cell Lung Cancer Cells

Affiliations

Metabolic Diversity in Human Non-Small Cell Lung Cancer Cells

Pei-Hsuan Chen et al. Mol Cell. .

Abstract

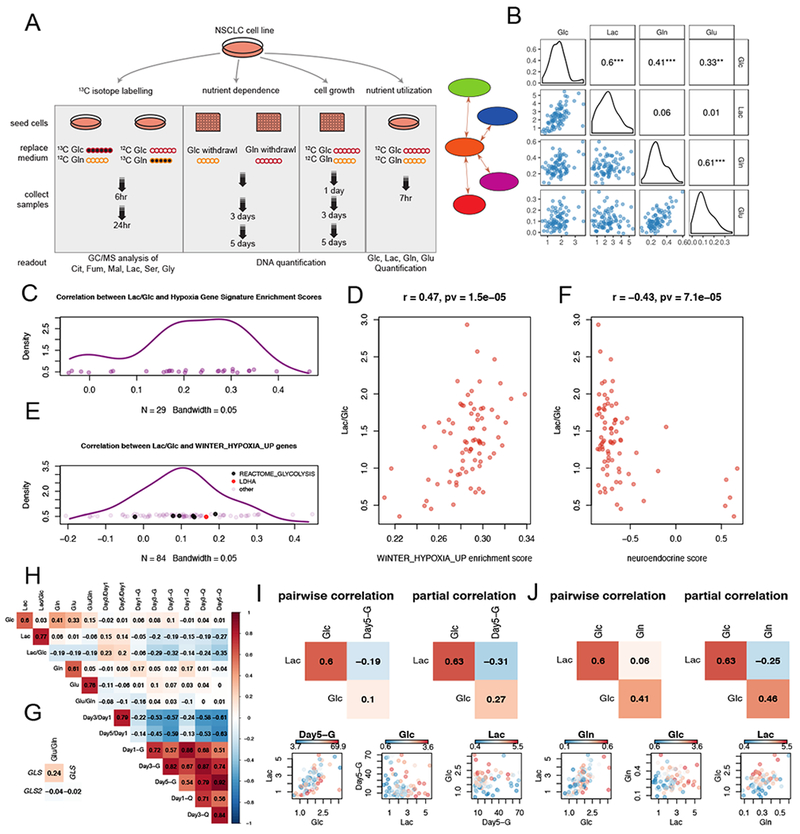
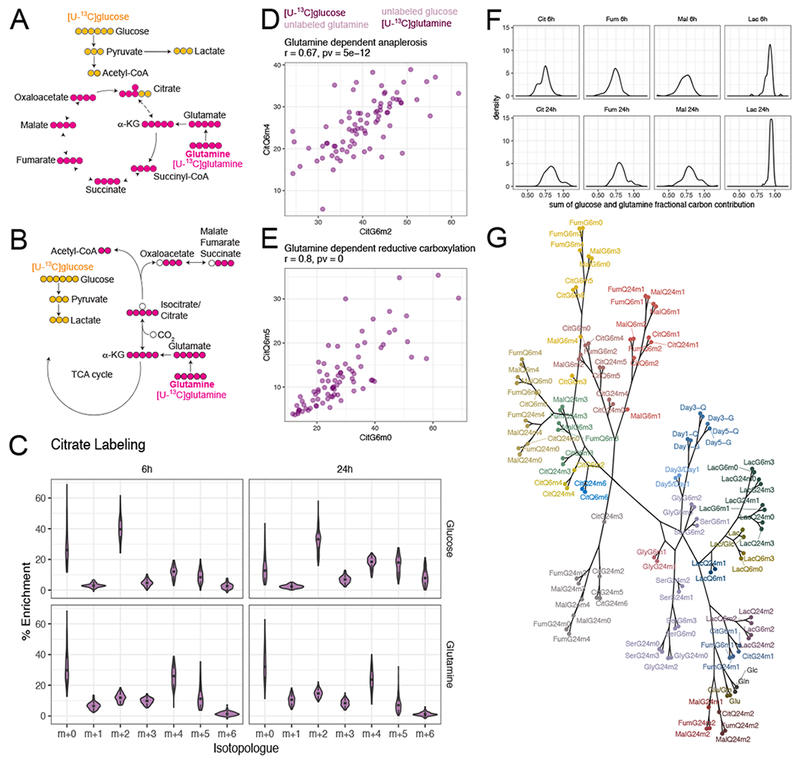
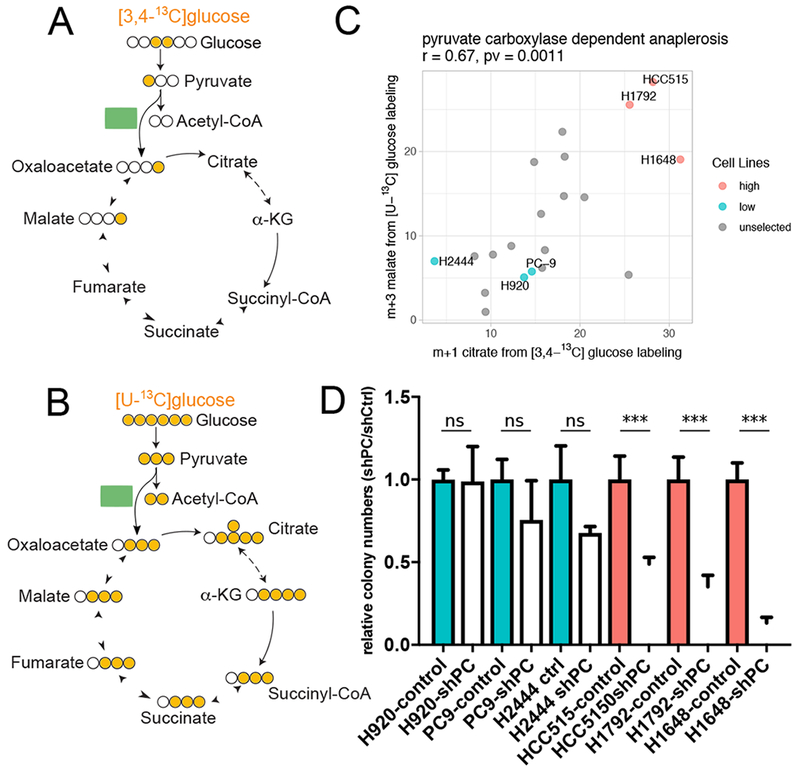
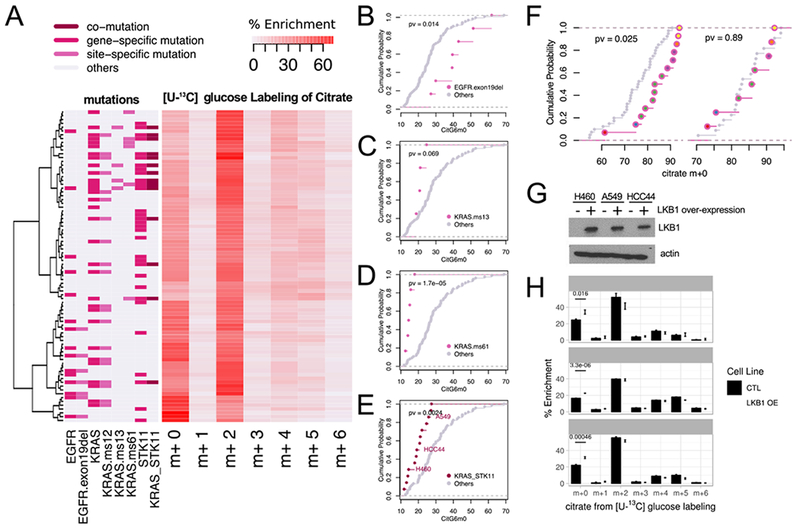
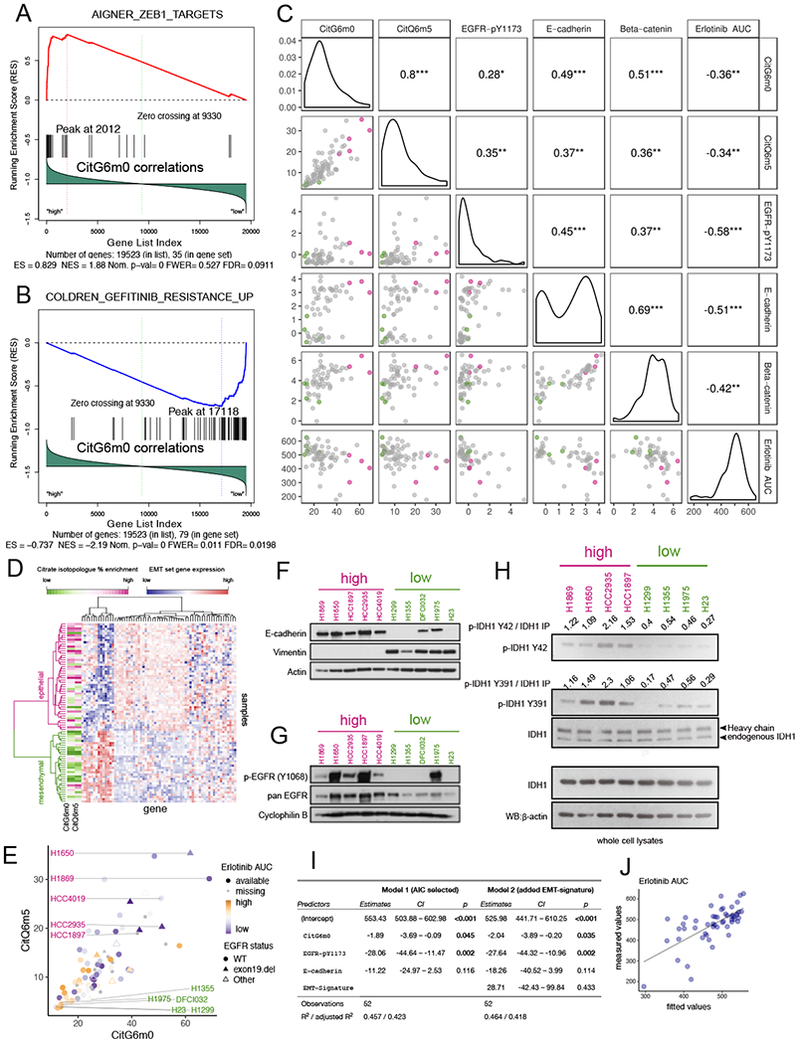
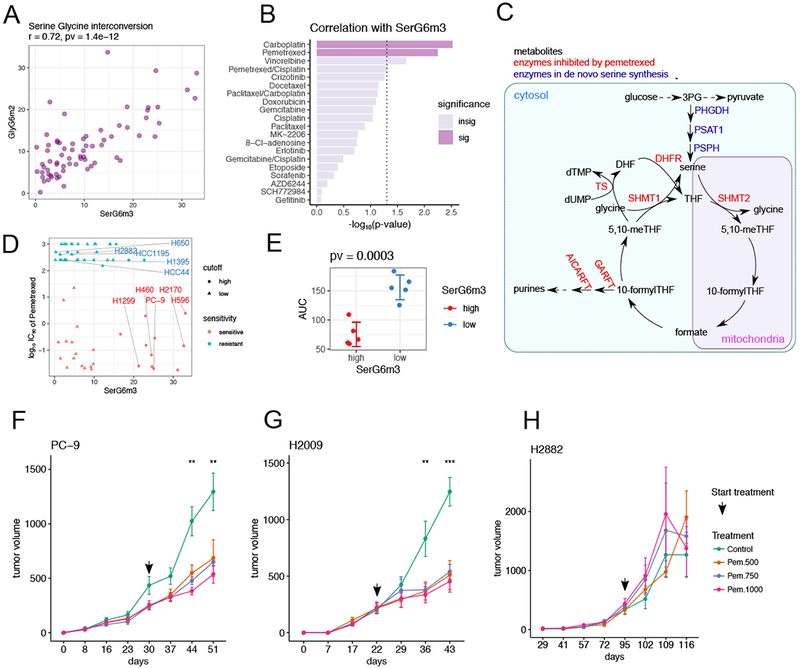
Intermediary metabolism in cancer cells is regulated by diverse cell-autonomous processes, including signal transduction and gene expression patterns, arising from specific oncogenotypes and cell lineages. Although it is well established that metabolic reprogramming is a hallmark of cancer, we lack a full view of the diversity of metabolic programs in cancer cells and an unbiased assessment of the associations between metabolic pathway preferences and other cell-autonomous processes. Here, we quantified metabolic features, mostly from the 13C enrichment of molecules from central carbon metabolism, in over 80 non-small cell lung cancer (NSCLC) cell lines cultured under identical conditions. Because these cell lines were extensively annotated for oncogenotype, gene expression, protein expression, and therapeutic sensitivity, the resulting database enables the user to uncover new relationships between metabolism and these orthogonal processes.

Keywords: (13)C stable isotope labeling; cancer metabolism; cell lines; gene expression; glucose; glutamine; non-small cell lung cancer; oncogenotypes; protein expression; therapeutic sensitivity.


Figures

Figure 1.
Figure 1.. Experimental design and diversity of nutrient utilization in NSCLC cell lines
(A). Schematic of design for metabolic profiling and association analyses. See also Table S1. (B). Scatter plots and density plots for nutrient utilization features, with Pearson correlation coefficients provided. ***, p<=0.001; **, p<=0.01; *, p<=0.05. (C). Kernel density estimation of correlation coefficient distribution from the pairwise correlations between Lac/Glc and ssGSEA scores from 29 hypoxia-related genesets. The hypoxia related genesets were selected from C2-CGP gene sets in MSigDB with the criterion that the geneset name contained “HYPOXIA” but not “DN” (short for “Down”). (D). Scatterplot showing the positive correlation between Lac/Glc and ssGSEA scores derived for “WINTER_HYPOXIA_UP” signature. (E). Distribution from the pairwise correlation coefficients between Lac/Glc and 84 genes from the “WINTER_HYPOXIA_UP” gene set. Glycolytic genes (ALDOA, PGK1, TPI1, PGAM1, GAPDH and PFKFB4) from the “REACTOME_GLYCOLYSIS” geneset and LDHA are indicated by black and red spots. (F). Scatterplot showing the negative correlation between Lac/Glc and neuroendocrine scores. (G). Pearson correlation between glutaminolytic rate (Glu/Gln) and expression of GLS and GLS2. (H). Correlation heatmap revealing pairwise Pearson correlations amongst metabolic features from nutrient utilization, cell growth and nutrient dependence. (I and J). Comparisons of partial correlations and pairwise correlations for Lac, Glc and Day5-G (I) or Lac, Glc and Gln (J). Abbreviations: Lac, lactate; Glc, glucose; Gln, glutamine; Glu, glutamate.
Figure 2.
Figure 2.. Differential pathway utilization inferred by mass isotopologue distributions
(A and B). Schematics of representative isotopologues generated from [U-13C]glucose or [U-13C]glutamine labeling through glutamine-dependent anaplerosis (A) or glutamine-dependent reductive carboxylation (B). (C). Violin plots showing distribution of citrate isotopologues from different tracers and different labeling durations. See also Figure S2. (D and E). Scatterplots showing that enrichment of signature isotopologues produced from two different tracers for the same metabolic pathway (glutamine-dependent anaplerosis in D and glutamine-dependent reductive carboxylation in E) are highly correlated with each other. Figure title provides Pearson correlation coefficient and p-value. (F). Distribution of the sum of glutamine and glucose fractional carbon contribution into different metabolites. (G). Dendrogram of all metabolic features from hierarchical clustering with absolute Pearson correlation-based distance using Ward’s minimum variance method. The branches were arbitrarily colored. Abbreviations: Cit, citrate; Fum, fumarate; Mal, malate; Lac, lactate; Ser, serine; Gly, glycine.
Figure 3.
Figure 3.. Inferring pyruvate carboxylase contribution from enrichment of malate isotopologues
(A and B). Signature isotopologues produced from pyruvate carboxylation with [3,4-13C]glucose (A) or [U-13C]glucose (B) labeling. (C). Scatter plot showing correlation between m+1 citrate from [3,4-13C]glucose and m+3 malate from [U-13C]glucose. Cell lines selected for PC dependence testing in (D) are indicated with labels. Correlation coefficient and p-value from Pearson correlation are provided in title. (D). Effect of PC silencing on colony formation in cells lines predicted to have high (red) or low (blue) PC-dependent anaplerosis. Data are mean ± SEM. Statistical significance based on t-test, ***p < 0.005. See also Figure S4.
Figure 4.
Figure 4.. Associations between oncogenotypes and citrate mass isotopologues
(A). Heatmap with hierarchical clustering of cell lines and citrate mass isotopologues from [U-13C]glucose labeling for 6h. Clustering was based on Ward’s minimum variance method. Relevant oncogenotypes are indicated. (B-E). Cumulative distribution function plots showing different levels of CitG6m0 in cell lines with EGFR exon 19 deletion (B); KRAS missense mutation of the 13th codon (C); KRAS missense mutation of the 61st codon (D); and concurrent KRAS/STK11 mutation (E) compared to the rest of the cell lines (p-values based on K-S test). See also Table S3. (F). Left, cumulative distribution function plots comparing citrate m+0 fractions between tumor fragments with or without EGFR mutations. Right, cumulative distribution function plots of the adjacent lung samples from the same patients. We compared 14 tumor fragments from 6 patients with EGFR mutations to 40 tumor fragments from 22 EGFR WT patients, whereas for the adjacent lung, we compared 8 fragments from 6 patients with EGFR mutations to 22 fragments from 22 EGFR WT patients. Patient origins of the EGFR mutant fragments are indicated by different colors inside the circles. (p-values based on K-S test) (G). Western blot for LKB1 (encoded by STK11) in three cell lines with co-mutant KRAS and STK11. OE, over-expression. (H). Re-expression of LKB1 in cell lines with co-mutant KRAS and STK11 increases CitG6m0 after labeling with [U-13C]glucose. Data are mean ± SEM.
Figure 5.
Figure 5.. Reductive carboxylation is associated with an epithelial state and is enriched in cell lines sensitive to EGFR inhibitors
(A-B). Gene Set Enrichment Analysis (GSEA) identified CitG6m0 as positively correlated with ZEB1 target genes (A) and negatively correlated with Gefitinib resistance genes (B). (C). Scatterplot and pairwise Pearson correlation among GDRC metabolic features CitG6m0, CitQ6m5; RPPA features beta-catenin, E-cadherin and EGFR-pY1173; and compound sensitivity feature Erlotinib AUC (higher area under the dosing curve represents higher resistance). The color scheme for points in the scatterplot is explained in the legend for (E). ***, p<=0.001; **, p<=0.01; *, p<=0.05. (D). Heatmap with hierarchical clustering of samples and EMT signature genes. Clustering was based on Ward’s minimum variance method. The CitG6m0 and CitQ6m5 fractions are indicated by the color scale. Higher levels of GDRC metabolic features were observed for the epithelial cluster. (E). Scatter plot of CitG6m0 and CitQ6m5 with EGFR mutation status marked by different symbols and EGFR inhibitor sensitivity indicated by different color and shapes. Five GDRC-high cell lines (magenta lettering) and five GDRC-low cell lines (green lettering) were selected for further characterization. These cell lines are also indicated by coloring in (C). (F-G). Validation of EMT status and EGFR activation by western blot in 10 selected cell lines. In (F), the epithelial marker E-cadherin is expressed in GDRC-high cell lines, whereas the mesenchymal marker vimentin is expressed GDRC-low cell lines. In (G), p-EGFR (Y1068) indicative of EGFR activation is more prominent in GDRC-high cell lines. (H). Higher phosphorylation of IDH1 on Y42 and Y391 in cell lines with high GDRC. (I). Coefficients and p-values from multiple regression models predicting inhibitor sensitivity from different feature sets. Model 1 was obtained from stepwise feature selection based on Akaike information criterion (AIC) with input features including CitG6m0, CitQ6m5, EGFR-pY1173, E-cadherin, beta-catenin and EMT class. Model 2 adds the EMT-signature (EMT class) into Model 1. Note that p-values for CitG6m0 are significant in both models while controlling for the RPPA features or gene expression-derived EMT feature. (J). Scatterplot of fitted values from model 1 in (I) and the measured value (Erlotinib AUC). See also Figure S5 and Table S4.
Figure 6.
Figure 6.. De novo serine synthesis from glucose is associated with sensitivity to pemetrexed.
(A). Scatterplot showing positive correlation between SerG6m3 and GlyG6m2. Correlation coefficient and p-value from Pearson correlation are provided in the title. (B). Drug sensitivity correlations with SerG6m3. −log10 (p-values) from Pearson correlations are plotted and the hits ranked by decreasing statistical significance. The dashed line demarcates the nominal p-value cut-off of 0.05 after −log10 transformation, and the darkly-colored bars denote statistical significance after multiple comparison controlled by beta uniform mixture modeling of p-values. See also Table S4. (C). Schematic of serine biosynthesis feeding into one-carbon metabolism. Metabolites are in black, serine de novo synthesis enzymes are in blue and enzymes reportedly targeted by pemetrexed are in red. (D). Relationship between SerG6m3 and pemetrexed IC50, and selection of cell lines for further characterization. Note that almost all the cell lines with high SerG6m3 are sensitive to pemetrexed. Cell lines are colored based on pemetrexed sensitivity. 5 pemetrexed sensitive cell lines with high SerG6m3 and 5 pemetrexed resistant cell lines with low SerG6m3 were selected for further characterization. (E). Validation of pemetrexed sensitivity between selected cell lines with high and low SerG6m3 fractions. P-value from t-test is displayed in the title. Each dot represents average from triplicates for a single cell line; error bars denote mean ± SD for each group. See also Figure S6. (F-H). In vivo testing of pemetrexed sensitivity in xenograft mouse models. PC-9 (F) and H2009 (G), cell lines sensitive to pemetrexed in culture, are also sensitive to pemetrexed in vivo, whereas the pemetrexed-resistant cell line H2882 (H) retains this resistance in vivo. The arrow indicates the time when pemetrexed therapy was initiated. Data are mean ± SEM. Statistical significance at each time point was determined by one-way ANOVA. ***, p<=0.001; **, p<=0.01. 4-5 mice were used for each treatment condition.

Similar articles

Cited by

References

    1. Aigner K, Dampier B, Descovich L, Mikula M, Sultan A, Schreiber M, Mikulits W, Brabletz T, Strand D, Obrist P et al. (2007). The transcription factor ZEB1 (deltaEF1) promotes tumour cell dedifferentiation by repressing master regulators of epithelial polarity. Oncogene 26, 6979–6988. - PMC - PubMed
    1. Barbie DA, Tamayo P, Boehm JS, Kim SY, Moody SE, Dunn IF, Schinzel AC, Sandy P, Meylan E, Scholl C et al. (2009). Systematic RNA interference reveals that oncogenic KRAS-driven cancers require TBK1. Nature 462, 108–112. - PMC - PubMed
    1. Boroughs LK, and DeBerardinis RJ (2015). Metabolic pathways promoting cancer cell survival and growth. Nat Cell Biol 17, 351–359. - PMC - PubMed
    1. Buescher JM, Antoniewicz MR, Boros LG, Burgess SC, Brunengraber H, Clish CB, DeBerardinis RJ, Feron O, Frezza C, Ghesquiere B et al. (2015). A roadmap for interpreting (13)C metabolite labeling patterns from cells. Curr Opin Biotechnol 34, 189–201. - PMC - PubMed
    1. Byers LA, Diao L, Wang J, Saintigny P, Girard L, Peyton M, Shen L, Fan Y, Giri U, Tumula PK, et al. (2013). An epithelial-mesenchymal transition gene signature predicts resistance to EGFR and PI3K inhibitors and identifies Axl as a therapeutic target for overcoming EGFR inhibitor resistance. Clin Cancer Res 19, 279–290. - PMC - PubMed

Publication types

MeSH terms

LinkOut - more resources