. 2019 Nov 20;104(4):810-824.e9.
doi: 10.1016/j.neuron.2019.08.025. Epub 2019 Sep 26.

Task-Dependent Changes in the Large-Scale Dynamics and Necessity of Cortical Regions

Affiliations

Task-Dependent Changes in the Large-Scale Dynamics and Necessity of Cortical Regions

Lucas Pinto et al. Neuron. .

Abstract

Neural activity throughout the cortex is correlated with perceptual decisions, but inactivation studies suggest that only a small number of areas are necessary for these behaviors. Here we show that the number of required cortical areas and their dynamics vary across related tasks with different cognitive computations. In a visually guided virtual T-maze task, bilateral inactivation of only a few dorsal cortical regions impaired performance. In contrast, in tasks requiring evidence accumulation and/or post-stimulus memory, performance was impaired by inactivation of widespread cortical areas with diverse patterns of behavioral deficits across areas and tasks. Wide-field imaging revealed widespread ramps of Ca2+ activity during the accumulation and visually guided tasks. Additionally, during accumulation, different regions had more diverse activity profiles, leading to reduced inter-area correlations. Using a modular recurrent neural network model trained to perform analogous tasks, we argue that differences in computational strategies alone could explain these findings.

Keywords: RNN; cortex; decision making; evidence accumulation; mouse behavior; optogenetics; virtual reality; widefield Ca(2+) imaging; working memory.


Conflict of interest statement

DECLARATION OF INTERESTS

The authors declare no competing financial interests.

Figures
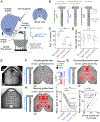
Figure 1.
Figure 1.. Widespread cortical involvement in evidence- and memory-based navigation.
(A) Schematic of the VR setup integrated with scanning laser for optogenetic inactivation. (B) Schematic of the three tasks. Right: Accumulating-towers task. The animal navigates a 3-m virtual T-maze to retrieve a reward in the arm corresponding to the side with the majority of towers, which appear transiently on either side anywhere in the first 2 m. Left: visually-guided task. Maze and tower stimuli are the same, but additionally a tall visual guide visible from the beginning of the maze indicates reward location. Middle: memory-guided task. Maze is the same but there are no tower stimuli, just a distal visual guide that disappears during the final 1 m. (C) Overall performance of the three tasks (n = 36, 31 and 8 mice with at least 100 trials for accumulating-towers, visually-guided and memory-guided tasks, respectively). Circles indicate statistical significance (two: p < 0.01, three: p < 0.001, Tukey's post-hoc test). (D) Average standard deviation of view angle trajectories across spatial positions for the three tasks, illustrating similar motor behavior. (E) Top: VGAT-ChR2-EYFP mouse with the cleared skull preparation. Bottom: schematic showing the targeting of 29 bilateral cortical patches spanning many areas (crosses), overlaid on a reference from the Allen Brain Atlas. Circles illustrate bilateral targeting of a pair of homotopic areas. (F) Effects of whole-trial inactivation of 29 bilateral cortical patches on performance of the visually-guided task (n = 5 mice, 8140 'laser on’ trials, mean: 271.3 trials/location). The size of each circle indicates the size of the effect (caption on the right), given by the normalized performance drop between 'laser on' and 'laser off' trials (STAR methods). The color indicates the sign of the effect (red: decreased performance), and the saturation is proportional to the p-value (color bar), thresholded such that non-significant effects appear white. (G) Same as F, for the accumulating-towers task (n = 11 mice, 9443 'laser on' trials, mean: 314.8 trials/location). (H) Same as F and G, for the memory-guided task (n = 10 mice, 3750 'laser on' trials, mean: 129.3 trials/location). (I) The magnitude of behavioral deficit is related to baseline task difficulty. Left: comparison of normalized performance during inactivation across tasks. Lines: each of the 29 bilateral locations. Two circles: p < 0.01, three circles: p < 0.001, one-sided paired t test (the effect was larger for 19/29 regions in the accumulation vs. the memory-guided task). Colored circles and error bars: mean ± SEM across locations. Right: significant relationship between overall performance (data in panel C) and normalized laser on performance (left). Crosses: average ‘laser on’ performance for each of the 29 bilateral locations. Solid line: best linear fit (slope is significantly different from zero, 95% confidence interval), dashed lines: 95% confidence interval. Colored circles and error bars: mean ± SEM. See also Figures S1 - S3, Movie S1.
Figure 2.
Figure 2.. Location- and task-specific spatial patterns of behavioral deficits.
(A) Bilateral whole-trial inactivation of frontal regions during the accumulating-towers task led to large idiosyncratic side biases. Left: magnitude of side biases for individual mice (n = 11, black lines). Shown are biases in 'laser off' and 'laser on' trials for a sample posterior and a sample frontal region. Right: effect of inactivating each region on absolute side bias. The size of each circle indicates the size of the effect (caption on the right), the color indicates the sign of the effect (red: decreased, blue: increase), and the saturation is proportional to the p-value (color bar, see Methods), thresholded such that non-significant effects appear white. (B) Different effects of inactivating bilateral regions on running speed during the accumulating-towers task. Conventions as in A. (C) – (D). Same as A – B, for the memory-guided task. Note different spatial pattern. (E) Dendrogram showing that cortical regions cluster into three groups according to the pattern of behavioral deficits in the accumulating-towers task. (F) Each of the 29 bilateral cortical regions is color-coded according to the cluster they belong to (colors in E). (G) Significantly different effect sizes for five behavioral indicators across the three clusters (color code as in E and F). p-values on top are from a one-way ANOVAs performed separately for each indicator. Error bars, ± SEM. (H) – (J). Same as E – G, for the memory-guided task. See also Figure S3.
Figure 3.
Figure 3.. Task-dependent cortical dynamics
(A) Schematics of the VR setup integrated with a widefield macroscope. (B) Example ΔF/F traces extracted for five ROIs (labels on the left), with behavioral events for ten consecutive trials of the accumulating-towers task (captions on the right). (C) Pixel-wise Ca2+ activity maps during the visually-guided task, averaged over correct left-choice trials and maze regions as labeled on top. Black pixels correspond to vasculature/headplate mask and were not included in the analyses. (D) Same as C, for accumulating-towers task trials during the same behavioral session. E) Spatially downsampled activity for all contralateral ROIs (i.e. right hemisphere) during the visually-guided task, averaged over mice. Inset is a zoom-in of the same data, focused on the first half of the maze. Error bars are omitted for clarity. (F) Same as E, for the accumulating-towers task. p-values on the right are for the task factor in a 2-way repeated measures ANOVA (factors task and position). In panels C – F, ΔF/F was normalized separately for each task and ROI to emphasize relative activity timing. See also Figures S4 - S6, Movie S2.
Figure 4.
Figure 4.. Correlations between ROIs are high but modulated by behavioral context.
(A) Average pairwise correlation matrices between all 16 ROIs for different conditions labeled on top. B) Average correlation between each ROI and all the other 15, as a function of behavioral context. Circles: p < 0.001. (C) Left: difference in correlation matrices between accumulating-towers and visually-guided tasks, with ROIs sorted according to their cluster membership (right). Right: dendrogram showing hierarchical clustering of ROIs into 4 groups. (D) For each ROI, we compared the average task-related change (Δ r) in correlation with ROIs within the same cluster or outside of it. Color code as in B. One circle: p < 0.05, three circles: p < 0.001. (E) Relationship between session performance (n = 25 from 6 mice) and average correlation between the ROIs in the frontal cortex vs. parietal cortices (clusters 4 and 2 in panel C). (F) Average correlation between each ROI and all the other 15, as a function of maze region in the accumulating-towers task. Circles: p < 0.001. N.s.: not significant. (G) Difference in correlation matrices between hard and easy trials in the accumulating-towers task. (H) Average trial difficulty-related change in correlation with ROIs within the same cluster or outside of it (accumulating-towers task). Color code as in F. Two circles: p < 0.01, three circles: p < 0.001. See also Figure S7.
Figure 5.
Figure 5.. Large-scale Ca2+ activity is sensitive to sensory evidence only during the accumulating-towers task.
(A) Left: ROI examples (labels on top) of average z-scored ΔF/F as a function of the final amount of sensory evidence (binned, color bar on top), during the accumulating-towers task. Lines: mouse averages (n = 6). Error bars are omitted for clarity. Right: linear fits to quantify the amount of evidence tuning, corresponding to the examples on the left. Data points: mouse averages, error bars: ± SEM. Lines are average best fits from 50 bootstrapping iterations. Sig.: slope is significantly different from 0. N.s.: slope is not significantly different from 0. (B) Average slopes of linear fits for each ROI, during correct (left) and error (right) trials for the accumulating-towers task. Error bars: SD from bootstrapping (n = 50 iterations). Filled bars indicate slopes that are significantly different from 0. Circles indicate significant differences between contra- and ipsilateral slopes for each ROI. (C) Same as B, for correct trials in the visually-guided task. Note no significant tuning to sensory evidence.
Figure 6.
Figure 6.. Distributed coding of task variables during the accumulating-towers task.
(A) Evidence decoding weights plotted in pixel space (−280 x 280 μm) at different maze positions, from an example session. Outlines show anatomical ROIs (labels on the left), crosses indicate bregma location. (B) Average Pearson correlation of evidence and choice decoding weights as a function of the distance between pixels. Dashed lines: ± SEM across mice (n = 6). Shuffles were obtained by randomizing the pixel coordinates 50 times. (C) Cross-validated performance of linear decoders of cumulative evidence (Δ towers) across maze y positions, using activity averaged within anatomically-defined ROIs or smaller pixels. Dashed lines: ± SEM (n = 6 mice). (D) Accuracy of decoders employing pixels from only pairs of homotopic ROIs, across maze y positions. Error bars are omitted for clarity. (E) Maximal accuracy for decoders using pixels from the whole cortex (black, 1120 x 1120 μm) or only from homotopic ROI pairs. Error bars: ± SEM. (F) – (H) Same as C – E, for upcoming choice. See also Figures S8 - S9.
Figure 7.
Figure 7.. A modular RNN model recapitulates key features of the data.
(A) Schematics of the modular multi-task RNN. (B) Single-trial examples of activity from the same 6 units from both modules while the RNN is performing either task. (C) Pairwise rate correlation matrices for both tasks. (D) Histogram of changes in rate correlations (accumulating towers – visually-guided task) within and across modules. (E) Effects of silencing different fractions of randomly-selected units from the RNN on task performance. Error bars, ± SEM across inactivation runs (n = 50). Lines: best-fitting exponential functions to average data. See also Figure S10.

References

    1. Akrami A, Kopec CD, Diamond ME, and Brody CD (2018). Posterior parietal cortex represents sensory history and mediates its effects on behaviour. Nature 554, 368–372. - PubMed
    1. Allen WE, Kauvar IV, Chen MZ, Richman EB, Yang SJ, Chan K, Gradinaru V, Deverman BE, Luo L, and Deisseroth K (2017). Global representations of goal-directed behavior in distinct cell types of mouse neocortex. Neuron 94, 891–907.e6. - PMC - PubMed
    1. Aronov D, and Tank DW (2014). Engagement of neural circuits underlying 2D spatial navigation in a rodent virtual reality system. Neuron 84, 442–456. - PMC - PubMed
    1. Benjamini Y, and Hochberg Y (1995). Controlling the false discovery rate: a practical and powerful approach to multiple testing. J. R. Stat. Soc. Series B Stat. Methodol 57, 289–300.
    1. Brody CD, and Hanks TD (2016). Neural underpinnings of the evidence accumulator. Curr. Opin. Neurobiol 37, 1–9. - PMC - PubMed

Publication types