. 2019 Oct 14;36(4):385-401.e8.
doi: 10.1016/j.ccell.2019.08.008. Epub 2019 Sep 26.

An Evolutionarily Conserved Function of Polycomb Silences the MHC Class I Antigen Presentation Pathway and Enables Immune Evasion in Cancer

Affiliations

An Evolutionarily Conserved Function of Polycomb Silences the MHC Class I Antigen Presentation Pathway and Enables Immune Evasion in Cancer

Marian L Burr et al. Cancer Cell. .

Abstract

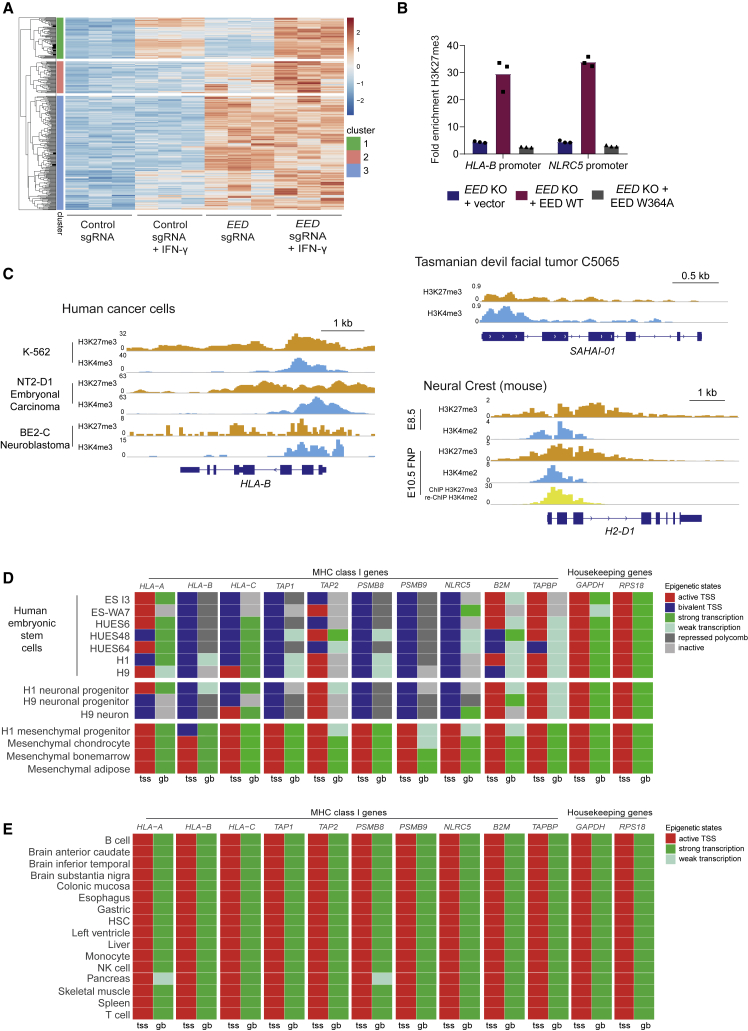
Loss of MHC class I (MHC-I) antigen presentation in cancer cells can elicit immunotherapy resistance. A genome-wide CRISPR/Cas9 screen identified an evolutionarily conserved function of polycomb repressive complex 2 (PRC2) that mediates coordinated transcriptional silencing of the MHC-I antigen processing pathway (MHC-I APP), promoting evasion of T cell-mediated immunity. MHC-I APP gene promoters in MHC-I low cancers harbor bivalent activating H3K4me3 and repressive H3K27me3 histone modifications, silencing basal MHC-I expression and restricting cytokine-induced upregulation. Bivalent chromatin at MHC-I APP genes is a normal developmental process active in embryonic stem cells and maintained during neural progenitor differentiation. This physiological MHC-I silencing highlights a conserved mechanism by which cancers arising from these primitive tissues exploit PRC2 activity to enable immune evasion.

Keywords: EZH2; MHC class I; antigen presentation; bivalency; cancer; epigenetic repression; histone methyltransferase; immune evasion; immunotherapy; polycomb.


Conflict of interest statement

M.T.M. and R.K.P. are employees of GlaxoSmithKline. M.A.D. has been a member of advisory boards for CTX CRC, Storm Therapeutics, Celgene, and Cambridge Epigenetix.

Figures

None
Graphical abstract
Figure 1
Figure 1
A Whole Genome CRISPR Screen Identifies a Critical Role for PRC2 in Silencing MHC-I Expression in Cancer Cells (A) CRISPR screen. K-562 cells were mutagenized by infection with a pooled lentiviral library comprising 220,000 sgRNA and MHC-I high cells were enriched by three successive sorts using fluorescence-activated cell sorting. (B) Cell surface MHC-I in K-562 cells following incubation ± IFN-γ 10 ng/mL for 24 h. (C) Bubble plots show the top 1,000 enriched genes identified in the CRISPR screen. PRC2 genes indicated in red. p values calculated using the RSA algorithm (Konig et al., 2007). (D and E) EED KO K-562 cells were transduced with a lentiviral vector encoding either EED cDNA or GFP (vector, V) and analyzed by flow cytometry (D) and immunoblot (E). (F) mRNA expression (reads per kilobase of transcript per million mapped reads) of MHC-I genes in 920 cancer cell lines in the Cancer Cell Line Encyclopedia. Each dot represents an individual cancer cell line, clustered by tumor type (log2 scale, black line indicates median). See also Figure S1 and Table S1.
Figure 2
Figure 2
PRC2 Maintains Coordinated Silencing of Antigen Processing Genes in MHC-I-Deficient Cancers (A and B) K-562 cells incubated with 3 μM EPZ-011989 (EZH2i) for the indicated times were analyzed by immunoblot (A) and qRT-PCR (B). (C) Cell surface MHC-I in EZH2i-treated cells (GSK-503 5 μM in NCI-H146 and EPZ-011989 3 μM in Kelly, MCC-002, and K-562) after 10 days of treatment. (D) Immunoblot in EED KO K-562 cells transduced with lentiviral vectors encoding WT EED, EED W364A mutant, or GFP control (V). (E and F) Flow cytometry (E) and immunoblot and qRT-PCR (F) in K-562 cells transduced with lentiviral vectors encoding H3.3 WT or K27M. (G) Immunoblot in EZH2 KO K-562 cells transduced with lentiviral vectors encoding WT EZH2, EZH2 F667I, or GFP control (V). (H) Cell surface MHC-I in EZH2 KO K-562 cells transduced with either control sgRNA or two EZH1-specific sgRNAs. (I) qRT-PCR analysis in K-562 cells incubated with 3 μM EPZ-011989 for the indicated times (days). Bars indicate the mean of technical triplicates from a representative experiment. (J) qRT-PCR in K-562 Cas9 cells expressing control or STAT1 sgRNA, 7 days following transduction with sgRNA targeting EED. For (F), (H), and (J), points indicate mean fold change in expression from individual experiments and bars show mean fold change across experiments. See also Figure S2.
Figure 3
Figure 3
PRC2 Restricts the Interferon-Induced Activation of MHC-I APP Genes in Multiple MHC-I Low Tumor Types (A) Cell surface MHC-I in K-562 cells expressing H3.3 WT or H3.3 K27M treated with IFN-γ 10 ng/mL for 24 h. (B) Immunoblot in neuroblastoma (Kelly) cells treated with EPZ-011989 3 μM for 10 days ± IFN-γ 10 ng/mL for 24 h. (C and D) Cell surface MHC-I following incubation with IFN-γ 10 ng/mL for 24 h in indicated cell lines pretreated with EPZ-011989 3 μM (C) and K-562 cells pretreated with EED-226 (D). Analysis after 10 days of inhibitor treatment. (E) Cell surface MHC-I in EED KO or parental control K-562 cells incubated with the indicated concentrations of IFN-γ for 24 h. (F) Cell surface MHC-I in K-562 Cas9 cells expressing control sgRNA or two MTF2-specific sgRNAs incubated ± IFN-γ 10 ng/mL for 24 h. See also Figure S3.
Figure 4
Figure 4
PRC2-Mediated Silencing of MHC-I Antigen Presentation in a Mouse Model of SCLC Drives Resistance to T Cell Killing (A) Cell surface MHC-I in mSCLC cell lines following incubation ± IFN-γ 10 ng/mL for 24 h. (B) qRT-PCR for MHC-I genes in mSCLC RP-116 cells treated with 3 μM EPZ-011989 or ethanol control for 10 days. Bars depict mean fold change in expression from independent experiments and points indicate the mean of technical triplicates from individual experiments. (C) qRT-PCR in Ezh2 KO mSCLC RP-116 transduced with a lentiviral vector encoding WT EZH2, EZH2 F667I, or GFP vector control. Bars show mean fold change in expression from a representative experiment. (D) Cell surface MHC-I in RP-116 cells treated with IFN-γ for 24 h following pretreatment ± EED-226 3 μM for 10 days. (E) Peptide pulsing assay. mSCLC RP-116 cells were pretreated as indicated with 3 μM EPZ-011989 or ethanol control for 10 days ± IFN-γ 10 ng/mL for 24 h before pulsing with OVA peptide. (F) Percent remaining live target tumor cells following 24 h incubation with OT-I T cells at the indicated effector:target (E:T) ratios. (G) Cytometric bead array (CBA) assay for T cell effector cytokines following 24 h co-culture with mSCLC cells pretreated as indicated. (F and G) Mean and SEM from a representative experiment performed in triplicate. Each experiment was performed independently three times with consistent results. See also Figures S4 and S5.
Figure 5
Figure 5
Pharmacological Inhibition of EZH2 Overcomes Resistance to T Cell Killing in SCLC (A) Schematic showing mSCLC-OVA co-culture assay. Stable expression of full-length OVA in mSCLC cells allows functional evaluation of the intracellular MHC-I antigen-processing pathway. Processed OVA peptide bound to H2-Kb is presented at the tumor cell surface and recognized by co-cultured antigen-specific OT-I T cells. (B) Cell surface SIINFEKL:Kb (MHC-I bound OVA peptide) in OVA-expressing mSCLC RP-116 cells pretreated as indicated with 3 μM EPZ-011989 for 10 days ± IFN-γ 10 ng/mL for 24 h. (C) CBA assay for T cell effector cytokines following 24 h co-culture with mSCLC-OVA cells pretreated as indicated. (D) Percent remaining live mSCLC-OVA cells following incubation with OT-I T cells at the indicated effector:target (E:T) ratios. (E) Cell surface MHC-I levels of mSCLC-OVA cells pretreated with EZH2 inhibitor ±24 h co-culture with OT-I T cells. (C and D) Mean and SEM from a representative experiment performed in triplicate. Each experiment was performed three times with consistent results.
Figure 6
Figure 6
Silencing of MHC-I Antigen Processing Is a Conserved Function of PRC2 that Facilitates Immune Evasion in Transmissible Cancers (A) mSCLC RP-116 tumor growth following subcutaneous transplant into syngeneic C57BL/6 mice (100,000 cells) or allogeneic BALB/c mice (500,000 cells). Endpoint at a tumor volume of 500 mm3. (B) qRT-PCR analysis of MHC-I gene expression in DFT1 cells C5065 following treatment with 3 μM EED-226 for 10 days. Bars depict mean fold change in expression from independent experiments and points indicate the mean of technical triplicates from individual experiments. SAHAI-1 encodes Tasmanian devil MHC-I. (C and D) Tumor growth in (C) and survival of (D) BALB/c mice subcutaneously injected with 106Ezh2 KO or parental mSCLC RP-116 cells. Endpoint at a tumor volume of 500 mm3. Six mice per group. p value calculated using Mantel-Cox test. (E) Progression biopsy (left) and postmortem histology (right) in patient 1. Immunohistochemistry for neuroendocrine markers (synaptophysin and NCAM) and MHC-I APP components (MHC-I, β2m, and LMP7). Area between the red lines in biopsy contains SCLC. See also Figures S4 and S6.
Figure 7
Figure 7
An Evolutionarily Conserved Function of PRC2 Maintains Bivalency at MHC-I Gene Promoters in Embryonic Stem and Tissue-Specific Progenitor Cells and in MHC-I Low Cancers (A) RNA-seq heatmap displaying H3K27me3-modified genes upregulated by >1.5 log2FC in K-562 7 days following transduction with EED sgRNA compared with control sgRNA. Cells were additionally pulsed ± IFN-γ 10 ng/mL for 24 h. Genes were clustered using Euclidean clustering, and clusters were separated using a Kmeans of 3. Red indicates higher expression and blue indicates lower expression. (B) H3K27me3 chromatin immunoprecipitation (ChIP) qPCR at HLA-B and NLRC5 promoters in EED KO K-562 transduced with control GFP vector, WT EED, or EED W364A. Fold enrichment was calculated relative to the signal at the GAPDH promoter (negative control). Bars show the mean of three technical replicates. (C) Bivalent H3K27me3 and H3K4me3 modification of MHC-I gene promoters in human and Tasmanian devil cancer cells and mouse neural crest cells. ChIP sequencing (ChIP-seq) in K-562 and Tasmanian devil cells was performed in-house. Neural crest data are from GEO: GSE89435 (Minoux et al., 2017), BE2-C from GEO: GSE80151 (Zeid et al., 2018), and NT2-D1 from GEO: GSE31755 (ENCODE Project Consortium, 2012). y axes indicate reads per million (rpm). (D and E) Chromatin state discovery tracks in selected human embryonic stem and progenitor cells (D) and normal adult human tissues (E) generated using ChromHMM software integrating H3K27me3, H3K4me3, H3K27ac, and H3K36me3 ChIP-seq data from NIH Roadmap Epigenomics Mapping Consortium (Kundaje et al., 2015). Generated chromatin annotation states for the TSS (tss) and gene body (gb) of the indicated genes are shown. See also Figure S7 and Table S2.
Figure 8
Figure 8
Disruption of PRC2 Leads to Derepression of NLRC5 and Enhanced IRF1 Binding at MHC-I Gene cis-Regulatory Regions (A) RNA-seq and H3K27me3 ChIP-seq data in K-562 cells displaying reported transcriptional regulators of MHC-I expression. RNA-seq heatmap shows log2FC gene expression of K-562 cells expressing an EED sgRNA compared with control sgRNA at 7 and 10 days post-transduction. The H3K27me3 ChIP-seq heatmap shows the number of reads at 2 kb upstream of tss, genebody and 2 kb downstream of tes (transcription end site) of each gene. (B) A schematic presentation of cis-regulatory elements in the HLA-B promoter. NLRC5 forms an enhanceosome with the regulatory factor X (RFX) complex, comprising RFX5, RFXANK (RFX-associated ankyrin-containing protein), and RFXAP (RFX-associated protein). CREB (cAMP-responsive-element-binding protein 1); NFY (nuclear transcription factor Y); ISRE (IFN-stimulated response element); USF1 (upstream stimulatory factor 1). (C) Cell surface MHC-I in K-562 Cas9 cells expressing control, NLRC5-, or RFX5-specific sgRNA following incubation with IFN-γ 10 ng/mL for 24 h. (D) Cell surface MHC-I in EED or EZH2 KO K-562 Cas9 cells transduced with either control sgRNA or NLRC5-, RFX5-, RELA-, or IRF1-specific sgRNA. Bars represent mean fold change in expression from independent experiments indicated by points. (E) IRF1 ChIP-seq in K-562 cells treated with EZH2i (EPZ-011989 3 μM) or ethanol for 10 days. Plots show IRF1 occupancy at MHC-I genes. (F) qRT-PCR analysis of MHC-I gene expression in EED KO K-562 compared with IFN-γ-treated control cells. Bars indicate mean fold change in expression relative to untreated control parental K-562 from independent experiments. See also Figure S8.

Comment in

References

    1. Abou El H.M., Huang K., Eswara M.B., Zhao M., Song L., Yu T., Liu Y., Liu J.C., McCurdy S., Ma A. Cancer cells hijack PRC2 to modify multiple cytokine pathways. PLoS One. 2015;10:e0126466. - PMC - PubMed
    1. Aggarwal R., Huang J., Alumkal J.J., Zhang L., Feng F.Y., Thomas G.V., Weinstein A.S., Friedl V., Zhang C., Witte O.N. Clinical and genomic characterization of treatment-emergent small-cell neuroendocrine prostate cancer: a multi-institutional prospective study. J. Clin. Oncol. 2018;36:2492–2503. - PMC - PubMed
    1. Agudo J., Park E.S., Rose S.A., Alibo E., Sweeney R., Dhainaut M., Kobayashi K.S., Sachidanandam R., Baccarini A., Merad M., Brown B.D. Quiescent tissue stem cells evade immune surveillance. Immunity. 2018;48:271–285. - PMC - PubMed
    1. Alexandrov L.B., Nik-Zainal S., Wedge D.C., Aparicio S.A., Behjati S., Biankin A.V., Bignell G.R., Bolli N., Borg A., Borresen-Dale A.L. Signatures of mutational processes in human cancer. Nature. 2013;500:415–421. - PMC - PubMed
    1. Ardehali M.B., Anselmo A., Cochrane J.C., Kundu S., Sadreyev R.I., Kingston R.E. Polycomb repressive complex 2 methylates elongin A to regulate transcription. Mol. Cell. 2017;68:872–884.e6. - PMC - PubMed

Publication types

MeSH terms

Substances