. 2019 Oct 14;36(4):402-417.e13.
doi: 10.1016/j.ccell.2019.08.006. Epub 2019 Sep 26.

Dynamic Incorporation of Histone H3 Variants into Chromatin Is Essential for Acquisition of Aggressive Traits and Metastatic Colonization

Affiliations

Dynamic Incorporation of Histone H3 Variants into Chromatin Is Essential for Acquisition of Aggressive Traits and Metastatic Colonization

Ana P Gomes et al. Cancer Cell. .

Abstract

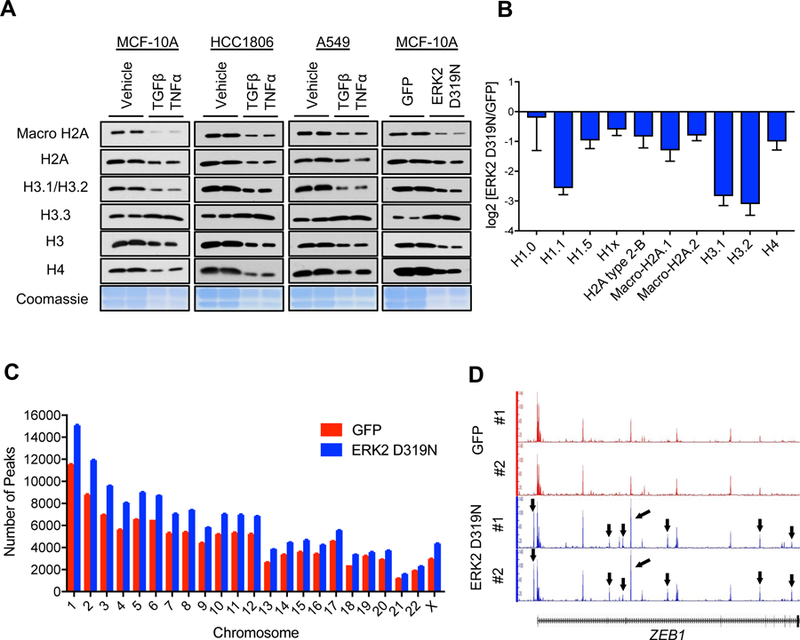
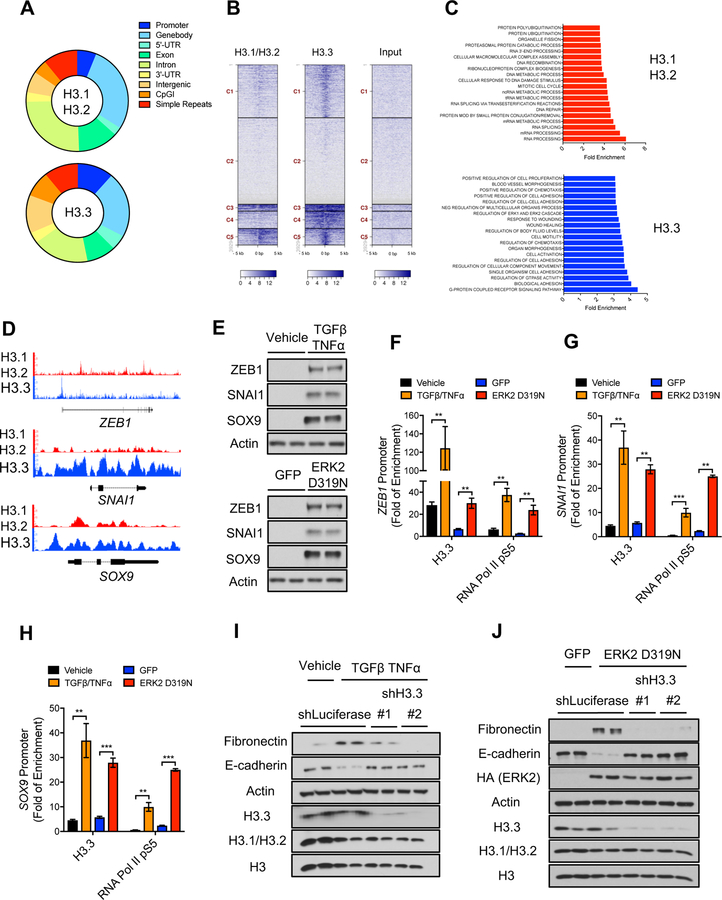
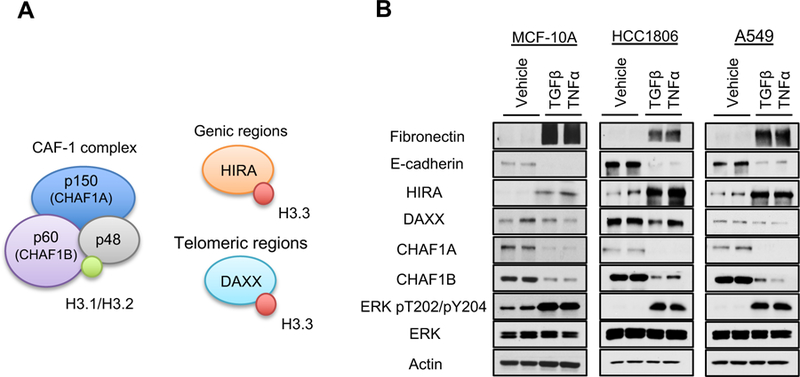
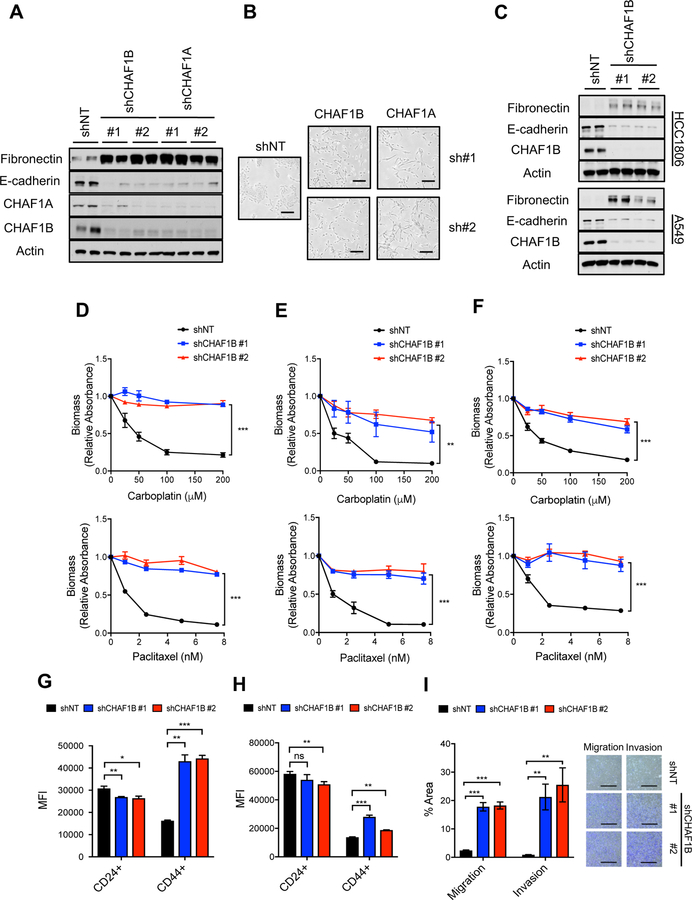
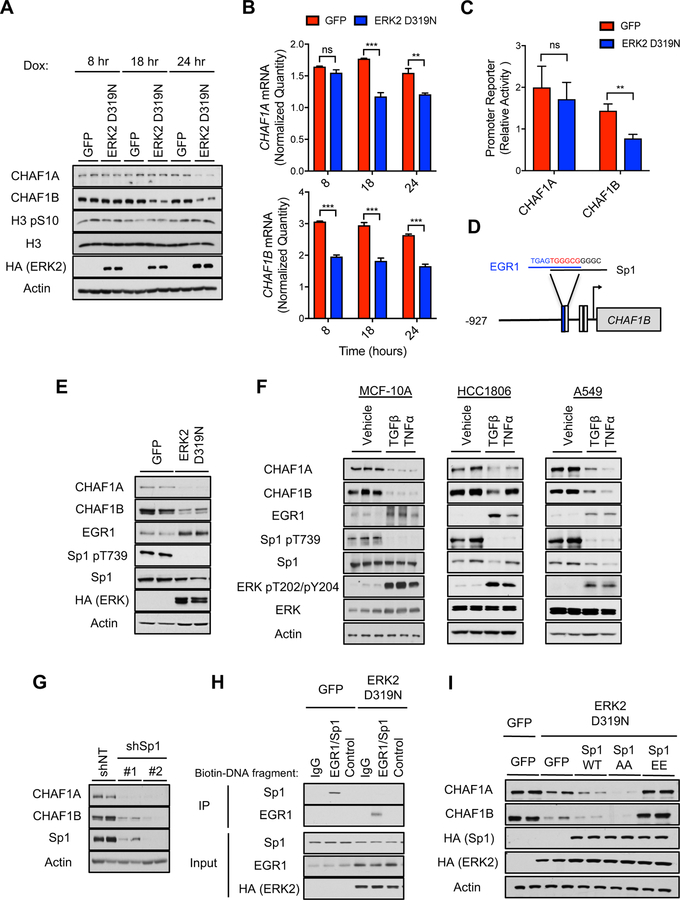
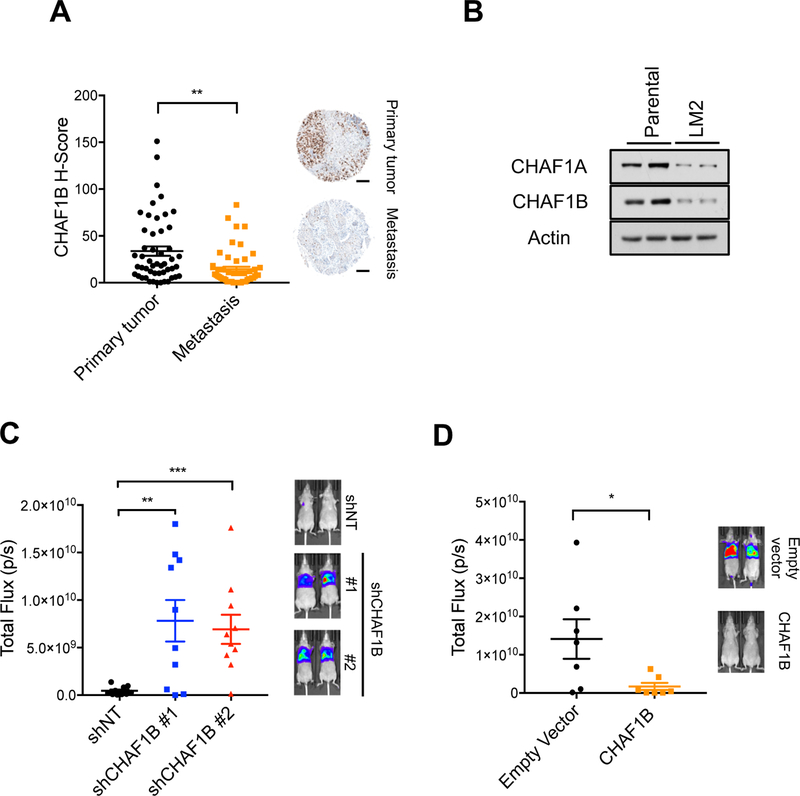
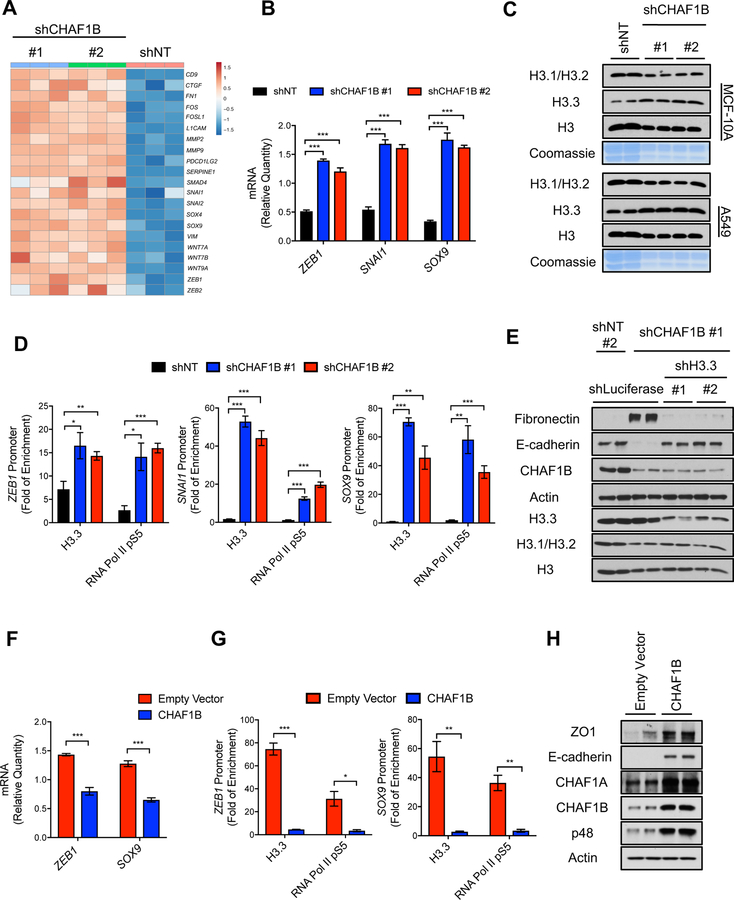
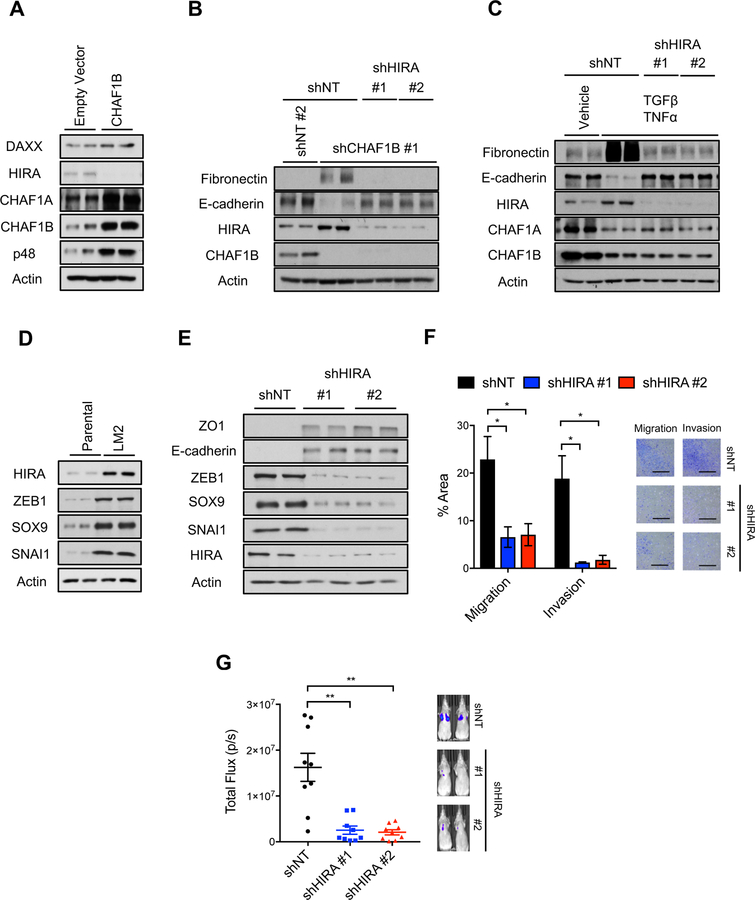
Metastasis is the leading cause of cancer mortality. Chromatin remodeling provides the foundation for the cellular reprogramming necessary to drive metastasis. However, little is known about the nature of this remodeling and its regulation. Here, we show that metastasis-inducing pathways regulate histone chaperones to reduce canonical histone incorporation into chromatin, triggering deposition of H3.3 variant at the promoters of poor-prognosis genes and metastasis-inducing transcription factors. This specific incorporation of H3.3 into chromatin is both necessary and sufficient for the induction of aggressive traits that allow for metastasis formation. Together, our data clearly show incorporation of histone variant H3.3 into chromatin as a major regulator of cell fate during tumorigenesis, and histone chaperones as valuable therapeutic targets for invasive carcinomas.

Keywords: CAF-1 complex; HIRA; chromatin remodeling; epigenetics; histone H3.3; histone chaperones; metastasis; tumor progression.


Conflict of interest statement

Declaration of Interests

J.M. is a scientific advisor and owns company stock in Scholar Rock. A.M.M. receives research funding from Janssen and has consulted for Epizyme and Constellation. L.C.C. owns equity in, receives compensation from, and serves on the Board of Directors and Scientific Advisory Board of Agios Pharmaceuticals and Petra Pharma Corporation. No potential conflicts of interest were disclosed by the other authors.

Figures

Figure 1.
Figure 1.. EMT induction promotes a global decline in histone levels promoting H3.3-mediated gap filling and increasing chromatin accessibility
(A) Levels of various histones and Coomassie Blue stain of total histones in histone extracts of cells treated with TGFβ + TNFα (MCF-10A for 5 days, HCC1806 and A549 for 10 days) or MCF-10A expressing ERK2 D319N inducibly for 3 days; representative images (n = 4). (B) Histone quantification by mass spectrometry in MCF-10A expressing ERK2 D319N inducibly for 3 days (n = 3). All values are expressed as mean ± SEM. (C and D) Summary of genome-wide nucleosome occupancy showing distribution of detected peaks on chromosomes (All values are expressed as mean ± SEM) (C), and signal tracks for ZEB1 (D) determined by ATAC-seq in MCF-10A expressing ERK2 D319N inducibly for 3 days; arrows indicate the presence of novel peaks. See also Figure S1 and Table S1.
Figure 2.
Figure 2.. Histone H3.3 mediates metastatic traits by regulating aggressive factors
(A-D) Summary of H3.1/H3.2 and H3.3 ChIP-seq analysis in LM2 cells showing genomic distribution of H3.1/H3.2 and H3.3 peaks (A), density heat maps of H3.1/H3.2 and H3.3 peaks across transcriptional starting sites (TSS) (Darker blue indicates higher enrichment) (B), GSEA analysis of genes enriched for H3.1/H3.2 or H3.3 (C), and H3.1/H3.2 and H3.3 signal tracks (D). (E) Levels of the EMT-inducing transcription factors ZEB1, SNAI1 and SOX9 in MCF-10A treated with TGFβ + TNFα for 5 days or expressing ERK2 D319N for 6 days after transduction; representative images (n = 4). (F-H) H3.3 and RNA Pol II pS5 enrichment at the ZEB1 (F), SNAI1 (G) and SOX9 (H) promoters in MCF-10A treated with TGFβ + TNFα or expressing inducible ERK2 D319N for 3 days; fold enrichment was determined using IgG as a control for the ChIP (n = 4). All values are expressed as mean ± SEM (**p < 0.01, ***p < 0.001). (I and J) EMT induction determined by protein levels of the mesenchymal marker fibronectin and the epithelial marker E-cadherin after treatment with TGFβ + TNFα for 5 days (I) or expression of ERK2 D319N for 6 days after transduction (J) in MCF-10A with H3.3 knockdown; histone levels are detected in whole cell lysates to show knockdown efficiency of H3.3; representative images (n = 4). See also Figure S2 and Table S2.
Figure 3.
Figure 3.. ERK mediates a switch in histone H3 variants and their chaperones in response to metastatic inducers
(A) Schematic representation of the histone H3 chaperones: H3.1/H3.2 chaperone CAF-1 (comprised of CHAF1A, CHAF1B and p48) and H3.3 chaperones HIRA and DAXX. (B) Levels of the histone H3 chaperones in cells treated with TGFβ + TNFα (MCF-10A for 5 days, HCC1806 and A549 for 10 days); representative images (n = 4). See also Figure S3.
Figure 4.
Figure 4.. Suppression of the CAF-1 complex induces aggressive traits
(A) EMT induction determined by the protein levels of the mesenchymal marker fibronectin and the epithelial marker E-cadherin in MCF-10A with CHAF1B knockdown for 10 days; representative images (n = 4). (B) Morphology of MCF-10A with CHAF1A or CHAF1B knockdown for 10 days; representative images (n = 4), scale bar = 200 µm. (C) EMT induction determined by the protein levels of the mesenchymal marker fibronectin and the epithelial marker E-cadherin in HCC1806 or A549 with CHAF1B knockdown for 10 days; representative images (n = 4). (D-F) Viability of MCF-10A (D), HCC1806 (E), and A549 (F) with CHAF1B knockdown for 10 days treated with the chemotherapeutic drugs carboplatin and paclitaxel (n = 4). (G and H) Stemness evaluated by the increase in the CD44 marker and decrease in the CD24 in MCF-10A (G) and A549 (H) both with CHAF1B knockdown for 10 days (n = 4). (I) Quantification of migration and invasion of MCF-10A with CHAF1B knockdown for 10 days evaluated by transwell assays (left); representative images (right) (n = 4), scale bar = 1 mm. All values are expressed as mean ± SEM (ns: not significant, *p < 0.05, **p < 0.01, ***p < 0.001). See also Figure S4.
Figure 5.
Figure 5.. Metastatic signaling controls the CAF-1 complex through an ERK-mediated regulation of the CHAF1B promoter
(A and B) Time-course analysis of CAF-1 complex and the cell cycle marker H3 pS10 protein levels (A), and CHAF1A and CHAF1B mRNA levels evaluated by qPCR (B) in MCF-10A expressing inducible ERK2 D319N for up to 24 hours; representative images (n = 4). (C) CHAF1A and CHAF1B promoter activity measured via a luciferase reporter assay in MCF-10A expressing inducible ERK2 D319N for 3 days; luciferase values are normalized to GFP control cells (n = 6). (D) Schematic of Sp1 and EGR1 binding sites in CHAF1B promoter. (E) CAF-1 complex, EGR1 and Sp1 p-T739 protein levels in MCF-10A expressing inducible ERK2 D319N for 3 days; representative images (n = 4). (F) CAF-1 complex, EGR1, Sp1 p-T739 and ERK2 p-T202/Y204 protein levels in cells treated with TGFβ + TNFα (MCF-10A for 5 days, HCC1806 and A549 for 10 days); representative images (n = 4). (G) CHAF1A and CHAF1B protein levels in MCF-10A with shRNA-mediated Sp1 knockdown for 3 days; representative images (n = 4). (H) Binding of Sp1 and/or EGR1 to biotinylated DNA fragments of either the CHAF1B promoter containing the overlapping Sp1/EGR1 site or a scrambled control in lysates from MCF-10A expressing inducible ERK2 D319N for 3 days; IgG control for immunoprecipitation of the DNA fragments with streptavidin; representative images (n = 4). (I) CAF-1 complex protein levels in MCF-10A expressing inducible ERK2 D319N and either Sp1 WT or the Sp1 T453/T739 phosphorylation site mutants for 3 days; representative images (n = 4). All values are expressed as mean ± SEM (**p < 0.01, ***p < 0.001). See also Figure S5.
Figure 6.
Figure 6.. CAF-1 levels regulate metastatic colonization
(A) CHAF1B levels in a tissue array of primary cancers and matched lymph node metastases from breast cancer patients (left); representative images (right) (n = 50), scale bar = 200 µm. (B) CAF-1 complex protein levels in MDA-MB-231 parental versus the more metastatic LM2 clone; representative images (n = 4). (C) Quantification of lung metastatic lesions of parental and CHAF1B knockdown MDA-MB-231 cells (left) (p/s indicates photons/second); representative images (right) (n = 10). (D) Quantification of lung metastatic lesions of LM2 cells with or without CHAF1B overexpression (left) (p/s indicates photons/second); representative images (right) (n = 7). All values are expressed as mean ± SEM (ns: not significant, *p < 0.05, **p < 0.01, ***p < 0.001). See also Figure S6 and Table S3.
Figure 7.
Figure 7.. Suppression of the CAF-1 complex triggers an H3.3-dependent global transcriptional reprogramming that underlies the acquisition of aggressive properties
(A) Heatmap representation of wound-healing-related and poor-prognosis genes detected in RNA-seq analysis in MCF-10A with CHAF1B knockdown for 3 days, up regulated genes are indicated with red and down regulated genes are indicated with blue, (n = 3). (B) Relative mRNA levels of ZEB1, SNAI1 and SOX9 evaluated by qPCR in MCF-10A with CHAF1B knockdown for 3 days (n = 3). (C) Levels of H3 histone variants in chromatin extracts and Coomassie Blue stain of total histones in histone extracts of MCF-10A and A549 both with CHAF1B knockdown for 3 days; representative images (n = 4). (D) H3.3 and RNA Pol II pS5 enrichment at the ZEB1, SNAI1 and SOX9 promoters in MCF-10A with CHAF1B knockdown for 3 days; fold enrichment was determined using IgG as a control for the ChIP (n = 4). (E) EMT induction determined by the protein levels of the mesenchymal marker fibronectin and the epithelial marker E-cadherin in MCF-10A cells with H3.3 suppression after CHAF1B knockdown for 10 days; representative images; histone levels are detected in whole cell lysate to show knockdown efficiency of H3.3 (n = 4). (F) mRNA levels of ZEB1 and SOX9 evaluated by qPCR in LM2 cells overexpressing CHAF1B for 3 days (n = 4). (G) H3.3 and RNA Pol II pS5 enrichment at the ZEB1 and SOX9 promoters in LM2 cells overexpressing CHAF1B for 10 days; fold enrichment was determined using IgG as a control for the chromatin immunoprecipitation (n = 4). (H) Levels of epithelial markers E-cadherin and zona occludens 1 (ZO1) in LM2 cells overexpressing CHAF1B for 10 days; representative images (n = 4). All values are expressed as mean ± SEM (*p < 0.05, **p < 0.01, ***p < 0.001). See also Figure S7 and Table S4.
Figure 8.
Figure 8.. HIRA mediates the pro-metastatic effects of CAF-1 and is necessary for EMT induction and metastatic colonization
(A) Levels of H3.3 chaperones in LM2 cells overexpressing CHAF1B for 10 days; representative images (n = 4). (B) EMT induction determined by the protein levels of the mesenchymal marker fibronectin and the epithelial marker E-cadherin after 10 days of CHAF1B and HIRA knockdown in MCF-10A cells; representative images (n = 4). (C) EMT induction determined by protein levels of the mesenchymal marker fibronectin and the epithelial marker E-cadherin after 5 days of treatment with TGFβ + TNFα in MCF-10A cells with HIRA knockdown; representative images (n = 4). (D) Protein levels of HIRA and the EMT-inducing transcription factors ZEB1, SOX9 and SNAI1 in MDA-MB-231 parental versus the more metastatic LM2 clone; representative images (n = 4). (E) Levels of epithelial markers E-cadherin and zona occludens 1 (ZO1) and EMT-inducing transcription factors ZEB1, SOX9 and SNAI1 in LM2 cells with HIRA knockdown for 10 days; representative images (n = 4). (F) Quantification of migration and invasion of LM2 cells with HIRA knockdown for 10 days evaluated by transwell assays (left); representative images (right) (n = 3), scale bar = 1 mm. (G) Quantification of lung metastatic lesions of LM2 cells with HIRA knockdown for 10 days (left); represented images (right) (n = 9). All values are expressed as mean ± SEM (*p < 0.05, **p < 0.01, ***p < 0.001). See also Figure S8.

References

    1. Arwert EN, Hoste E, and Watt FM (2012). Epithelial stem cells, wound healing and cancer. Nat Rev Cancer 12, 170–180. - PubMed
    1. Asiedu MK, Ingle JN, Behrens MD, Radisky DC, and Knutson KL (2011). TGFbeta/TNF(alpha)-mediated epithelial-mesenchymal transition generates breast cancer stem cells with a claudin-low phenotype. Cancer Res 71, 4707–4719. - PMC - PubMed
    1. Balkwill F (2006). TNF-alpha in promotion and progression of cancer. Cancer Metastasis Rev 25, 409–416. - PubMed
    1. Bedi U, Mishra VK, Wasilewski D, Scheel C, and Johnsen SA (2014). Epigenetic plasticity: a central regulator of epithelial-to-mesenchymal transition in cancer. Oncotarget 5, 2016–2029. - PMC - PubMed
    1. Boersema PJ, Aye TT, van Veen TA, Heck AJ, and Mohammed S (2008). Triplex protein quantification based on stable isotope labeling by peptide dimethylation applied to cell and tissue lysates. Proteomics 8, 4624–4632. - PubMed

Publication types

MeSH terms