. 2019 Sep 3:2019:6067871.
doi: 10.1155/2019/6067871. eCollection 2019.

Stimulus- and Neural-Referred Visual Receptive Field Properties following Hemispherectomy: A Case Study Revisited

Affiliations

Stimulus- and Neural-Referred Visual Receptive Field Properties following Hemispherectomy: A Case Study Revisited

Hinke N Halbertsma et al. Neural Plast. .

Abstract

Damage to the visual system can result in (a partial) loss of vision, in response to which the visual system may functionally reorganize. Yet the timing, extent, and conditions under which this occurs are not well understood. Hence, studies in individuals with diverse congenital and acquired conditions and using various methods are needed to better understand this. In the present study, we examined the visual system of a young girl who received a hemispherectomy at the age of three and who consequently suffered from hemianopia. We did so by evaluating the corticocortical and retinocortical projections in the visual system of her remaining hemisphere. For the examination of these aspects, we analyzed the characteristics of the connective fields ("neural-referred" receptive fields) based on both resting-state (RS) and retinotopy data. The evaluation of RS data, reflecting brain activity independent from visual stimulation, is of particular interest as it is not biased by the patient's atypical visual percept. We found that, primarily when the patient was at rest, the connective fields between V1 and both early and late visual areas were larger than normal. These abnormally large connective fields could be a sign either of functional reorganization or of unmasked suppressive feedback signals that are normally masked by interhemispheric signals. Furthermore, we confirmed our previous finding of abnormal retinocortical or "stimulus-referred" projections in both early and late visual areas. More specifically, we found an enlarged foveal representation and smaller population receptive fields. These differences could also be a sign of functional reorganization or rather a reflection of the interruption visual information that travels, via the remainder of the visual pathway, from the retina to the visual cortex. To conclude, while we do find indications for relatively subtle changes in visual field map properties, we found no evidence of large-scale reorganization-even though the patient could have benefitted from this. Our work suggests that at a later developmental stage, large-scale reorganization of the visual system no longer occurs, while small-scale properties may still change to facilitate adaptive processing and viewing strategies.


Conflict of interest statement

The authors declare no conflict of interests.

Figures

Figure 1
Figure 1
Anatomical MRI and Goldmann perimetry of the hemispherectomised patient. (a) High-resolution anatomical MRI scan showing the absence of the left hemispheres from a sagittal (left), coronal (middle), and axial (right) view. (b) Goldmann perimetry of both the left and right eyes showing a complete right-sided homonymous visual field defect, without macular sparing. The red patch indicates the size of the visual field that was stimulated during the fMRI experiment.
Figure 2
Figure 2
Relationship between eccentricity and size for CFAS (a) and CFRS (b). Data for both area groups of interest, grouped over controls and for the patient (red). CF eccentricity was binned in intervals of 1 deg. Median CF eccentricities are plotted, for which quantile regression fits were calculated (solid red line). Dashed lines represent the 95% bootstrapped confidence intervals for the fit of the median (1000 iterations).
Figure 3
Figure 3
Difference distributions of the medians (patient − controln). (a) Differences in median CF eccentricity (deg) per area group. (b) Differences in median CF size (in mm) per area group. Pink: CFAS data; blue: CFRS data; thick line: mean difference over all participants, with the dark and lighter shaded areas representing one SD and the 95% confidence interval of the mean, respectively. Blue dashed line at zero indicates no difference between the patient and control. An asterisk indicates a distribution deviating significantly from zero (p < 0.0125).
Figure 4
Figure 4
Relative frequency distributions of CFAS (pink) and CFRS (green) eccentricity (a) and size (b), per area group. Solid lines: average across controls (n = 12); shaded areas: 95% CI; dashed lines: patient.
Figure 5
Figure 5
Relative frequency distributions of both CFEC samples (blue lines), CFEO (green), and CFFIX purple size, per area group. Solid colored lines: average across controls (n = 4); shaded areas: 95% CI. Additionally, the CF size distribution of the patient (solid black) and the average distribution of the original groups of controls (dashed black, n = 12) are plotted.
Figure 6
Figure 6
Relationship between pRF eccentricity and size. Data are presented for both area groups of interest, grouped over controls (black) versus the patient (red). PRF eccentricity was binned in intervals of 1 deg. Median pRF eccentricities are plotted, for which quantile regression fits were calculated (solid red line). Dashed lines represent the 95% bootstrapped confidence intervals for the fit of the median (1000 iterations).
Figure 7
Figure 7
Difference distributions of the medians (patient − controln). (a) Difference in pRF eccentricity per area group. (b) Same for pRF size. Thick line: mean difference over all participants, the dark and lighter shaded areas representing one SD and the 95% confidence interval of the mean, respectively. Blue dashed line at zero indicates no difference between the patient and control. Asterisk indicates a distribution deviating significantly from zero (p < 0.01).
Figure 8
Figure 8
Relative frequency distribution for pRF eccentricity (a) and size (b). Green line: average of controls (n = 12); green shaded area: 95% CI; red line: patient.
Figure 9
Figure 9
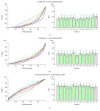
Isosensitivity and AUC plots for model comparison. (a1, b1, c1) Isosensitivity lines for the different model comparisons. Control participants are presented in colored solid lines and the patient in a dashed black line. Bisection line (AUC = 0.5) is plotted in dotted blue. (a2, b2, c2) A bar graph of the AUC values per participant. Error bars represent the 95% CI.

References

    1. Werth R. Visual functions without the occipital lobe or after cerebral hemispherectomy in infancy. European Journal of Neuroscience. 2006;24(10):2932–2944. doi: 10.1111/j.1460-9568.2006.05171.x. - DOI - PubMed
    1. Huxlin K. R. Perceptual plasticity in damaged adult visual systems. Vision Research. 2008;48(20):2154–2166. doi: 10.1016/j.visres.2008.05.022. - DOI - PubMed
    1. Wandell B. A., Smirnakis S. M. Plasticity and stability of visual field maps in adult primary visual cortex. Nature Reviews Neuroscience. 2009;10(12):873–884. doi: 10.1038/nrn2741. - DOI - PMC - PubMed
    1. Guzzetta A., D’Acunto G., Rose S., Tinelli F., Boyd R., Cioni G. Plasticity of the visual system after early brain damage. Developmental Medicine & Child Neurology. 2010;52(10):891–900. doi: 10.1111/j.1469-8749.2010.03710.x. - DOI - PubMed
    1. Gilbert C. D., Li W. Adult visual cortical plasticity. Neuron. 2012;75(2):250–264. doi: 10.1016/j.neuron.2012.06.030. - DOI - PMC - PubMed

Publication types

LinkOut - more resources