

Scale-free behaviour and metastable brain-state switching driven by human cognition, an empirical approach
- PMID: 31565089
- PMCID: PMC6746897
- DOI: 10.1007/s11571-019-09533-0
Scale-free behaviour and metastable brain-state switching driven by human cognition, an empirical approach
Abstract
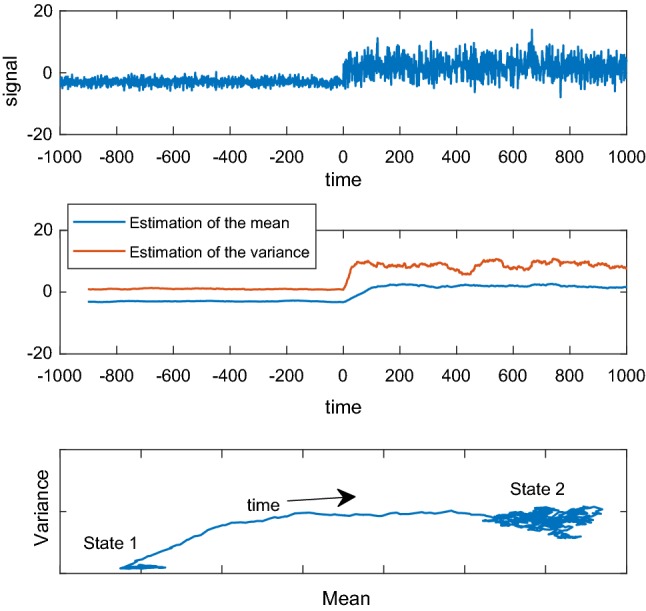
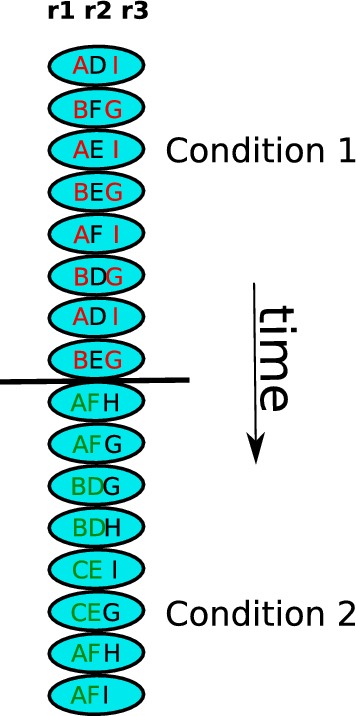
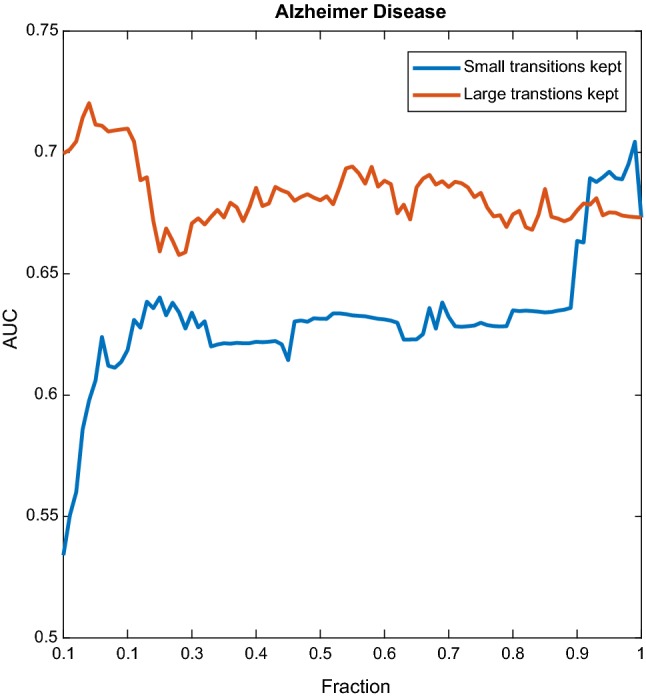
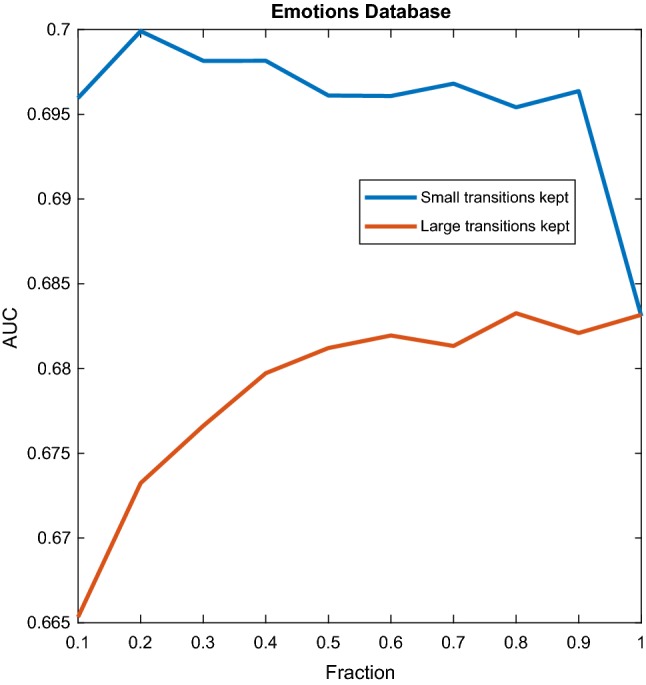
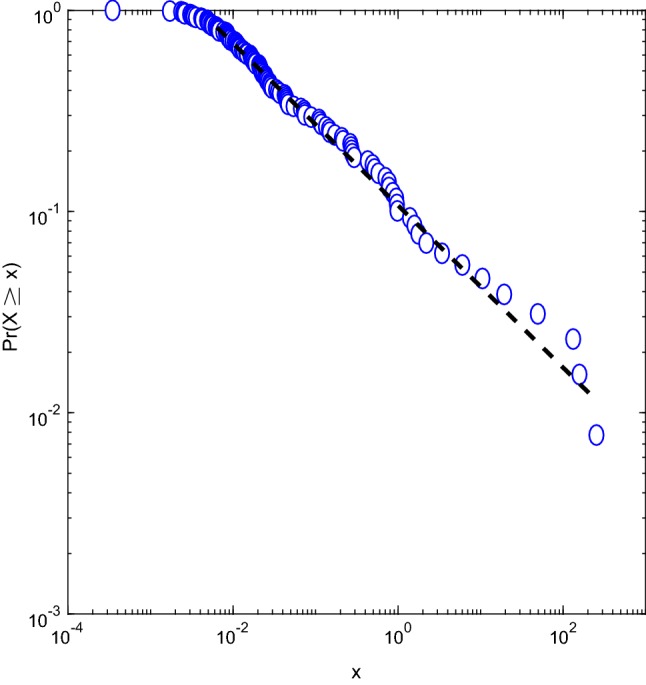
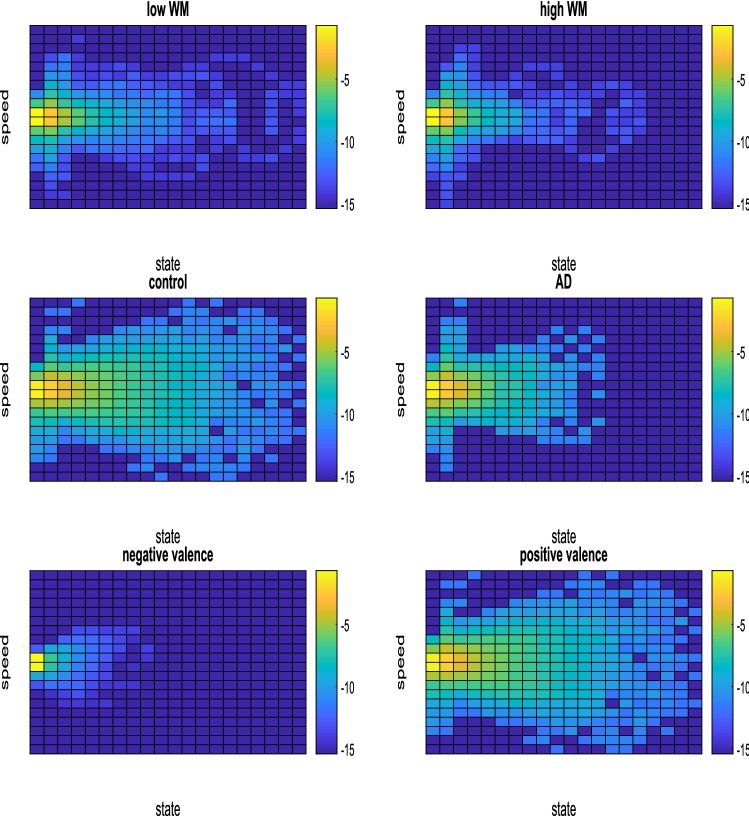
We developed a framework to study brain dynamics under cognition. In particular, we investigated the spatiotemporal properties of brain state switches under cognition. The lack of electroencephalography stationarity is exploited as one of the signatures of the metastability of brain states. We correlated power law exponents in the variables that we proposed to describe brain states, and dynamical properties of non-stationarities with cognitive conditions. This framework was successfully tested with three different datasets: a working memory dataset, an Alzheimer disease dataset, and an emotions dataset. We discuss the temporal organization of switches between states, providing evidence suggesting the need to reconsider the piecewise model, in which switches appear at discrete times. Instead, we propose a more dynamically rich view, in which besides the seemingly discrete switches, switches between neighbouring states occur all the time. These micro switches are not (physical) noise, as their properties are also affected by cognition.
Keywords: Brain dynamics; Cognition; EEG non-stationarity; Machine learning; Metastability; Scale-free dynamics.
© Springer Nature B.V. 2019.
Conflict of interest statement
Conflict of interestWe declare that we have no conflict of interest.
Figures
Similar articles
-
Development of brain metastable dynamics during the equivalent of the third gestational trimester.Dev Cogn Neurosci. 2025 Jun;73:101556. doi: 10.1016/j.dcn.2025.101556. Epub 2025 Apr 7. Dev Cogn Neurosci. 2025. PMID: 40252359 Free PMC article. Review.
-
Emergence of metastable dynamics in functional brain organization via spontaneous fMRI signal and whole-brain computational modeling.Annu Int Conf IEEE Eng Med Biol Soc. 2017 Jul;2017:4471-4474. doi: 10.1109/EMBC.2017.8037849. Annu Int Conf IEEE Eng Med Biol Soc. 2017. PMID: 29060890
-
Inhibitory control of frontal metastability sets the temporal signature of cognition.Elife. 2022 May 30;11:e63795. doi: 10.7554/eLife.63795. Elife. 2022. PMID: 35635439 Free PMC article.
-
Mapping the dynamic repertoire of the resting brain.Neuroimage. 2013 Sep;78:448-62. doi: 10.1016/j.neuroimage.2013.04.041. Epub 2013 Apr 23. Neuroimage. 2013. PMID: 23618603
-
Interpreting temporal fluctuations in resting-state functional connectivity MRI.Neuroimage. 2017 Dec;163:437-455. doi: 10.1016/j.neuroimage.2017.09.012. Epub 2017 Sep 12. Neuroimage. 2017. PMID: 28916180 Review.
Cited by
-
A stacked sparse auto-encoder and back propagation network model for sensory event detection via a flexible ECoG.Cogn Neurodyn. 2020 Oct;14(5):591-607. doi: 10.1007/s11571-020-09603-8. Epub 2020 Jun 1. Cogn Neurodyn. 2020. PMID: 33014175 Free PMC article.
-
Diffuse neural coupling mediates complex network dynamics through the formation of quasi-critical brain states.Nat Commun. 2020 Dec 10;11(1):6337. doi: 10.1038/s41467-020-19716-7. Nat Commun. 2020. PMID: 33303766 Free PMC article.
-
Energy features in spontaneous up and down oscillations.Cogn Neurodyn. 2021 Feb;15(1):65-75. doi: 10.1007/s11571-020-09597-3. Epub 2020 May 29. Cogn Neurodyn. 2021. PMID: 33786080 Free PMC article.
-
Functional and effective connectivity based features of EEG signals for object recognition.Cogn Neurodyn. 2019 Dec;13(6):555-566. doi: 10.1007/s11571-019-09556-7. Epub 2019 Oct 1. Cogn Neurodyn. 2019. PMID: 31741692 Free PMC article.
-
Evolutionary Advantages of Stimulus-Driven EEG Phase Transitions in the Upper Cortical Layers.Front Syst Neurosci. 2021 Dec 8;15:784404. doi: 10.3389/fnsys.2021.784404. eCollection 2021. Front Syst Neurosci. 2021. PMID: 34955771 Free PMC article.
References
-
- Agarwal R, Gotman J (1999) Adaptive segmentation of electroencephalographic data using a nonlinear energy operator. In: Proceedings of the 1999 IEEE international symposium on circuits and systems, 1999. ISCAS’99, vol 4. IEEE, pp 199–202
LinkOut - more resources
Full Text Sources
