

Intestinal permeability and inflammation mediate the association between nutrient density of complementary foods and biochemical measures of micronutrient status in young children: results from the MAL-ED study
- PMID: 31565748
- PMCID: PMC6766446
- DOI: 10.1093/ajcn/nqz151
Intestinal permeability and inflammation mediate the association between nutrient density of complementary foods and biochemical measures of micronutrient status in young children: results from the MAL-ED study
Abstract
Background: Environmental enteric dysfunction (EED) is thought to increase the risk of micronutrient deficiencies, but few studies adjust for dietary intakes and systemic inflammation.
Objective: We tested whether EED is associated with micronutrient deficiency risk independent of diet and systemic inflammation, and whether it mediates the relation between intake and micronutrient status.
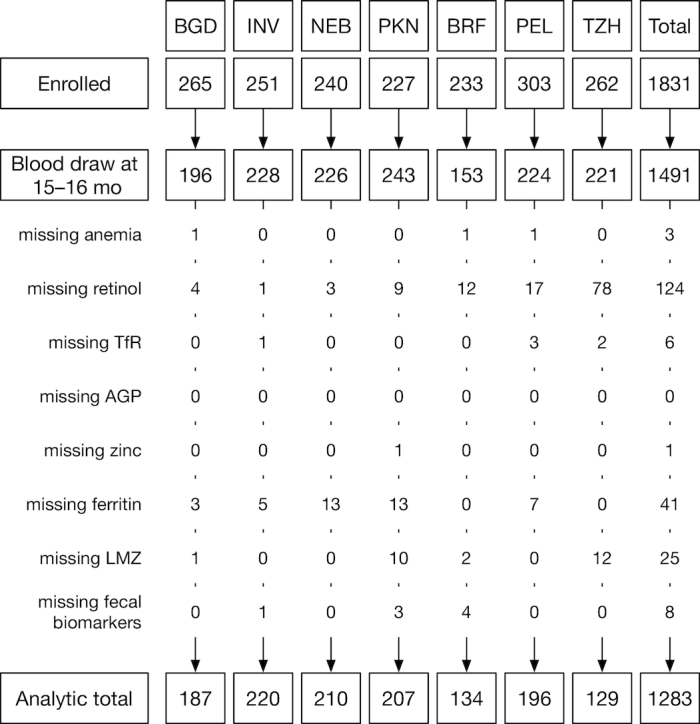
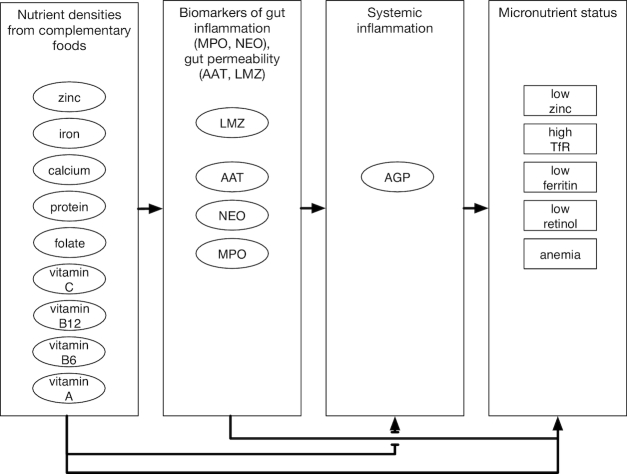
Methods: Using data from 1283 children in the MAL-ED (Etiology, Risk Factors, and Interactions of Enteric Infections and Malnutrition and the Consequences for Child Health) birth cohort we evaluated the risk of anemia, low retinol, zinc, and ferritin, and high transferrin receptor (TfR) at 15 mo. We characterized gut inflammation and permeability by myeloperoxidase (MPO), neopterin (NEO), and α-1-antitrypsin (AAT) concentrations from asymptomatic fecal samples averaged from 9 to 15 mo, and averaged the lactulose:mannitol ratio z-score (LMZ) at 9 and 15 mo. Nutrient intakes from complementary foods were quantified monthly from 9 to 15 mo and densities were averaged for analyses. α-1-Acid glycoprotein at 15 mo characterized systemic inflammation. Relations between variables were modeled using a Bayesian network.
Results: A greater risk of anemia was associated with LMZ [1.15 (95% CI: 1.01, 1.31)] and MPO [1.16 (1.01, 1.34)]. A greater risk of low ferritin was associated with AAT [1.19 (1.03, 1.37)] and NEO [1.22 (1.04, 1.44)]. A greater risk of low retinol was associated with LMZ [1.24 (1.08, 1.45)]. However, MPO was associated with a lower risk of high transferrin receptor [0.86 (0.74, 0.98)], NEO with a lower risk of low retinol [0.75 (0.62, 0.89)], and AAT with a lower risk of low plasma zinc [0.83 (0.70, 0.99)]. Greater nutrient intake densities (vitamins A and B6, calcium, protein, and zinc) were negatively associated with EED. Inverse associations between nutrient densities and micronutrient deficiency largely disappeared after adjustment for EED, suggesting that EED mediates these associations.
Conclusions: EED is independently associated with an increased risk of low ferritin, low retinol, and anemia. Greater nutrient density from complementary foods may reduce EED, and the control of micronutrient deficiencies may require control of EED.
Keywords: diet; environmental enteropathy; inflammation; intestinal barrier function; micronutrient status.
Copyright © American Society for Nutrition 2019.
Figures

References
-
- Black RE, Victora CG, Walker SP, Bhutta ZA, Christian P, de Onis M, Ezati M, Grantham-McGregor S, Katz J, Martorell R et al. .. Maternal and child undernutrition and overweight in low-income and middle-income countries. Lancet Lond Engl. 2013;382(9890):427–51. - PubMed
-
- Ramakrishnan U. Prevalence of micronutrient malnutrition worldwide. Nutr Rev. 2002;60(5 Pt 2):S46–52. - PubMed
-
- Bailey RL, West KP, Black RE. The epidemiology of global micronutrient deficiencies. Ann Nutr Metab. 2015;66(Suppl 2):22–33. - PubMed
Publication types
MeSH terms
Substances
Grants and funding
LinkOut - more resources
Full Text Sources
Medical
Molecular Biology Databases
Research Materials
Miscellaneous
