. 2019 Dec 1;317(6):F1450-F1461.
doi: 10.1152/ajprenal.00246.2019. Epub 2019 Sep 30.

Progression of diabetic kidney disease in T2DN rats

Affiliations

Progression of diabetic kidney disease in T2DN rats

Oleg Palygin et al. Am J Physiol Renal Physiol. .

Abstract

Diabetic kidney disease (DKD) is one of the leading pathological causes of decreased renal function and progression to end-stage kidney failure. To explore and characterize age-related changes in DKD and associated glomerular damage, we used a rat model of type 2 diabetic nephropathy (T2DN) at 12 wk and older than 48 wk. We compared their disease progression with control nondiabetic Wistar and diabetic Goto-Kakizaki (GK) rats. During the early stages of DKD, T2DN and GK animals revealed significant increases in blood glucose and kidney-to-body weight ratio. Both diabetic groups had significantly altered renin-angiotensin-aldosterone system function. Thereafter, during the later stages of disease progression, T2DN rats demonstrated a remarkable increase in renal damage compared with GK and Wistar rats, as indicated by renal hypertrophy, polyuria accompanied by a decrease in urine osmolarity, high cholesterol, a significant prevalence of medullary protein casts, and severe forms of glomerular injury. Urinary nephrin shedding indicated loss of the glomerular slit diaphragm, which also correlates with the dramatic elevation in albuminuria and loss of podocin staining in aged T2DN rats. Furthermore, we used scanning ion microscopy topographical analyses to detect and quantify the pathological remodeling in podocyte foot projections of isolated glomeruli from T2DN animals. In summary, T2DN rats developed renal and physiological abnormalities similar to clinical observations in human patients with DKD, including progressive glomerular damage and a significant decrease in renin-angiotensin-aldosterone system plasma levels, indicating these rats are an excellent model for studying the progression of renal damage in type 2 DKD.

Keywords: diabetic glomerular disease; diabetic nephropathy; podocyte pathology; renin-angiotensin-aldosterone system; scanning ion microscopy; type 2 diabetic nephropathy.


Conflict of interest statement

No conflicts of interest, financial or otherwise, are declared by the authors.

Figures

Fig. 1.
Fig. 1.
Development of diabetes in type 2 diabetic nephropathy (T2DN), Goto-Kakizaki (GK), and nondiabetic Wistar rats. A: blood glucose (Glu) levels (random, nonfasting) in 12-wk-old (top; ANOVA, P < 0.025, k = 3 groups) and >48-wk-old (bottom, *P < 0.002, k = 3) rats. B: total body weight (TBW) of age-matched 12- or 48-wk-old rats (*P < 0.001 vs. Wistar rats for both groups, k = 3). C: normalized two kidney-to-body weight (2K/BW) ratio for 12-wk-old (ANOVA, *P < 0.001 vs. Wistar rats, k = 3) or 48-wk-old (ANOVA, *P < 0.001, k = 3) rats.
Fig. 2.
Fig. 2.
Angiotensin peptide plasma expression levels in diabetic rats. A−D: equilibrium levels of ANG I-(1–10) (A), ANG II-(1–8) (B), ANG III-(2–8) and ANG-(1–7) (C), and ANG IV-(3–8) and ANG-(1–5) (D) in 12-wk-old Wistar, Goto-Kakizaki (GK), and type 2 diabetic nephropathy (T2DN) rats. P values are shown for each graph (determined by one-way ANOVA, k = 3 groups). Each dot represents one rat. ACE, angiotensin-converting enzyme; ACE2, angiotensin-converting enzyme 2; APA, aminopeptidase A; APN, aminopeptidase N. *Statistically significant differences are shown.
Fig. 3.
Fig. 3.
Aldosterone levels and angiotensin-converting enzyme (ACE) and renin activity in diabetic rats. A: summary graph of plasma aldosterone levels in 12-wk-old Wistar, Goto-Kakizaki (GK), and type 2 diabetic nephropathy (T2DN) rats. B: ratio of aldosterone and ANG II (AA2 ratio) is representative of changes in primary aldosteronism. C: ratio of ANG II to ANG I demonstrating ACE activity. D: sum of ANG I and ANG II representing circulating plasma renin activity (PRA). P values are shown for each graph (ANOVA, k = 3 groups). Each dot represents one rat. *Statistically significant differences are shown.
Fig. 4.
Fig. 4.
Progression of kidney injury in type 2 diabetic nephropathy (T2DN), Goto-Kakizaki (GK), and nondiabetic Wistar rats. A: representative images of kidney tissue stained with Masson’s trichrome (×20 magnification and expanded areas at ×40 magnification). Note tubulointerstitial disease present along with diffuse mesangial sclerosis and diffuse thickening of the capillary walls in the T2DN glomerulus. Scale bars = 100 and 50 µm, respectively. B and C: summary graphs of the medullary protein cast area (percent total kidney area; B) and cortex fibrosis (C) for GK and T2DN rats at 12 and 48 wk (ANOVA, *P < 0.002, k = 6 groups). D: diuresis in T2DN rats at 8, 12, and >48 wk (repeated-measures ANOVA, *P < 0.01). E: albuminuria (urinary albumin normalized to creatinine) in 8-, 12-, and >48-wk-old T2DN and >48-wk-old Wistar and GK rats (*P < 0.01, ANOVA, k = 10). F: blood cholesterol in 12- and 48-wk-old rats (ANOVA, *P < 0.01, T2DN vs. GK or Wistar rats, k = 15). G: plasma blood urea nitrogen (BUN) in 12- and 48-wk-old rats (ANOVA, P < 0.021 for 48-wk-old T2DN vs. GK rats, k = 6). H and I: creatinine clearance [creatinine urine concentration × urine flow)/creatinine serum concentration] (H) and urine osmolarity (I) in >48-wk-old rats (ANOVA, *P < 0.01, T2DN vs. GK or Wistar rats, k = 3). For all data sets, urine samples were collected for 24 h.
Fig. 5.
Fig. 5.
Glomerular damage in Wistar, Goto-Kakizaki (GK), and type 2 diabetic nephropathy (T2DN) rats. A: representative section of Masson’s trichrome-stained kidneys from >48-wk-old GK and T2DN rats. The glomerular damage map (pseudocolor) shown on the right was built from the Mason’s trichrome-stained image using the automatic localized algorithm. The red color on pseudocolor mapping refers to high damage levels, and low or no damage is shown in blue. B–D: glomerular injury score (0–4, where 0 = no damage) assessed by semiquantitative morphometric analysis for 12-wk-old (B) and >48-wk-old (C) Wistar, GK, and T2DN rats. Numbers of glomeruli per score are shown on the y-axes. The percentage of glomeruli within the selected score range defined from cumulative distribution is shown. D: cumulative probability distributions of the obtained glomerular scores in 12-wk-old (top) and >48-wk-old (bottom) Wistar, GK, and T2DN rats shown in B and C, respectively. The plot indicates the probability of a glomerulus having a score within the selected range. The example of how to estimate the glomerular damage percentage on cumulative function was shown for the T2DN (>48 wk) group (red arrows). A Kolmogorov–Smirnov test was used to identify significant differences between the groups [at the level P < 0.001, GK and T2DN (>48 wk) distributions were significantly different].
Fig. 6.
Fig. 6.
Podocyte damage in type 2 diabetic nephropathy (T2DN) rats. A: Western blot analysis of nephrin shedding, a marker of podocyte damage, analyzed from urine (24-h collection) of young and aged Wistar and T2DN rats. The summary graph shows changes in urinary nephrin normalized to creatinine levels (N ≥ 3, ANOVA, k = 6 groups). B: podocin expression in aged (>48-wk-old) Wistar and T2DN glomeruli. Representative images of freshly isolated glomeruli labeled with the podocyte marker podocin (green) are shown. Scale bars = 50 µm. The two-dimensional image is a single section of a z-stack image sequence showing surface podocin and cell nuclei (blue). The three-dimensional projection is a summary of fluorescence intensity from the entire z-stack sequence overlaid with the transmitted light (TL) image projection. The arrows indicate a focal region with almost no podocin in T2DN glomeruli.
Fig. 7.
Fig. 7.
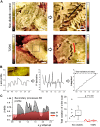
Assessment of the structural changes in podocyte foot processes by scanning ion conductance microscopy (SICM). A: three-dimensional topographic images of nondiabetic (Dahl salt-sensitive) rat and type 2 diabetic nephropathy (T2DN) rat (>48-wk-old) glomeruli obtained by SICM. The super-resolution scans were performed in a selected area of the glomeruli under different magnifications and reveal interdigitated foot processes that enwrap the glomerular capillaries. The scan of a glomerulus isolated from a T2DN rat completely lacks the interdigitated foot processes on the selected region of the glomerular tuft. B: example of quantification of the z-axis profile to evaluate form and variation of the secondary podocyte processes. Total variation (total length of an irregular arc segment curve through the z-axis line scan) represents the variability/density of podocyte foot processes obtained from SICM topography images and was defined by an integral of the first derivative of the z-axis curve on the selected interval. C: line scan z-axis profile examples for the three-dimensional topographical images shown in A. The summary graph revealed significant changes in total z-axes profile variations and indicated severe foot process losses in T2DN animals (N ≥ 3 glomeruli, n = 7 line scans, *P < 0.001, ANOVA).

References

    1. Alicic RZ, Rooney MT, Tuttle KR. Diabetic kidney disease: challenges, progress, and possibilities. Clin J Am Soc Nephrol 12: 2032–2045, 2017. doi:10.2215/CJN.11491116. - DOI - PMC - PubMed
    1. Anguiano L, Andres H. Diabetic kidney disease. What we knew, what we know, and what we still do not know. ASN Kidney News 11: 8–9, 2019.
    1. Antlanger M, Domenig O, Kovarik JJ, Kaltenecker CC, Kopecky C, Poglitsch M, Säemann MD. Molecular remodeling of the renin-angiotensin system after kidney transplantation. J Renin Angiotensin Aldosterone Syst 18: 1470320317705232, 2017. doi:10.1177/1470320317705232. - DOI - PMC - PubMed
    1. Barnett AH, Mithal A, Manassie J, Jones R, Rattunde H, Woerle HJ, Broedl UC; EMPA-REG RENAL trial investigators . Efficacy and safety of empagliflozin added to existing antidiabetes treatment in patients with type 2 diabetes and chronic kidney disease: a randomised, double-blind, placebo-controlled trial. Lancet Diabetes Endocrinol 2: 369–384, 2014. doi:10.1016/S2213-8587(13)70208-0. - DOI - PubMed
    1. Benigni A, Gagliardini E, Tomasoni S, Abbate M, Ruggenenti P, Kalluri R, Remuzzi G. Selective impairment of gene expression and assembly of nephrin in human diabetic nephropathy. Kidney Int 65: 2193–2200, 2004. doi:10.1111/j.1523-1755.2004.00636.x. - DOI - PubMed

Publication types

MeSH terms