. 2019 Nov 1;317(5):F1359-F1374.
doi: 10.1152/ajprenal.00566.2018. Epub 2019 Sep 30.

O-GlcNAcylation and phosphorylation of β-actin Ser199 in diabetic nephropathy

Affiliations

O-GlcNAcylation and phosphorylation of β-actin Ser199 in diabetic nephropathy

Yoshihiro Akimoto et al. Am J Physiol Renal Physiol. .

Abstract

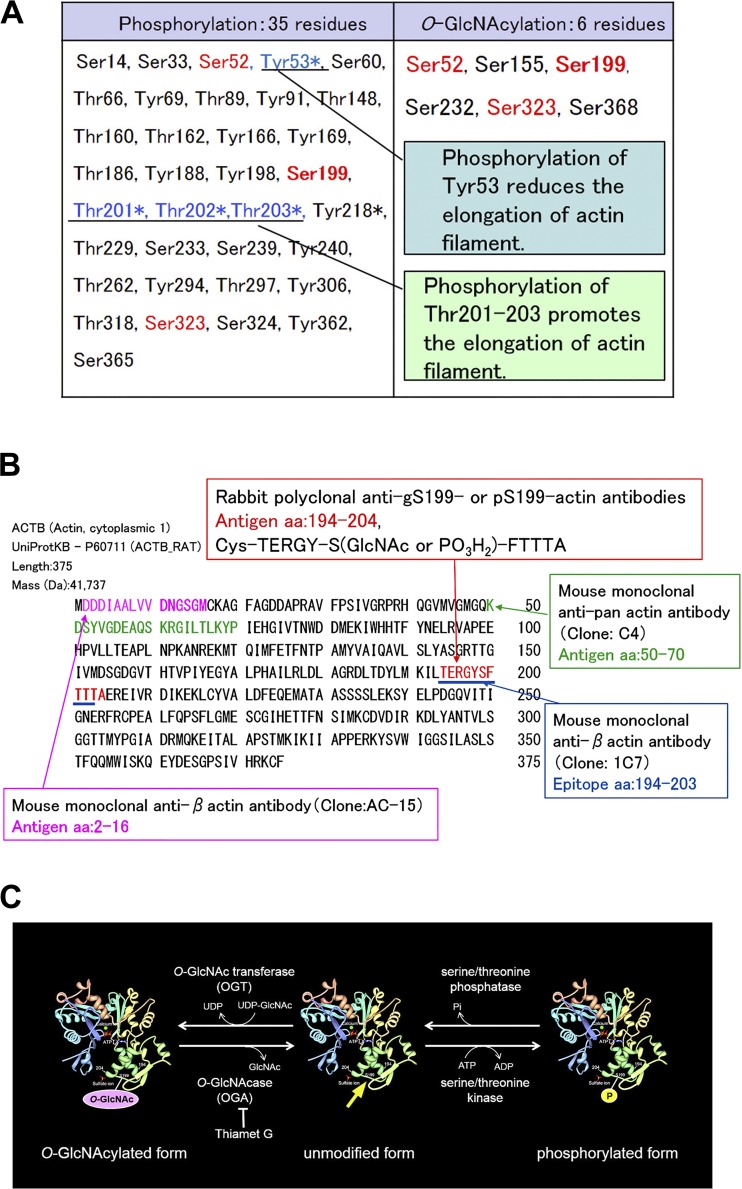
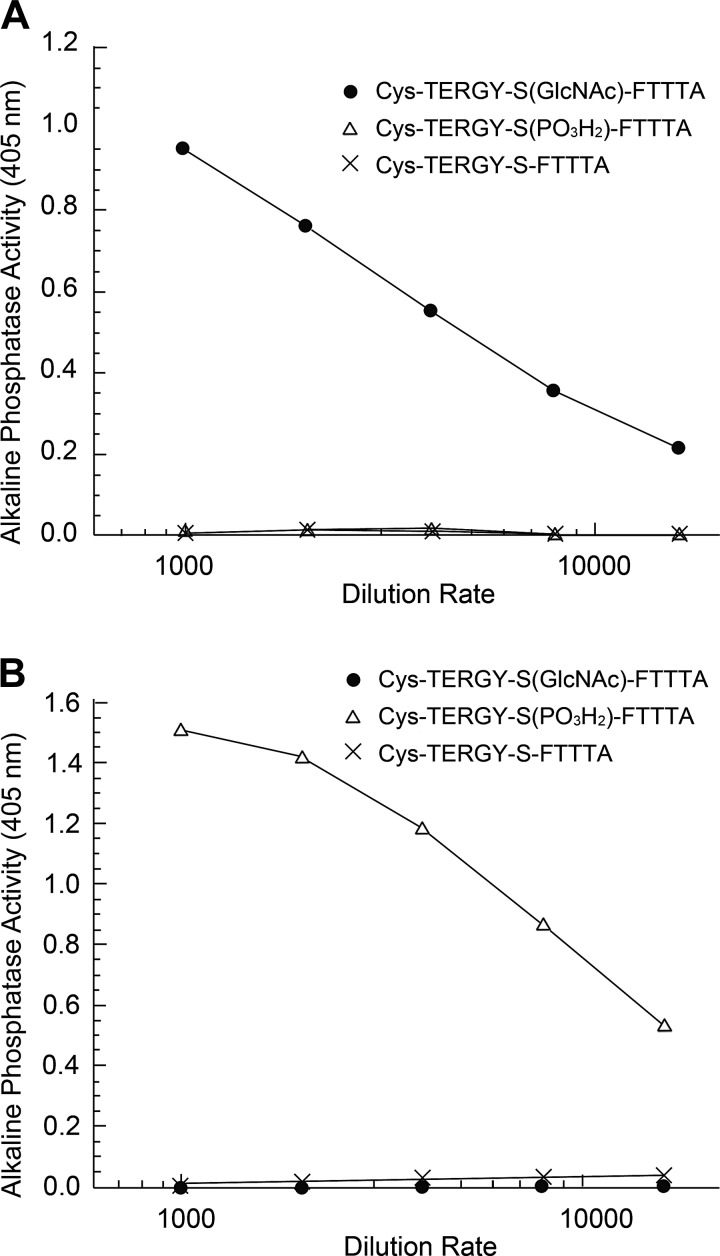
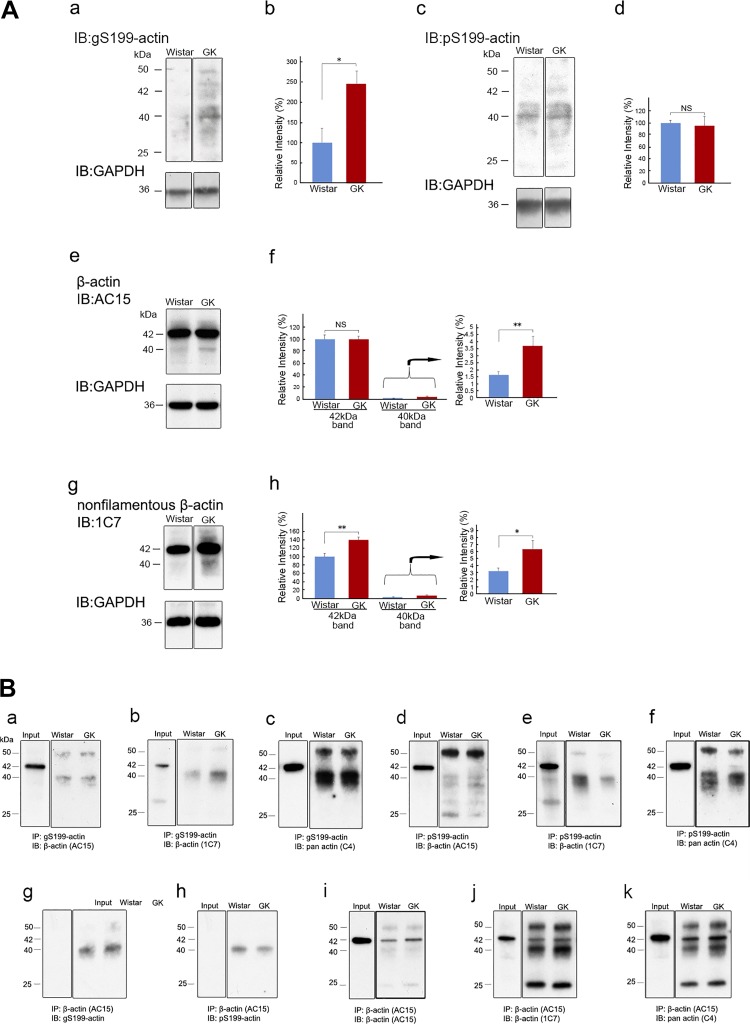
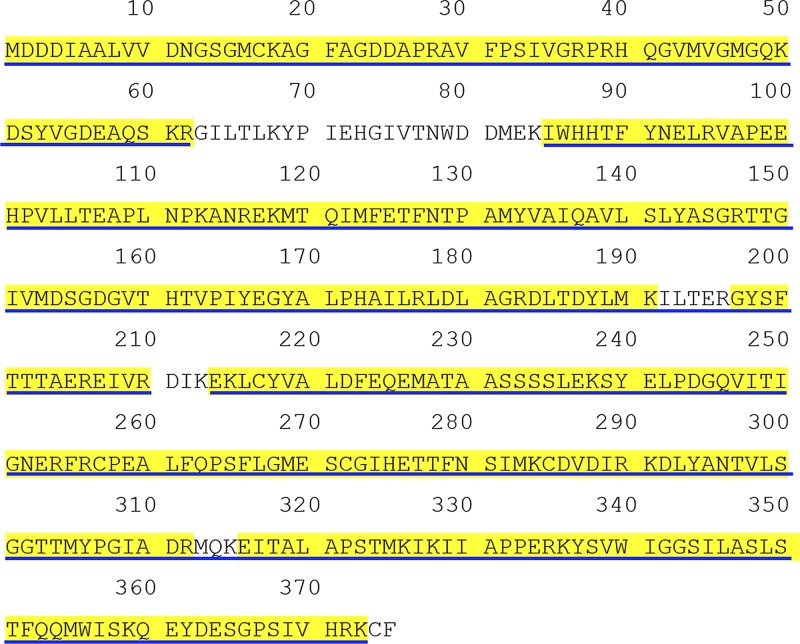
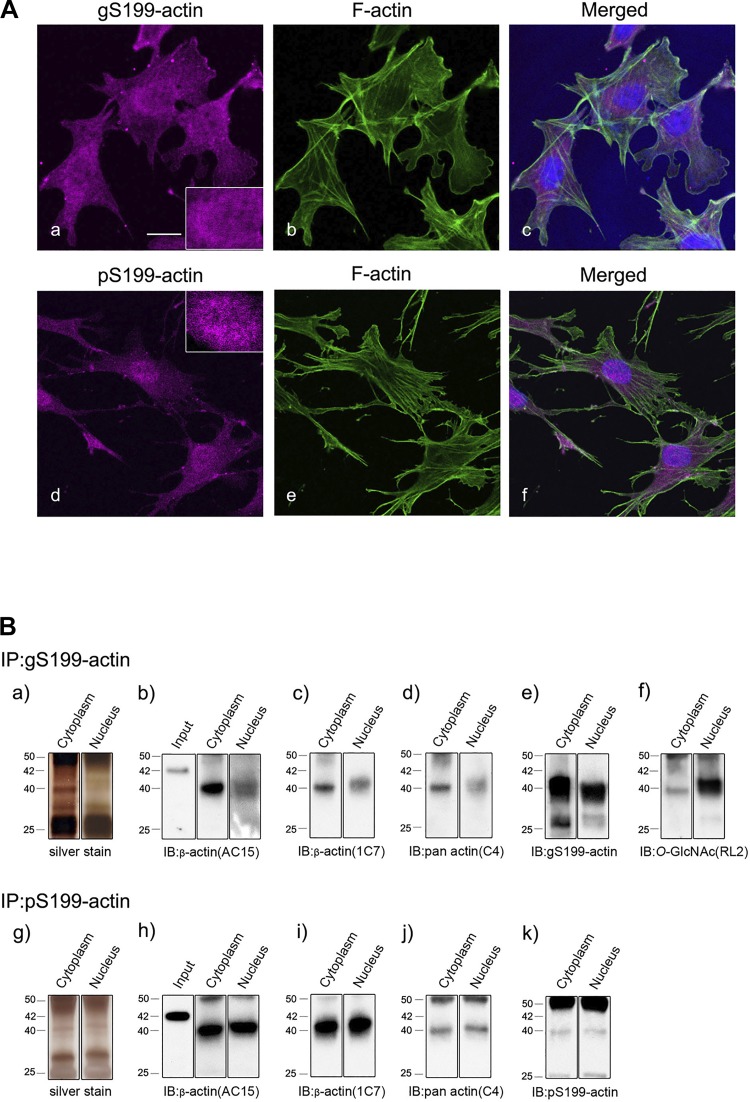
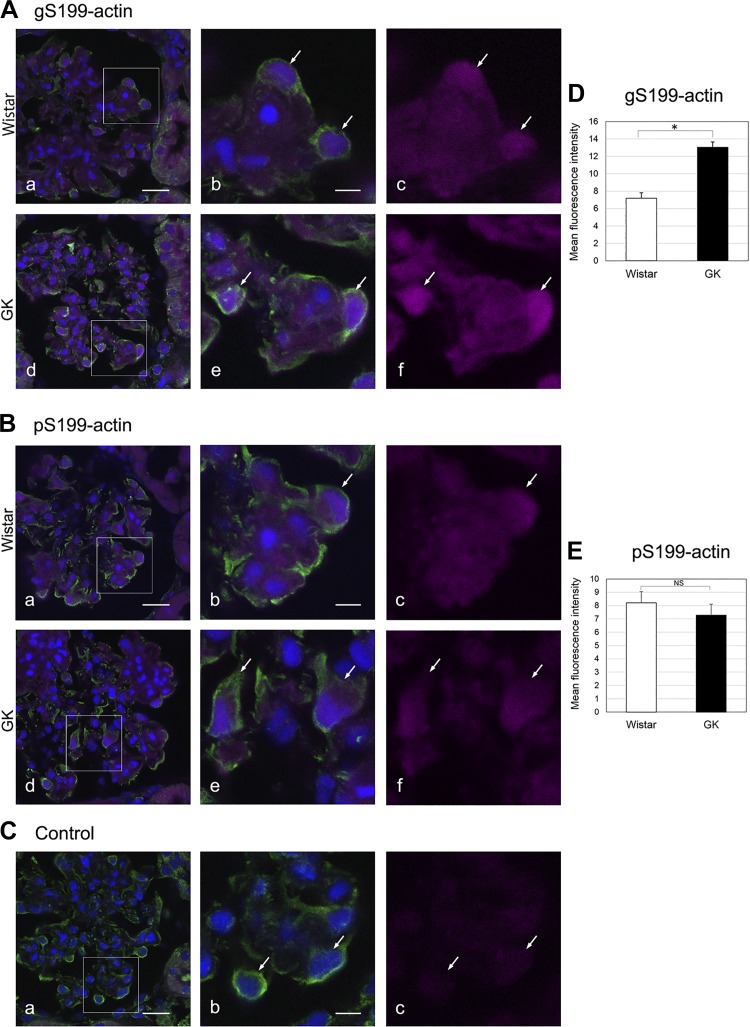
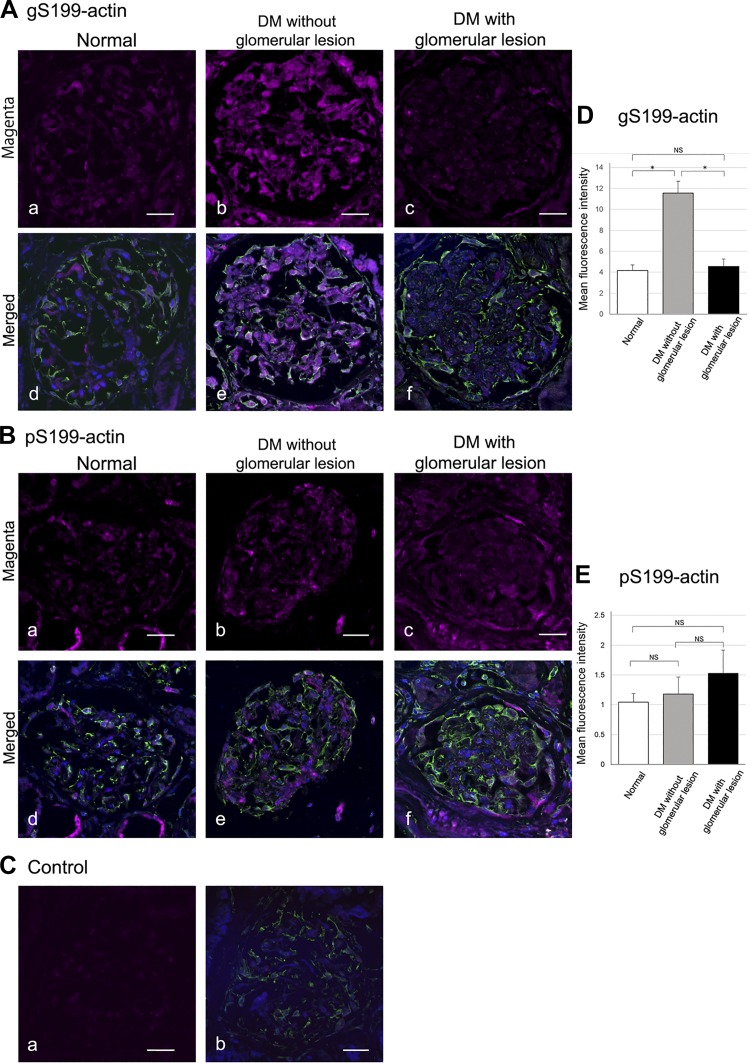
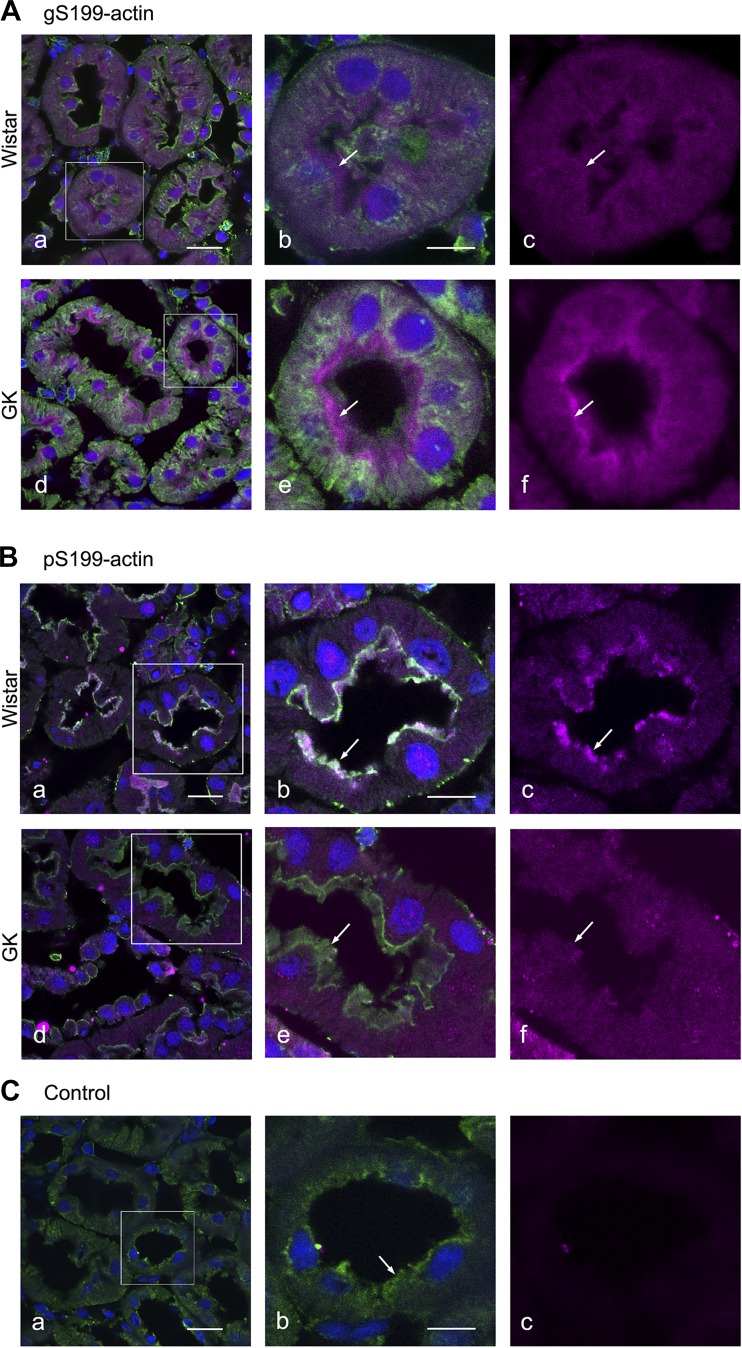
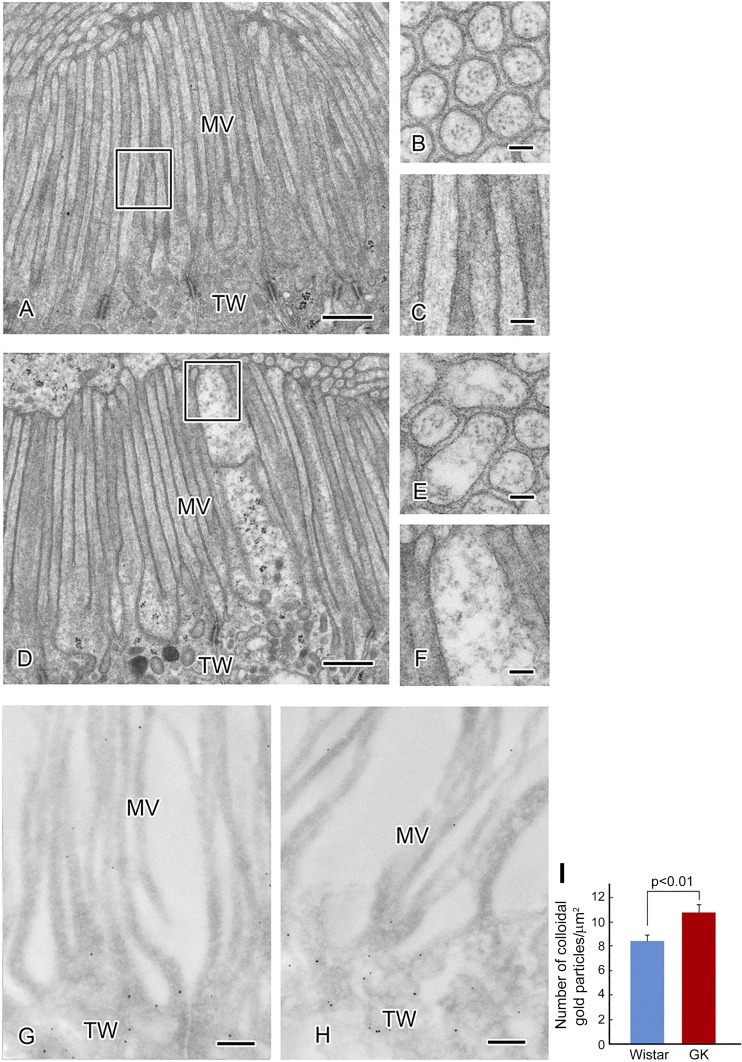
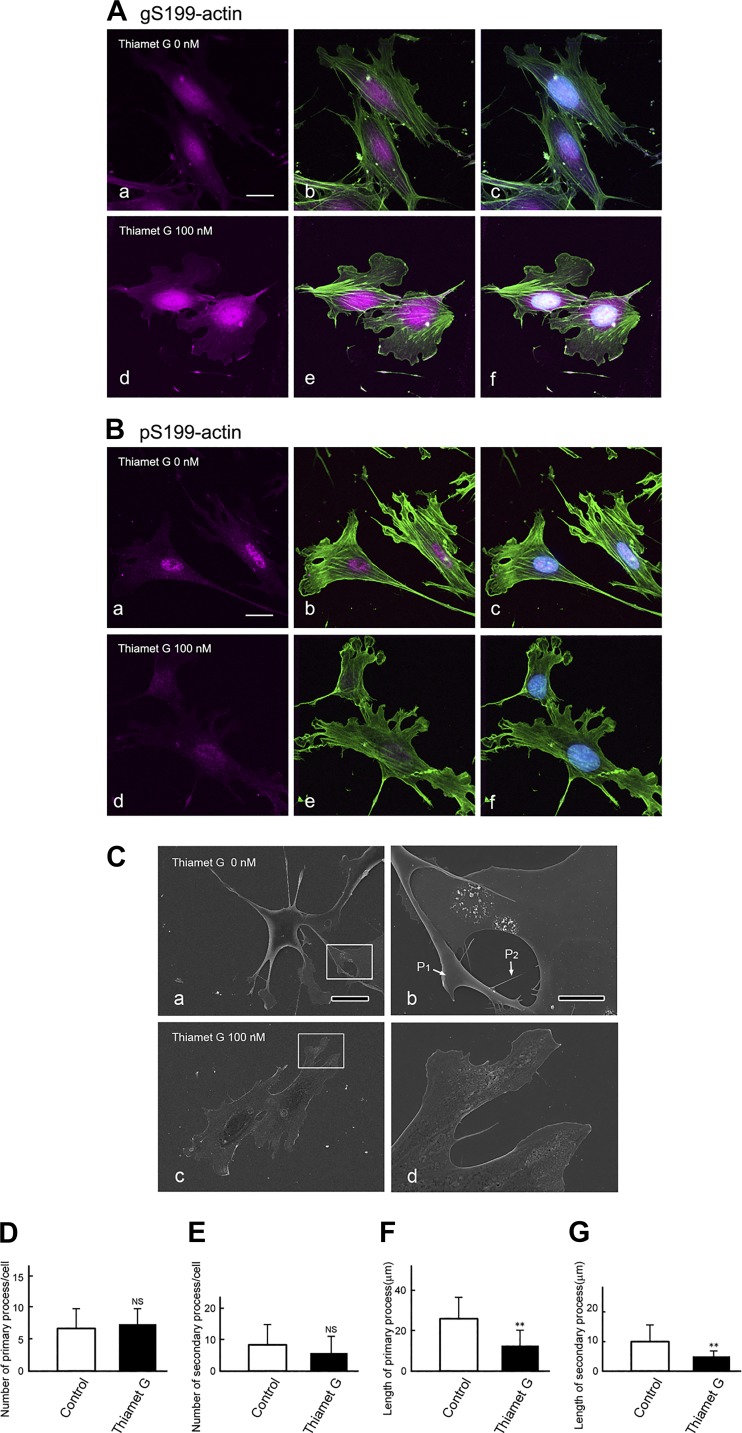
The function of actin is regulated by various posttranslational modifications. We have previously shown that in the kidneys of nonobese type 2 diabetes model Goto-Kakizaki rats, increased O-GlcNAcylation of β-actin protein is observed. It has also been reported that both O-GlcNAcylation and phosphorylation occur on Ser199 of β-actin. However, their roles are not known. To elucidate their roles in diabetic nephropathy, we examined the rat kidney for changes in O-GlcNAcylation of Ser199 (gS199)-actin and in the phosphorylation of Ser199 (pS199)-actin. Both gS199- and pS199-actin molecules had an apparent molecular weight of 40 kDa and were localized as nonfilamentous actin in both the cytoplasm and nucleus. Compared with the normal kidney, the immunostaining intensity of gS199-actin increased in podocytes of the glomeruli and in proximal tubules of the diabetic kidney, whereas that of pS199-actin did not change in podocytes but decreased in proximal tubules. We confirmed that the same results could be observed in the glomeruli of the human diabetic kidney. In podocytes of glomeruli cultured in the presence of the O-GlcNAcase inhibitor Thiamet G, increased O-GlcNAcylation was accompanied by a concomitant decrease in the amount of filamentous actin and in morphological changes. Our present results demonstrate that dysregulation of O-GlcNAcylation and phosphorylation of Ser199 occurred in diabetes, which may contribute partially to the causes of the morphological changes in the glomeruli and tubules. gS199- and pS199-actin will thus be useful for the pathological evaluation of diabetic nephropathy.

Keywords: Goto-Kakizaki rat; O-GlcNAcylation; diabetic nephropathy; phosphorylation and dephosphorylation; β-actin.


Conflict of interest statement

No conflicts of interest, financial or otherwise, are declared by the authors.

Figures

Fig. 1.
Fig. 1.
A: phosphorylation sites and O-GlcNAcylation sites in β-actin. In the amino acid sequence of β-actin, six serine residues are O-GlcNAcylated. Of them, three serine residues (Ser52, Ser199, and Ser323) are also phosphorylated. Tyr53, Thr201, Thr202, and Thr203 are important amino acid residues for actin polymerization, which is conserved in all species. Phosphorylation of Thr201–203, which neighbor Ser199, promotes the elongation of actin filaments (12, 14), whereas phosphorylation of Tyr53, next to Ser52, reduces the elongation of actin filaments (30). *Known functionally important modification. B: amino acid sequences of polypeptides used as the immunogen to raise the antibodies. C: molecular images of β-actin. The schematic indicates the relationship between O-GlcNAcylation of Ser199-actin, unmodified β-actin, and phosphorylation of Ser199-actin. The yellow arrow indicates the site where the amino acid sequence used as the immunogen is located in the molecule.
Fig. 2.
Fig. 2.
ELISA analysis. Flat-bottomed 96-well plates were coated with synthesized peptides [Cys-TERGY-S(GlcNAc)-FTTTA (●), Cys-TERGY-S(PO3H2)-FTTTA (△), or and Cys-TERGY-S-FTTTA (×)]. Peptide-coated plates were blocked by incubation with casein blocking buffer and then incubated either with affinity-purified anti-O-GlcNAcylation of Ser199 (gS199)-actin peptide antibody or with anti-phosphorylation of Ser199 (pS199)-actin peptide antibody. Antibody binding was detected by incubation with alkaline phosphatase-conjugated goat anti-rabbit IgG. The chromogen development was mediated by the addition of substrate solution (p-nitrophenyl phosphate). Optical density was measured at 405 nm. The results of the ELISA assay showed that gS199-actin antibody reacted with neither unmodified Ser199-actin peptide nor pS199-actin peptide but did react specifically with gS199-actin peptide (A) and that pS199-actin antibody reacted with neither unmodified Ser199-actin peptide nor gS199-actin peptide but reacted specifically with pS199-actin peptide (B).
Fig. 3.
Fig. 3.
A: immunoblot (IB) analysis of β-actin from normal Wistar and diabetic Goto-Kakizaki (GK) rat kidneys. Total kidney proteins were immunoblotted with anti-O-GlcNAcylation of Ser199(gS199)-actin antibody (a), anti-phosphorylated Ser199 (pS199)-actin antibody (c), AC15 anti-β-actin antibody (e), or 1C7 anti-nonfilamentous β-actin antibody (g). PVDF membranes in a, c, e, and g (top) were stripped and reprobed with the loading control, anti-GAPDH antibody (a, c, e, and g, bottom). Quantification of 40- and 42-kDa band densities was determined by the ratio of band density to that of the loading control (b, d, f, and h). Relative intensities of bands versus control 40-kDa band for Wistar rats were determined. Data are means ± SE from 5 (b and d) or 6 (f and h) different rats. The bands were cut from the same gel films. *P < 0.05 and **P < 0.01 vs. control Wistar rat. B: immunoprecipitation (IP) analysis of gS199-actin and pS199-actin from normal Wistar and diabetic GK rat kidneys. Total kidney proteins were immunoprecipitated with anti-gS199-actin antibody (ac), anti-pS199-actin antibody (df), or AC15 anti-β-actin antibody (gk). IB analysis using AC15 anti-β-actin antibody (a, d, and i), 1C7 anti-nonfilamentous β-actin antibody (b, e, and j), C4 anti-pan-actin antibody (c, f, and k), anti-gS199-actin antibody (g), and anti-pS199-actin antibody (h) were performed. The 40-kDa band was detected in all cases, whereas the 42-kDa band was detected in the input lane using AC15 (a, d, and i), 1C7 (b, e, and j), or C4 (c, f, and k) and in the lanes immunoprecipitated with AC15 (ik). However, the 42-kDa band was not detected, and only the 40-kDa band was detected in the lanes using AC15 for IP and anti-gS199-actin antibody or anti-pS199-actin antibody for IB analysis (g, h). The 25-kDa band was IgG light chain, and the 50-kDa band was IgG heavy chain. The bands in the input were cut from the same gel films.
Fig. 4.
Fig. 4.
Comparison of amino acid sequence coverage between 42- and 40-kDa β-actin. The sequence of β-actin is shown (https://www.uniprot.org/uniprot/P60711). Blue underlined and yellow highlighted characters represent the identified peptide sequences from the respective 42- and 40-kDa bands, which were excised from SDS-PAGE gels of the immunoprecipitate obtained with AC15. The false discovery rate confidence was <0.01. Coverage rates of 42- and 40-kDa β-actin were 92.80% and 89.87%, respectively.
Fig. 5.
Fig. 5.
A: immunofluorescent images of O-GlcNAcylation of Ser199(gS199)-actin (a) and phosphorylated Ser199 (pS199)-actin (d) in cultured immortalized glomerular epithelial cell podocytes. gS199-actin immunostaining (magenta color) was diffuse in both the nucleus and cytoplasm of cultured podocytes (a). pS199-actin immunostaining (magenta color) was observed to be intense in the nucleus and weak in the cytoplasm of cultured podocytes (d). Filamentous actin (stress fiber, green color) stained with Alexa 488-phalloidin was observed in the cytoplasm (b and e). Insets in a and d show enlarged nuclei. gS199-actin localization was diffuse in the nucleus, whereas that of pS199-actin was punctate there. Merged images of magenta, green, and blue color are shown in c and f. Blue color indicates nuclei stained with TO-PRO3. Scale bar = 10 μm. B: immunoprecipitation (IP) analysis of gS199-actin and pS199-actin from cultured podocytes. Cytoplasmic and nuclear proteins were immunoprecipitated with anti-gS199-actin antibody (af) or anti-pS199-actin antibody (gk). Silver-stained SDS-PAGE gel images are shown in a and g. Immunoblot (IB) analysis using AC15 anti-β-actin antibody (b and h), 1C7 anti-nonfilamentous β-actin antibody (c and i), C4 anti-pan-actin antibody (d and j), anti-gS199-actin antibody (e), anti-pS199-actin antibody (k), and RL2 anti-O-GlcNAc antibody (f) was performed. The 40-kDa band was detected in both the cytoplasm and nucleus in all cases (bf and hk), whereas the 42-kDa band was scarcely detected except in the input lanes using AC15 (b and h). For the input lanes, Wistar rat samples were loaded.
Fig. 6.
Fig. 6.
Immunofluorescent images of O-GlcNAcylation of Ser199(gS199)-actin (A) and phosphorylated Ser199 (pS199)-actin (B) in the glomerulus of Wistar and Goto-Kakizaki (GK) rat kidneys. The rectangular areas in a and d are enlarged in b and e, respectively. c and f: Immunostained gS199-actin and pS199-actin (magenta color) were found to be diffuse in the glomerulus of the normal Wistar kidney and diabetic GK kidney. Vimentin (green color) was stained as a marker of podocytes (arrows) with Alexa 488-secondary antibody. C: cytochemical control images. c: Normal rabbit IgG showed no reactivity toward kidney sections. D and E: graphical quantification of gS199-actin (D) and pS199-actin (E) immunoreactivities in podocytes of Wistar and GK rat kidneys. Nuclei (blue color) were stained with TO-PRO3. Data are means ± SE from 5 different rats. *P < 0.05. Scale bars = 20 μm in a and 10 μm in b. NS, nonsignificant.
Fig. 7.
Fig. 7.
A and B: immunofluorescent images of O-GlcNAcylation of Ser199(gS199)-actin and phosphorylated Ser199 (pS199)-actin in the glomerulus of a normal human kidney (a and d), diabetes mellitus (DM) without glomerular lesions (b and e), and DM with glomerular lesions (c and f). Vimentin (green color) was stained as a marker of podocytes (arrows) with Alexa 488-secondary antibody. Immunostained gS199-actin (magenta color) was found to be diffuse and weak in the normal glomerulus (A, a and d), whereas in the diabetic glomerulus without lesions the immunostaining was significantly increased in intensity (A, b and e). The immunostaining intensity of pS199-actin in the diabetic glomerulus was observed to be at almost the same level as that found for the normal glomerulus (B, af). C: cytochemical control images. a: Normal rabbit IgG showed no reactivity toward kidney sections. b: Merged image of normal rabbit IgG (magenta color) and vimentin (green color). D and E: graphical quantification of gS199-actin and pS199-actin immunoreactivities in the podocytes of the glomerulus of normal (white bar), DM without glomerular lesions (gray bar), and DM with glomerular lesions (black bar). Nuclei (blue color) were stained with TO-PRO3. Data are means ± SE from 12 normal control glomeruli, 16 diabetic glomeruli without lesions, and 14 diabetic glomeruli with lesions. *P < 0.05. Scale bars = 20 μm. NS, nonsignificant.
Fig. 8.
Fig. 8.
A: ultrastructural changes in the glomerulus of the diabetic rat kidney. a−d: Scanning electron microscopy of the glomerulus of the normal Wistar rat kidney (a and c) and diabetic Goto-Kakizaki (GK) rat kidney (b and d). c and d are enlargements of the rectangular areas in a and b, respectively. Foot processes (FP) of podocytes are regularly arranged in the normal kidney (c) but irregularly arranged in the diabetic kidney (d). Furthermore, many long and thin filopodia of podocytes were found in the diabetic kidney (d), whereas few filopodia were found in the normal kidney (c). Scale bars = 20 μm in a and b and 1 μm in c and d. B: immunoelectron microscopy of β-actin in the glomerulus and proximal tubule of normal (a and c) and diabetic (b and d) kidneys performed with AC15 anti-β-actin antibody by the 10-nm colloidal gold immunolabelling postembedding method. In the glomerular capillary wall, colloidal gold particles are localized in both FPs of podocytes and in endothelial cells (En) (a and b). In the proximal tubule, the particles were found in both the microvilli (MV) and terminal web (TW) (c and d). There was no difference in their distribution between normal and diabetic kidneys. Scale bars = 200 nm. GBM, glomerular basement membrane.
Fig. 9.
Fig. 9.
A and B: ultrastructural changes in the capillary wall of the glomerulus in the diabetic kidney (B) compared with that in the normal kidney (A). Immunoelectron microscopy of glomerular O-GlcNAcylation of Ser199(gS199)-actin using 10-nm colloidal gold labeling is shown. C and D: localization of gS199-actin in the capillary wall of the glomerulus from the normal kidney (C) and diabetic kidney (D). G: colloidal gold immunolabelling density of gS199-actin was significantly increased in the foot process (FP) of the diabetic podocyte. E and F: localization of gS199-actin in the cell body of a podocyte from a normal kidney (E) and diabetic kidney (F). Dotted lines indicate the boundary between the cytoplasm (Cy) and nucleus (Nu). Colloidal gold labeling was seen in both the cytoplasm and nucleus. H: colloidal gold immunolabelling density of gS199-actin was significantly increased in both the cytoplasm and nucleus of podocytes in the diabetic kidney. Scale bars = 500 nm in A and B and 200 nm in CF. En, endothelial cells; GBM, glomerular basement membrane; GK, Goto-Kakizaki.
Fig. 10.
Fig. 10.
Immunofluorescent images of O-GlcNAcylation of Ser199(gS199)-actin (A) and phosphorylated Ser199 (pS199)-actin (B) in the proximal tubule of normal Wistar (ac) and diabetic Goto-Kakizaki (GK) (df) kidneys. Immunostaining of gS199-actin and pS199-actin (magenta color) was intense in the brush border but diffuse in the cytoplasm and nucleus. Filamentous actin (green color) was stained with Alexa 488-phalloidin. The rectangular areas in a and d are enlarged in b and e, respectively. Nuclei (blue color) were stained with TO-PRO3. C: cytochemical control images. The rectangular area in a is enlarged in b. c: Normal rabbit IgG showed no reactivity toward kidney sections. Scale bars = 20 μm in a and 10 μm in b.
Fig. 11.
Fig. 11.
A−F: ultrastructural changes in the microvilli (MV) of the proximal tubule in the diabetic kidney (DF) compared with the normal kidney (AC). In the brush border, the structure of the microvilli is maintained by actin filaments. Cross sections (B and E) and longitudinal sections (C and F) of microvilli are shown. A regular arrangement of actin filaments along microvilli was seen in the normal proximal tubule. Swollen microvilli and irregularly arranged actin filaments were observed in the diabetic tubule. Immunoelectron microscopy of O-GlcNAcylation of Ser199(gS199)-actin in the proximal tubule is shown. gS199-actin immunolabelling was moderate in the terminal web (TW) and faint in the microvilli of the proximal tubule in both normal (G) and diabetic (H) kidneys. Colloidal gold immunolabelling density of gS199-actin was significantly increased in the terminal web of the diabetic proximal tubule (I). Scale bars = 500 nm in A and D, 50 nm in B and E, 100 nm in C and F, and 200 nm in G and H. GK, Goto-Kakizaki..
Fig. 12.
Fig. 12.
A and B: immunofluorescent images of O-GlcNAcylation of Ser199(gS199)-actin and phosphorylated Ser199 (pS199)-actin in immortalized podocytes cultured without (ac) or with (df) the O-GlcNAcase (OGA) inhibitor Thiamet G used at 100 nM. A and B, a and d: single exposure images (magenta color) of gS199-actin (A, a and d) and pS199-actin (B, a and d), respectively. A and B, b and e: double exposure images of a and d with F-actin (green color). A and B, c and f: triple exposure images of b and e with nuclei (blue color). The fluorescence intensity of gS199-actin was increased in cells in the presence of Thiamet G, whereas that of pS199-actin was decreased in cells treated with Thiamet G. Nuclei (blue color) were stained with TO-PRO3. Scale bars = 10 μm. C: scanning electron microscopic images of immortalized podocytes cultured with (c and d) or without (a and b) the OGA inhibitor Thiamet G used at 100 nM. Rectangular areas in a and c are enlarged in b and d, respectively. In podocytes cultured without Thiamet G, long primary processes (P1) and secondary processes (P2) were seen (a and b), whereas in those cultured with Thiamet G, the secondary processes were poorly developed (c and d). D and E: numbers of primary and secondary processes per cell cultured with (black bars) or without (control; white bars) Thiamet G were counted. F and G: length of primary and secondary processes cultured with (black bars) or without (control; white bars) Thiamet G were measured on ×1,000 single exposure images. Graphs show that podocytes cultured with Thiamet G showed a significant decrease in the length of both primary and secondary processes (F and G), whereas they had almost the same number of these processes as the cells cultured without Thiamet G (D and E). Data are means ± SD. **P < 0.01. Scale bars = 20 μm in A and 5 μm in B. NS, nonsignificant.

References

    1. Akimoto Y, Hart GW, Wells L, Vosseller K, Yamamoto K, Munetomo E, Ohara-Imaizumi M, Nishiwaki C, Nagamatsu S, Hirano H, Kawakami H. Elevation of the post-translational modification of proteins by O-linked N-acetylglucosamine leads to deterioration of the glucose-stimulated insulin secretion in the pancreas of diabetic Goto-Kakizaki rats. Glycobiology 17: 127–140, 2007. doi: 10.1093/glycob/cwl067. - DOI - PubMed
    1. Akimoto Y, Miura Y, Toda T, Wolfert MA, Wells L, Boons G-J, Hart GW, Endo T, Kawakami H. Morphological changes in diabetic kidney are associated with increased O-GlcNAcylation of cytoskeletal proteins including α-actinin 4. Clin Proteomics 8: 15, 2011. doi: 10.1186/1559-0275-8-15. - DOI - PMC - PubMed
    1. Akimoto Y, Yamamoto K, Munetomo E, Wells L, Vosseller K, Hart GW, Kawakami H, Hirano H. Elevated post-translational modification of proteins by O-linked N-acetylglucosamine in various tissues of diabetic Goto-Kakizaki rats accompanied by diabetic complications. Acta Histochem Cytochem 38: 131–142, 2005. doi: 10.1267/ahc.38.131. - DOI
    1. Banerjee PS, Lagerlöf O, Hart GW. Roles of O-GlcNAc in chronic diseases of aging. Mol Aspects Med 51: 1–15, 2016. doi: 10.1016/j.mam.2016.05.005. - DOI - PubMed
    1. Bertling E, Englund J, Minkeviciene R, Koskinen M, Segerstråle M, Castrén E, Taira T, Hotulainen P. Actin tyrosine-53-phosphorylation in neuronal maturation and synaptic plasticity. J Neurosci 36: 5299–5313, 2016. doi: 10.1523/JNEUROSCI.2649-15.2016. - DOI - PMC - PubMed

Publication types