. 2019 Sep 30:8:e50634.
doi: 10.7554/eLife.50634.

Allosteric activation of the nitric oxide receptor soluble guanylate cyclase mapped by cryo-electron microscopy

Affiliations

Allosteric activation of the nitric oxide receptor soluble guanylate cyclase mapped by cryo-electron microscopy

Benjamin G Horst et al. Elife. .

Abstract

Soluble guanylate cyclase (sGC) is the primary receptor for nitric oxide (NO) in mammalian nitric oxide signaling. We determined structures of full-length Manduca sexta sGC in both inactive and active states using cryo-electron microscopy. NO and the sGC-specific stimulator YC-1 induce a 71° rotation of the heme-binding β H-NOX and PAS domains. Repositioning of the β H-NOX domain leads to a straightening of the coiled-coil domains, which, in turn, use the motion to move the catalytic domains into an active conformation. YC-1 binds directly between the β H-NOX domain and the two CC domains. The structural elongation of the particle observed in cryo-EM was corroborated in solution using small angle X-ray scattering (SAXS). These structures delineate the endpoints of the allosteric transition responsible for the major cyclic GMP-dependent physiological effects of NO.

Keywords: CryoEM; SAXS; allostery; biochemistry; chemical biology; cyclic GMP; manduca sexta; nitric oxide; none.


Conflict of interest statement

BH, AY, DR, KM, MH, JH No competing interests declared, MM Reviewing editor, eLife

Figures

Figure 1.
Figure 1.. Domain arrangement and activation of Manduca sexta (Ms) soluble guanylyl cyclase (sGC).
(a) Schematic representation of the Ms sGC heterodimer domain architecture. sGCs contain four domains: a heme nitric oxide/oxygen (H-NOX) binding domain, a Per/Arnt/Sim (PAS)-like domain, a coiled-coil (CC) domain, and a catalytic cyclase domain (CAT). The heme binding site in β H-NOX is represented by the gray quadrilateral. (b) UV–visible absorption spectra of Ms sGC in the unliganded (U), NO-bound, and CO-bound states. The wavelength maxima of the Soret peaks are indicated. Inset: Q bands show increased splitting upon gas binding. (c) Discontinuous cGMP activity assay for Ms sGC with various activation conditions: 1-NO, xsNO, and YC-1 ligands. Initial rates were taken from assays run at 25°C, pH 7.5 with 2 mM Mg•GTP as the substrate (see Figure 1—figure supplement 1b). cGMP formation was measured using an enzyme linked immunosorbent assay. The average initial rate is plotted, and the error bars reflect one standard deviation (n = 4).
Figure 1—figure supplement 1.
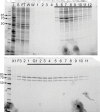
Figure 1—figure supplement 1.. Representative SDS-PAGE gels for purification of Ms sGC.
Figure 1—figure supplement 2.
Figure 1—figure supplement 2.. Deconvoluted intact protein mass spectrum of purified Ms sGC.
Figure 1—figure supplement 3.
Figure 1—figure supplement 3.. UV–visible absorption spectra of Ms sGC used in activity assays.
The 1-NO sample was generated by first adding excess NO followed by buffer exchange.
Figure 1—figure supplement 4.
Figure 1—figure supplement 4.. Representative time courses of the cGMP assay for Ms sGC in different ligation states.
The cGMP product was quantified using an enzyme linked immunosorbent assay.
Figure 1—figure supplement 5.
Figure 1—figure supplement 5.. Topology diagram of β H-NOX secondary structure.
Bottom Left: Front view of the β H-NOX displaying helices αA–αF. Bottom Right: Bottom view of the β H-NOX displaying helix αG and sheets β1–β4.
Figure 2.
Figure 2.. Inactive Ms sGC forms a bent coiled-coil structure.
(a) Views of cryo-EM density for the inactive state, colored by subunit (α - orange, β - blue). Dimensions of the complex are shown in black. The two lobes of the enzyme are denoted ‘regulatory’ and ‘catalytic’. (b) Molecular model of Ms sGC with domains labeled and colored as in Figure 1a. The heme is colored gray. (c) Two views of the β H-NOX domain with heme shown in gray and H105 in red (d) View of the bent coiled-coil (purple) and PAS linker (green) shown in shades for the α (dark) and β (light) dimer. Closeup shows connective density between the PAS and CC domains (threshold 12σ). The sequences of the bent CC domains are shown below. (e) View of the inactive catalytic dimer fit into density (α - orange, β - blue). Close up shows aligned active adenylyl cyclase (α CAT domain) and nucleotide in gray (PDB: 1CJK) compared with the inactive sGC model. The distance between the substrate analogue and nearest backbone Cα (β N538) is shown.
Figure 2—figure supplement 1.
Figure 2—figure supplement 1.. Representative micrograph with inlet of corresponding FFT.
Figure 2—figure supplement 2.
Figure 2—figure supplement 2.. Electron microscopy flowchart for processing of inactive.
sGC data with three views of the final reconstruction shown colored in gray.
Figure 2—figure supplement 3.
Figure 2—figure supplement 3.. Selected 2D class averages.
Figure 2—figure supplement 4.
Figure 2—figure supplement 4.. FSC curve from cryosparc2 with gold standard 0.143 FSC shown in blue.
Figure 2—figure supplement 5.
Figure 2—figure supplement 5.. Plot of single particle population based on orientation parameters.
Figure 2—figure supplement 6.
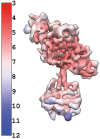
Figure 2—figure supplement 6.. Inactive reconstruction colored by local resolution calculated using cryosaprc2 implementation of blocres.
Figure 2—figure supplement 7.
Figure 2—figure supplement 7.. Closeup view of the modeled inactive.
CAT dimer highlighting unmodeled density near the α CAT C-terminus.
Figure 2—figure supplement 8.
Figure 2—figure supplement 8.. The coiled-coil domain of eight sequences from four heterodimeric biochemically verified NO-responsive sGCs and five sequences from atypical sGCs that sense O2 are aligned, with conserved residues are highlighted in blue.
The approximate domain architecture from the inactive state CC domains are shown above the sequences.
Figure 2—figure supplement 9.
Figure 2—figure supplement 9.. Overlay of the PDB: 4NI2 (gray) and the inactive CAT dimer (colored by α and β).
Figure 2—figure supplement 10.
Figure 2—figure supplement 10.. Inactive model of Ms sGC is shown with the bent helix in purple and the S-helix in red.
Figure 3.
Figure 3.. Active Ms sGC forms an elongated structure.
(a) Views of cryo-EM density for the active state, colored by subunit (α - orange, β - blue). Dimensions of the complex are shown in black. (b) Molecular model of Ms sGC colored as in Figure 1a. The heme is colored gray. The α H-NOX domain is not shown due to lack of density. (c) View of the β H-NOX domain with heme shown in gray and β H105 in red. Two fits for the stimulator, YC-1, are shown in purple (d) Model of the extended coiled-coil region (purple), highlighting the PAS linker region (green) shown in shades for the α (dark) and β (light) dime. The sequences of the bent CC region are shown below. (e) View of active catalytic dimer (α - orange, β - blue) shown fit into the reconstruction density. Closeup shows aligned active adenylate cyclase structure (PDB: 1CJK) with bound nucleotide (gray). The distance between the substrate analogue and Cα of the β N538 is shown.
Figure 3—figure supplement 1.
Figure 3—figure supplement 1.. Representative micrograph with inlet of corresponding FFT.
Figure 3—figure supplement 2.
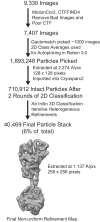
Figure 3—figure supplement 2.. Electron microscopy flowchart for processing of active sGC data.
Figure 3—figure supplement 3.
Figure 3—figure supplement 3.. Selected 2D class averages.
Figure 3—figure supplement 4.
Figure 3—figure supplement 4.. FSC curve from cryosparc2 with gold standard 0.143 FSC shown in blue.
Figure 3—figure supplement 5.
Figure 3—figure supplement 5.. Plot of single particle population based on orientation parameters.
Figure 3—figure supplement 6.
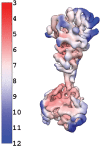
Figure 3—figure supplement 6.. Active reconstruction colored by local resolution calculated using cryosaprc2 implementation of blocres.
Figure 3—figure supplement 7.
Figure 3—figure supplement 7.. Differential H/D Exchange values representing change in percent D by subtracting the active state from the inactive state.
Regions with large changes in percent D overlay with secondary structural elements observed in the structures to undergo large conformational changes, including the αF helix of the β H-NOX, the bent CC region, and S-helix motif, and certain helices of the CAT domain. The insets show a closeup view of the H/D exchange patters of the CC domains.
Figure 4.
Figure 4.. Conformational rearrangements of Ms sGC upon activation.
(a) Overlay of the inactive (transparent, gray) and active (α - orange, β – blue) shown in two views. Rotation of the regulatory domain and CAT dimer are shown with arrows and label with degree of rotation. Distances between the β Η-NOX domain and CAT dimer are labeled for inactive (gray) and active (black). (b) Close up view of the inactive interfaces between the β HNOX (green), β PAS (red), and α CC (blue). (c) Closeup view of the active interfaces colored as in Figure 4b with the β H-NOX:β CC interface in purple. (d) Overlay of the inactive (transparent) and active (colored) CC domains when aligned to the active α CC domain. Dimensions of the CC and rotation are labeled in color for the inactive and black for the active. (e) Three views of aligned inactive (transparent) and active (colored) CAT dimers are shown. Direction of rotation (curved arrows) and pinching (arrows) are shown.
Figure 5.
Figure 5.. SAXS analysis of the activation of sGC.
(a) Normalized P(r) for the unliganded (black) and 1-NO (gray) states of sGC are shown together with corresponding models of the inactive and partially extended conformations of sGC (N-terminal and C-terminal tails are omitted for clarity). The area of each P(r) is normalized relative to the SAXS-determined molecular weights (Supplementary file 2 - Table 2). (b) Experimental (black and gray) and theoretical (blue and red) SAXS profiles for the solution state models in the panel a. SAXS fits are shown together with the fit residuals in the below graph.
Figure 5—figure supplement 1.
Figure 5—figure supplement 1.. Top: Small angle X-Ray scattering chromatograms with intensity (lines) and Rg (symbols) values for each frame merged across the SEC peak.
Middle: UV-visible absorbance chromatograms showing the normalized absorbance at 280 (line) and 432 nm (dotted-line). Bottom: Multi angle light scattering chromatograms with light scattering signal (line) and molecular weight (dots). All chromatograms aligned to the MALS peaks which are furthest downstream to compensate for variations in timing and band broadening.
Figure 5—figure supplement 2.
Figure 5—figure supplement 2.. Normalized Kratky plot for the inactive (black) and active state (gray) of sGC.
Inset: Guinier plots within the q*Rg <1.3.
Figure 5—figure supplement 3.
Figure 5—figure supplement 3.. Top: Best fit conformations for the inactive state of sGC.
Bottom: Extended structure from the best ensemble for the activated sGC conformation.
Figure 6.
Figure 6.. Model for conformational rearrangement upon sGC activation.
Schematic of the sGC activation pathway. sGC adopts a bent CC conformation after formation of the holoenzyme. Upon the addition of NO an equilibrium exists between the inactive and partially extended states, conferring partial activation of sGC. When excess NO enters the cell or the addition of a stimulator compound, the equilibrium shifts to the active state, allowing for an open CAT dimer conformation and maximal activity.

Comment in

References

    1. Allerston CK, von Delft F, Gileadi O. Crystal structures of the catalytic domain of human soluble guanylate cyclase. PLOS ONE. 2013;8:e57644. doi: 10.1371/journal.pone.0057644. - DOI - PMC - PubMed
    1. Anantharaman V, Balaji S, Aravind L. The signaling Helix: a common functional theme in diverse signaling proteins. Biology Direct. 2006;1:25. doi: 10.1186/1745-6150-1-25. - DOI - PMC - PubMed
    1. Arnold WP, Mittal CK, Katsuki S, Murad F. Nitric oxide activates guanylate cyclase and increases guanosine 3':5'-cyclic monophosphate levels in various tissue preparations. PNAS. 1977;74:3203–3207. doi: 10.1073/pnas.74.8.3203. - DOI - PMC - PubMed
    1. Baskaran P, Heckler EJ, van den Akker F, Beuve A. Aspartate 102 in the heme domain of soluble guanylyl cyclase has a key role in NO activation. Biochemistry. 2011a;50:4291–4297. doi: 10.1021/bi2004087. - DOI - PMC - PubMed
    1. Baskaran P, Heckler EJ, van den Akker F, Beuve A. Identification of residues in the heme domain of soluble guanylyl cyclase that are important for basal and stimulated catalytic activity. PLOS ONE. 2011b;6:e26976. doi: 10.1371/journal.pone.0026976. - DOI - PMC - PubMed

Publication types