. 2019 Dec 2;129(12):5537-5552.
doi: 10.1172/JCI129502.

β2 adrenergic receptor-mediated signaling regulates the immunosuppressive potential of myeloid-derived suppressor cells

Affiliations

β2 adrenergic receptor-mediated signaling regulates the immunosuppressive potential of myeloid-derived suppressor cells

Hemn Mohammadpour et al. J Clin Invest. .

Abstract

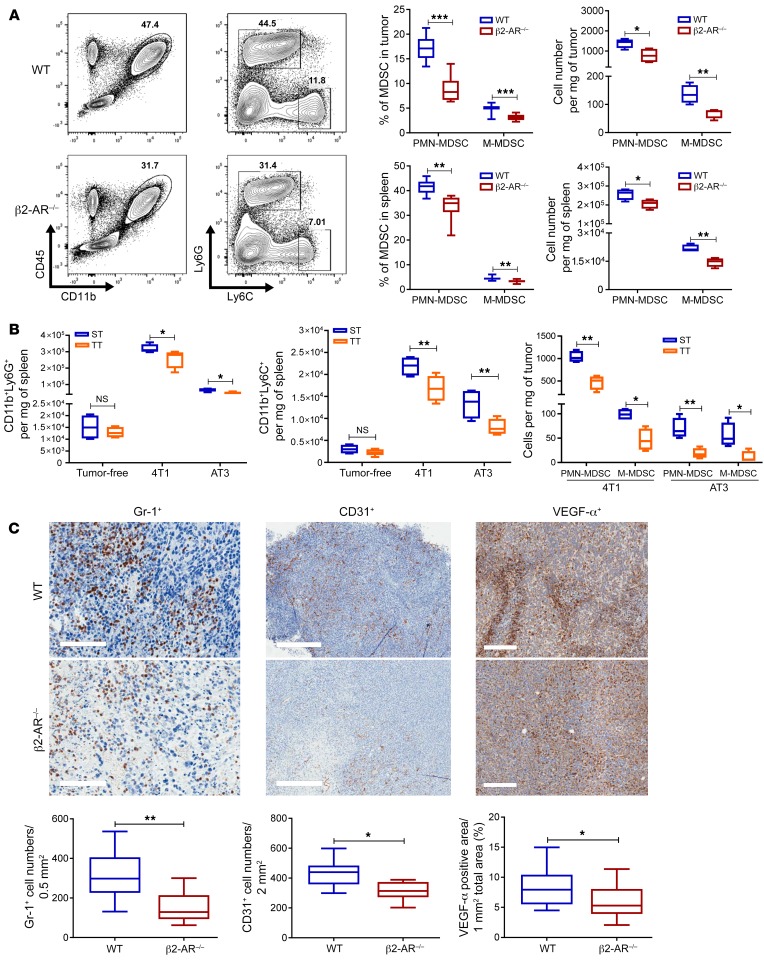
Catecholamines released by sympathetic nerves can activate adrenergic receptors present on nearly every cell type, including myeloid-derived suppressor cells (MDSCs). Using in vitro systems, murine tumor models in wild-type and genetically modified (β2-AR-/-) mice, and adoptive transfer approaches, we found that the degree of β2-AR signaling significantly influences MDSC frequency and survival in tumors and other tissues. It also modulates their expression of immunosuppressive molecules such as arginase-I and PD-L1 and alters their ability to suppress the proliferation of T cells. The regulatory functions of β2-AR signaling in MDSCs were also found to be dependent upon STAT3 phosphorylation. Moreover, we observed that the β2-AR-mediated increase in MDSC survival is dependent upon Fas-FasL interactions, and this is consistent with gene expression analyses, which reveal a greater expression of apoptosis-related genes in β2-AR-/- MDSCs. Our data reveal the potential of β2-AR signaling to increase the generation of MDSCs from both murine and human peripheral blood cells and that the immunosuppressive function of MDSCs can be mitigated by treatment with β-AR antagonists, or enhanced by β-AR agonists. This strongly supports the possibility that reducing stress-induced activation of β2-ARs could help to overcome immune suppression and enhance the efficacy of immunotherapy and other cancer therapies.

Keywords: Cancer immunotherapy; Cellular immune response; G-protein coupled receptors; Immunology; Oncology.


Conflict of interest statement

Conflict of interest: The authors have declared that no conflict of interest exists.

Figures

Figure 1
Figure 1. β2-AR activation increases tumor growth in a MDSC-dependent manner.
(A and B) Tumor growth in mice bearing 4T1 and AT-3 tumor cells, housed at ST (22°C) or TT (30°C). (C) Tumor growth kinetics in WT and β2-AR–/– mice bearing 4T1 tumor cells. (D) Lethally irradiated WT mice received bone marrow transplants from WT (blue circle) or β2-AR–/– (red square) mice. Lethally irradiated β2-AR–/– mice received bone marrow transplants from WT (purple triangle) or β2-AR–/– (brown triangle) mice. Eight weeks after transplantation, chimeric mice were injected with 4T1 tumor cells and tumor growth was monitored. (E) 4T1 tumor–bearing WT or β2-AR–/– mice were injected with isotype or anti–Gr-1 antibodies (200 μg per mouse, i.p., every 4 days), and tumor growth was monitored. (F) β2-AR expression in MDSCs sorted by MDSC isolation kit from spleen of 4T1 tumor–bearing mice 25 days after tumor injection using Image Stream. (G and H) β2-AR expression in MDSCs sorted from bone marrow of non–tumor bearing mice after culture with IL-6, G-CSF, and LPS (data from 3 independent replicates). (I) The levels of β2-AR in splenic MDSCs from healthy or 4T1 tumor–bearing mice using flow cytometry. Two-way ANOVA was used to analyze statistical significance among tumor growth in different groups. These data are presented as mean ± SEM of 5 mice per group from at least 2 replicate experiments. Other data are presented as median ± minimum to maximum. One-way ANOVA was used to analyze statistical significance among 4 groups, and the Student’s t test was used to analyze statistical significance between 2 groups. In all panels, **P < 0.01, ***P < 0.001 and ****P < 0.0001. A P value less than 0.05 was considered significant.
Figure 2
Figure 2. β2-AR activation during chronic stress increases MDSC accumulation in the spleen and tumor.
(A) Representative flow cytometry analysis of PMN-MDSC and M-MDSC subpopulations, as well as absolute number of PMN-MDSCs and M-MDSCs in tumor and spleen of 4T1 tumor–bearing mice on day 25 after tumor injection. The data presented are from groups of 10 mice from 2 replicate studies. (B) Absolute number of G-MDSCs and M-MDSCs in tumor and spleen of healthy or tumor-bearing mice (4T1 or AT-3) at day 25 after tumor injection housed in ST or TT. The data presented are from groups of 8 mice from 2 replicate studies. (C) Both representative immunohistochemistry analysis and absolute number of Gr-1– (×20 magnification, scale bars = 100 μm), CD31- (×4 magnification, scale bars: 500 μm) and VEGF-α–positive (×10 magnification, scale bars: 200 μm) cells in 4T1 tumors at day 25 after tumor injection. These data are presented as median ± minimum to maximum from groups of 6 mice from 2 replicate studies. The Student’s t test was used to analyze statistical significance between 2 groups. In all panels, *P < 0.05, **P < 0.01, and ***P < 0.001. A P value less than 0.05 was considered significant.
Figure 3
Figure 3. β2-AR deletion decreases the immune suppressive activity of MDSCs.
(A) Representative flow cytometry data of the expression of arginase I and PDL-1 plus the percentage of arginase I and PD-L1 in MDSCs derived from bone marrow in the presence of IL-6 and GM-CSF (WT), IL-6, GM-CSF and ISO (WT + ISO) or IL-6, GM-CSF, and ISO and Prop (WT + ISO + Prop) for 6 days. (B) T cells cocultured with WT or WT + ISO MDSCs in various ratios (n = 3). (C) Nanostring nCounter microarray analysis of WT or β2-AR–/– MDSCs sorted by flow cytometry from 4T1 tumors of WT or β2-AR–/– mice 25 days after tumor injection (WT or β2-AR–/– MDSCs were pooled from 5 mice per group). (D) WT and β2-AR–/– MDSCs were sorted from bone marrow of 4T1 tumor–bearing mice, cultured with LPS for 24 hours, and cytokines levels were analyzed in culture media using multiplex (n = 3). (E) Tumor growth kinetics in WT mice orthotopically injected with 4T1 cells (black square) or coinjected with 4T1 cells and WT MDSCs (blue circle) or 4T1 cells and β2-AR–/– MDSCs (red square). MDSCs were sorted from the BM of tumor-bearing mice using an MDSC isolation kit. (F) Tumor growth kinetics in WT or β2-AR–/– mice receiving i.v. transfer (3 × 10⁶ on days 3 and 6 after 4T1 injection) of MDSCs sorted the BM of tumor-bearing WT or β2-AR–/– mice. Two-way ANOVA was used to analyze statistical significance among tumor growth in different groups. These data are presented as mean ± SEM. Other data are presented as median ± minimum to maximum. One-way ANOVA was used to analyze statistical significance among 3 groups, and the Student’s t test was used to analyze statistical significance between 2 groups. In all panels, *P < 0.05, **P < 0.01, ***P < 0.001, and ****P < 0.0001. A P value less than 0.05 was considered significant.
Figure 4
Figure 4. β2-AR prolongs MDSC survival.
(A) Fas and FasL expression by MDSCs and T cells from WT or β2-AR–/– mice from tumor and spleen, respectively (n = 5). (B) Expression of Bcl-2 in intratumoral MDSCs from WT or β2-AR–/– 4T1 tumor–bearing mice (n = 5). (C) Levels of apoptosis in MDSCs from tumor and spleen of WT or β2-AR–/– tumor–bearing mice or WT tumor–bearing mice housed at ST or TT. (D) Schematic diagram of experimental design to compare the survival capability of WT or β2-AR–/– MDSCs. (E) WT (CD45.1) or β2-AR–/– (CD45.2) MDSCs were sorted from bone marrow of AT-3 tumor–bearing mice, mixed in 1:1 ratio, and injected into GFP-positive AT-3 tumor–bearing mice. The percentage of WT (CD45.1) or β2-AR–/– (CD45.2) MDSCs in the live, GFP-negative, CD11b+, and Gr-1+ population on day 3 and day 7 after coinjection were analyzed (4 mice per end point). Data are presented as median ± minimum to maximum. The Student’s t test was used to analyze statistical significance between 2 groups. In all panels, *P < 0.05, **P < 0.01, and ***P < 0.001. A P value less than 0.05 was considered significant.
Figure 5
Figure 5. β2-AR stimulation in MDSCs activates STAT3 signaling.
(A) Bone marrow MDSCs sorted from 4T1 tumor–bearing mice were treated with or without ISO and the level p-STAT3 was analyzed by Western blot (representative blot shown). (B) p-STAT3 expression in tumor MDSCs in WT or β2-AR–/– tumor–bearing mice (top) or WT tumor bearing mice housed at ST or TT (bottom), using flow cytometry (n = 10, 2 replicates). (C) Tumor growth kinetics in WT or β2-AR–/– 4T1 tumor–bearing mice receiving DMSO or JSI-124 (1 mg/kg, i.p., daily injection) (n = 6–10 mice from 2 replicates). (D) MDSC absolute number in spleen or tumor of WT 4T1 tumor–bearing mice receiving DMSO or JSI-124 (n = 5). Two-way ANOVA was used to analyze statistical significance among tumor growth in different groups. These data are presented as mean ± SEM. Other data are presented as median ± minimum to maximum, and the Student’s t test was used to analyze statistical significance between 2 groups. In all panels, *P < 0.05, **P < 0.01, ***P < 0.001, and ****P < 0.0001. A P value less than 0.05 was considered significant.
Figure 6
Figure 6. Propranolol suppresses tumor growth and decreases MDSC accumulation in the spleen and tumor tissue.
(A) Tumor growth kinetics in WT or β2-AR–/– mice orthotopically injected with 4T1 tumor cells receiving PBS or propranolol (i.p. daily injection) (n = 10). (B) Absolute number of MDSCs in spleen and tumor of WT mice treated with PBS or propranolol. (C) Tumor tissue was collected in WT 4T1 tumor–bearing mice at day 25 and stained for Gr-1 (×20 magnification), CD31 (×4 magnification), and VEGF-α (×10 magnification) (n = 5). (D) Representative flow cytometry plot of MDSCs in WT or β2-AR–/– 4T1 tumor–bearing mice receiving saline or 6-OHDA (50 mg/kg, i.p., weekly injection) (n = 6–10 mice from 2 replicates). (E) Percentage and absolute number of MDSCs in tumor and spleen of 4T1 tumor–bearing mice receiving saline or 6-OHDA (50 mg/kg, i.p., weekly injection) (n = 5). Two-way ANOVA was used to analyze statistical significance among tumor growth in different groups. These data are presented as mean ± SEM. Other data are presented as median ± minimum to maximum, and the Student’s t test was used to analyze statistical significance between 2 groups. In all panels, *P < 0.05, **P < 0.01, and ****P < 0.0001. A P value less than 0.05 was considered significant.
Figure 7
Figure 7. Isoproterenol increases MDSC generation from human PBMCs.
(A) Analysis of β2-AR expression on MDSC surface analyzed by flow cytometry after culturing PBMCs with IL-6 and GM-CSF with or without ISO for 7 days. (B) Analysis of MDSC generation analyzed by flow cytometry after culturing PBMCs with IL-6 and GM-CSF with or without ISO for 7 days. (C) The expression of p-STAT3, PDL-1, and arginase-I after culturing PBMCs with IL-6 and GM-CSF with or without ISO for 7 days. (D) Effects of in vitro differentiated MDSCs in the presence or absence of ISO on allogenic CD4+ or CD8+ T cell proliferation and IFN-γ production. One histogram example corresponding to CD8+ proliferation analyzed by ef670 dilution dye in a ratio of 1:4 is shown. These data are presented as median ± minimum to maximum from 3 biological replicates in all graphs, and the Student’s t test was used to analyze statistical significance between 2 groups. In all panels, *P < 0.05, **P < 0.01, and ***P < 0.001. A P value less than 0.05 was considered significant.

Comment in

References

    1. Ugel S, De Sanctis F, Mandruzzato S, Bronte V. Tumor-induced myeloid deviation: when myeloid-derived suppressor cells meet tumor-associated macrophages. J Clin Invest. 2015;125(9):3365–3376. doi: 10.1172/JCI80006. - DOI - PMC - PubMed
    1. Veglia F, Perego M, Gabrilovich D. Myeloid-derived suppressor cells coming of age. Nat Immunol. 2018;19(2):108–119. doi: 10.1038/s41590-017-0022-x. - DOI - PMC - PubMed
    1. Netherby CS, Abrams SI. Mechanisms overseeing myeloid-derived suppressor cell production in neoplastic disease. Cancer Immunol Immunother. 2017;66(8):989–996. doi: 10.1007/s00262-017-1963-5. - DOI - PMC - PubMed
    1. Ostrand-Rosenberg S. Myeloid derived-suppressor cells: their role in cancer and obesity. Curr Opin Immunol. 2018;51:68–75. doi: 10.1016/j.coi.2018.03.007. - DOI - PMC - PubMed
    1. Condamine T, Ramachandran I, Youn JI, Gabrilovich DI. Regulation of tumor metastasis by myeloid-derived suppressor cells. Annu Rev Med. 2015;66:97–110. doi: 10.1146/annurev-med-051013-052304. - DOI - PMC - PubMed

Publication types

MeSH terms

Substances