Clinical Trial
. 2019 Nov 1;129(11):4691-4707.
doi: 10.1172/JCI124884.

IFN-γ drives inflammatory bowel disease pathogenesis through VE-cadherin-directed vascular barrier disruption

Affiliations
Clinical Trial

IFN-γ drives inflammatory bowel disease pathogenesis through VE-cadherin-directed vascular barrier disruption

Victoria Langer et al. J Clin Invest. .

Abstract

Inflammatory bowel disease (IBD) is a chronic inflammatory disorder with rising incidence. Diseased tissues are heavily vascularized. Surprisingly, the pathogenic impact of the vasculature in IBD and the underlying regulatory mechanisms remain largely unknown. IFN-γ is a major cytokine in IBD pathogenesis, but in the context of the disease, it is almost exclusively its immune-modulatory and epithelial cell-directed functions that have been considered. Recent studies by our group demonstrated that IFN-γ also exerts potent effects on blood vessels. Based on these considerations, we analyzed the vessel-directed pathogenic functions of IFN-γ and found that it drives IBD pathogenesis through vascular barrier disruption. Specifically, we show that inhibition of the IFN-γ response in vessels by endothelial-specific knockout of IFN-γ receptor 2 ameliorates experimentally induced colitis in mice. IFN-γ acts pathogenic by causing a breakdown of the vascular barrier through disruption of the adherens junction protein VE-cadherin. Notably, intestinal vascular barrier dysfunction was also confirmed in human IBD patients, supporting the clinical relevance of our findings. Treatment with imatinib restored VE-cadherin/adherens junctions, inhibited vascular permeability, and significantly reduced colonic inflammation in experimental colitis. Our findings inaugurate the pathogenic impact of IFN-γ-mediated intestinal vessel activation in IBD and open new avenues for vascular-directed treatment of this disease.

Keywords: Cytokines; Gastroenterology; Inflammatory bowel disease; Vascular Biology; endothelial cells.


Conflict of interest statement

Conflict of interest: The authors have declared that no conflict of interest exists.

Figures

Figure 1
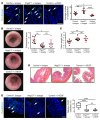
Figure 1. Endothelial-specific inhibition of the IFN-γ response ameliorates DSS-induced colitis in mice.
Mice with an endothelial cell–specific knockout of IFN-γ receptor 2 either from onset (Ifngr2ΔEC, n = 11) or after tamoxifen induction (Ifngr2iΔEC, n = 7) and mice with floxed Ifngr2 alleles (Control, both n = 9) were compared. Colitis was induced by addition of 2.5% DSS to the drinking water for either 1 cycle (acute colitis) or 3 cycles (chronic colitis, 4 Ifngr2ΔEC and 5 Ifngr2fl/fl). (A) Endothelial cell–specific knockout of the receptor was analyzed by immunofluorescent costaining of IFN-γ receptor 2 (red) and the endothelial cell marker CD31 (green). A strong expression of the receptor in colon epithelial cells was maintained in all animals (asterisks). The receptor was absent in endothelial cells of knockout animals (green, arrows) and present in colon vessels of control animals (yellow, arrowheads). Nuclei were stained with DRAQ5 (blue). Scale bars: 50 μm. (BD) Colon inflammation was analyzed by endoscopic score (B), measurement of colon length (C), and histologic examination after H&E staining (D). Scale bars: 100 μm. Representative pictures are shown. All graphs represent data quantification with means ± SD. Two-tailed, unpaired Student’s t test (B and C) was used to determine statistical significance (*P < 0.05, ***P < 0.001, ****P < 0.0001).
Figure 2
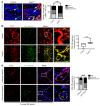
Figure 2. Endothelial-specific inhibition of the IFN-γ response suppresses immune cell infiltration during DSS-induced colitis in mice.
Mice with an endothelial cell–specific knockout of IFN-γ receptor 2 (Ifngr2ΔEC; Ifngr2iΔEC) and mice with floxed Ifngr2 alleles (Control) were compared. Colitis was induced by addition of 2.5% DSS to the drinking water for either 1 cycle (acute colitis) or 3 cycles (chronic colitis). Colonic immune cell infiltration was determined by immunofluorescence staining of CD45 (green) (A) and F4/80 (red) (B). Nuclei were stained with DRAQ5 (blue). Arrows indicate examples for CD45+ or F4/80+ cells (left panels). Scale bars: 50 μm. Quantitative evaluations are shown on the right side of each panel, including the pooled results from 2 independent experiments (in the acute DSS-colitis model, 11 Ifngr2ΔEC mice were compared with 9 control mice and 5 Ifngr2iΔEC mice with 3 control mice; in the chronic colitis model, 4 Ifngr2ΔEC mice were compared with 5 control mice). Representative pictures are shown. Data are expressed as box-and-whisker plots. Horizontal bars indicate the median, box borders indicate the 25th and 75th percentiles, and whiskers indicate minimum and maximum values. Mann-Whitney U test (A and B) was used to determine statistical significance (***P < 0.001, ****P < 0.0001).
Figure 3
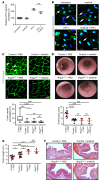
Figure 3. IFN-γ exerts angiostatic effects in vitro, ex vivo, and in vivo.
(A) In vitro angiogenesis on a 3D microfluidic chip using HUVEC and fibroblast cocultures. Representative pictures are shown. IFN-γ significantly reduced angiogenic sprout length and thickness. Scale bar: 300 μm. Quantification included control (n = 9) and IFN-γ–treated (100 U/mL) chips (n = 6) with 15 sprouts analyzed per chip. (B) Metatarsals of 18.5-day-old mouse embryos after 10 days of cultivation. Ex vivo vessel outgrowth was visualized by immunofluorescence staining (CD31, green). Vessel outgrowth stimulated by VEGF-A (100 ng/mL) was completely inhibited by IFN-γ (100 U/mL) in control but not in Ifngr2ΔEC mice. One representative picture of 5 experiments is shown. Scale bar: 500 μm. (C) Representative images of colon tissue from control and Ifngr2EC mice with DSS-colitis double-stained for CD31 (green) and Ki-67 (pink). Counterstaining was performed with DRAQ5 (blue). The arrow indicates an example of a nonproliferating vessel, whereas the arrowhead points to a proliferating vessel. Scale bar: 50 μm. Vessel number (CD31+ with lumen) was counted in 10 regions per section (n = 9 control mice; n = 10 Ifngr2ΔEC mice). Ki-67+ vessels were counted as angiogenic vessels, and 162 vessels per group were analyzed in total (n = 9 control mice; n = 9 Ifngr2ΔEC mice). Quantification included pooled results from 2 independent experiments (right panels). Data are expressed as box-and-whisker plots (horizontal bars, median; box borders, 25th and 75th percentiles; whiskers, minimum and maximum values) (A) or as means ± SD (C). Two-tailed, unpaired Student’s t test (A, length; C, vessel number) and Mann-Whitney U test (A, thickness; C, vessel proliferation) were used to determine statistical significance (**P < 0.01, ***P < 0.001, ****P < 0.0001).
Figure 4
Figure 4. Angiogenesis is not related to the pathogenesis of DSS-induced colitis in mice.
During DSS-colitis, control mice were injected either with a monoclonal antibody (B20-4.1.1, 150 μg/mouse) blocking the interaction of VEGF-A with VEGF receptors 1 and 2 (αVEGF; n = 8) or with an isotype antibody (150 μg/mouse, n = 9) and were compared with Ifngr2ΔEC mice receiving the isotype antibody (n = 9). (A) Vessel number (CD31, green) was counted in 10 regions per colon tissue section. Arrows indicate CD31+ vessels with lumen. Scale bar: 50 μm. (BD) Colitis grade was evaluated by endoscopic score (B), colon length (C), histologic presentation after H&E staining (scale bar: 100 μm) (D), and CD45 immune cell infiltration (green, arrows), analyzed in 5 regions per colon tissue section (scale bar: 50 μm) (E). Representative pictures are shown. Quantitative evaluations are shown on the right side of the respective panels, including the pooled results from 2 independent experiments. Graphs present means ± SD (AC) or box-and-whisker plots, where horizontal bars indicate the median, box borders indicate the 25th and 75th percentiles, and whiskers indicate minimum and maximum values (E). One-way ANOVA followed by Tukey’s post hoc test (A, B, and E) and Kruskal-Wallis test followed by Dunn’s post hoc test (C) were used to determine statistical significance (*P < 0.05, **P < 0.01, ****P < 0.0001). Genotypes of respective mice are shown in Supplemental Figure 1D.
Figure 5
Figure 5. The intestinal vasculature is characterized by IFN-γ–mediated barrier dysfunction in murine DSS-induced colitis and human IBD.
(AD) Seventy-kDa FITC-dextran (10 mg/mL) was injected i.v. in mice with acute and chronic DSS-colitis. Accumulation in intestinal crypts (arrows) indicates vessel permeability, calculated as the ratio of FITC signal inside the crypts over the total FITC signal. Vessel permeability was reduced in Ifngr2ΔEC (n = 4) (A) and Ifngr2iΔEC (n = 7) mice (B) compared with control mice (n = 4 and 7, respectively) during acute (A and B) and chronic colitis (C; 4 Ifngr2ΔEC vs. 5 control). For quantitative evaluation, 10–12 crypts were analyzed per mouse. Scale bars: 50 μm. (D) Control mice with αVEGF treatment (150 μg/mouse, n = 8) and Ifngr2ΔEC mice (n = 8) showed reduced vascular permeability in contrast to control mice treated with isotype antibody (150 μg/mouse, n = 7). Scale bar: 50 μm. For quantitative evaluation, 10 crypts per mouse were analyzed. Pooled results from 2 independent experiments are shown. (E) Human IBD patients with active disease (n = 8) or remission (n = 7) or control patients without IBD (n = 3) underwent pCLE. Fluorescein accumulation in intestinal crypts (arrows) indicates vessel permeability, calculated as the ratio of fluorescein signal inside the crypts over total fluorescein signal. Vessel permeability was increased in active disease (10 crypts per patient). Scale bar: 20 μm. Representative pictures are shown. Quantitative evaluations (right side of each panel) are shown as box-and-whisker plots (horizontal bars, median; box borders, 25th and 75th percentiles; whiskers, minimum and maximum values; AD) or means ± SD (E). Mann-Whitney U test (AC), Kruskal-Wallis test followed by Dunn’s post hoc test (D), and 1-way ANOVA followed by Tukey’s post hoc test (D) were used to determine statistical significance (***P < 0.001, ****P < 0.0001).
Figure 6
Figure 6. IFN-γ compromises mural cell coverage and VE-cadherin–mediated cell-cell interactions during DSS-induced colitis and human IBD.
(A) Costaining of α-SMA (red) and CD31 (green) in colon tissue of Ifngr2ΔEC (n = 11, in total 783 vessels) and control mice (n = 9, in total 827 vessels) with DSS-colitis (pooled results from 2 independent experiments). Mural cell coverage (α-SMA+) was categorized as negative/weak (arrowheads), moderate, or high (arrows). Scale bar: 25 μm. (B) VE-cadherin (green) colocalization with colonic vessels (CD31, red) of Ifngr2ΔEC and control mice with DSS-colitis (n = 3 each) visualized by 2-photon microscopy. The mean colocalization of Ifngr2ΔEC mice was set to 100%. Data are expressed as box-and-whisker plots. Horizontal bars indicate the median, box borders indicate the 25th and 75th percentiles, and whiskers indicate minimum and maximum values. Scale bar: 25 μm. (C) Human IBD and corresponding uninvolved intestinal tissues (n = 11; 487 vessels in inflamed and 333 vessels in uninvolved regions) were stained for CD31 (red) and VE-cadherin (green). Vessel colocalization with VE-cadherin was categorized as negative/weak, moderate, or high. VL, vessel lumen. Scale bar: 50 μm. (A and C) Nuclei stained by DRAQ5 (blue). χ2 test (A and C) and 2-tailed, unpaired Student’s t test (B) were used (**P < 0.01, ****P < 0.0001).
Figure 7
Figure 7. IFN-γ–induced disturbances of VE-cadherin–mediated cell-cell interactions are sufficient to increase vascular permeability in endothelial cells in culture.
(A and B) VE-cadherin (green) localization at cell-cell contacts in a microfluidic, vasculogenic network of HUVECs (A; untreated, n = 12; IFN-γ–treated [100 U/mL], n = 6; scale bar: 30 μm) or in static MIECs (B; IFN-γ, 100 U/mL; VEGF-A, 30 ng/mL; scale bar: 25 μm). (C) MIECs stained for VE-cadherin (green) and ZO-1 (red) in the absence and presence of IFN-γ (100 U/mL). Scale bar: 25 μm. (D) VE-cadherin staining (green) in BV13-treated (50 μg/mL) or isotype-treated (50 μg/mL) MIECs. Scale bar: 25 μm. (E) In vitro permeability assay of MIECs after VE-cadherin blockade with BV13 (normalized to untreated cells). Data are expressed as box-and-whisker plots. Horizontal bars indicate the median, box borders indicate the 25th and 75th percentiles, and whiskers indicate minimum and maximum values. (AD) Nuclei stained by DRAQ5 (blue). Arrows indicate linear VE-cadherin and/or ZO-1 pattern at cell-cell contacts; asterisks display internalization. (AE) One representative experiment of 3 independent experiments is depicted. One-way ANOVA with Tukey’s post hoc test (E) was used (**P < 0.01).
Figure 8
Figure 8. Treatment with imatinib restores vascular barrier function and reduces DSS-induced inflammation.
(A) Imatinib (0.01 μg/mL) reduced IFN-γ–induced (100 U/mL) endothelial cell (MIEC) permeability in vitro; values are normalized to untreated cells. (B) Immunofluorescence staining of VE-cadherin (green), counterstained by DRAQ5 (blue), in MIECs treated with IFN-γ (100 U/mL), imatinib (0.01 μg/mL) plus IFN-γ, or imatinib alone or left untreated. Arrows indicate linear VE-cadherin pattern at cell-cell contacts; asterisks mark internalization. Scale bar: 25 μm. (CF) Control mice received imatinib (n = 11) orally daily during the course of DSS-colitis or PBS only (n = 10) and were compared with Ifngr2ΔEC mice receiving the same treatment (n = 3, imatinib; n = 4, PBS). (C) In vivo permeability of colonic vessels was assessed by i.v. injection of 70-kDa FITC-dextran (10 mg/mL). Accumulation in intestinal crypts (arrows) indicates vessel permeability, calculated as the ratio of FITC signal inside the crypts over the total FITC signal in percent (10 crypts per mouse). Scale bar: 50 μm. Treatment with imatinib reduced the severity of DSS-colitis in control mice evaluated by endoscopy (D), colon length (E), and histologic examination by H&E staining (F; scale bar: 100 μm). (A and B) One representative of 3 independent experiments is depicted. Quantitative evaluations are shown as box-and-whisker plots (A and C) (horizontal bars, median; box borders, 25th and 75th percentiles; whiskers, minimum and maximum values) or means ± SD (D and E). All graphs are means ± SD. One-way ANOVA followed by Tukey’s post hoc test (A, D, and E) and Kruskal-Wallis test followed by Dunn’s post hoc test (C) were used for statistical evaluation (*P < 0.05, **P < 0.01, ***P < 0.001, ****P < 0.0001). For genotypes of respective mice, see Supplemental Figure 1E.
Figure 9
Figure 9. IFN-γ–induced vessel permeability and its inhibition by imatinib in IBD.
IFN-γ increases permeability of intestinal vessels by disruption of VE-cadherin junctions, associated with increased inflammation and progression of IBD. Imatinib inhibits VE-cadherin disruption, reduces vascular permeability, and ameliorates the course of the disease. (–), normal level; black arrows, increase or decrease as compared with normal level.

References

    1. Rutgeerts P, Vermeire S, Van Assche G. Biological therapies for inflammatory bowel diseases. Gastroenterology. 2009;136(4):1182–1197. doi: 10.1053/j.gastro.2009.02.001. - DOI - PubMed
    1. Ng SC, et al. Worldwide incidence and prevalence of inflammatory bowel disease in the 21st century: a systematic review of population-based studies. Lancet. 2018;390(10114):2769–2778. - PubMed
    1. Uhlig HH, Powrie F. Dendritic cells and the intestinal bacterial flora: a role for localized mucosal immune responses. J Clin Invest. 2003;112(5):648–651. doi: 10.1172/JCI19545. - DOI - PMC - PubMed
    1. Neurath MF. Cytokines in inflammatory bowel disease. Nat Rev Immunol. 2014;14(5):329–342. doi: 10.1038/nri3661. - DOI - PubMed
    1. Peterson LW, Artis D. Intestinal epithelial cells: regulators of barrier function and immune homeostasis. Nat Rev Immunol. 2014;14(3):141–153. doi: 10.1038/nri3608. - DOI - PubMed

Publication types

MeSH terms