Clinical Trial
. 2019 Nov 1;129(11):4758-4768.
doi: 10.1172/JCI128475.

Early adaptive immune activation detected in monozygotic twins with prodromal multiple sclerosis

Affiliations
Clinical Trial

Early adaptive immune activation detected in monozygotic twins with prodromal multiple sclerosis

Eduardo Beltrán et al. J Clin Invest. .

Abstract

Multiple sclerosis (MS) is a disabling disease of the CNS. Inflammatory features of MS include lymphocyte accumulations in the CNS and cerebrospinal fluid (CSF). The preclinical events leading to established MS are still enigmatic. Here we compared gene expression patterns of CSF cells from MS-discordant monozygotic twin pairs. Six "healthy" co-twins, who carry a maximal familial risk for developing MS, showed subclinical neuroinflammation (SCNI) with small MRI lesions. Four of these subjects had oligoclonal bands (OCBs). By single-cell RNA sequencing of 2752 CSF cells, we identified clonally expanded CD8+ T cells, plasmablasts, and, to a lesser extent, CD4+ T cells not only from MS patients but also from subjects with SCNI. In contrast to nonexpanded T cells, clonally expanded T cells showed characteristics of activated tissue-resident memory T (TRM) cells. The TRM-like phenotype was detectable already in cells from SCNI subjects but more pronounced in cells from patients with definite MS. Expanded plasmablast clones were detected only in MS and SCNI subjects with OCBs. Our data provide evidence for very early concomitant activation of 3 components of the adaptive immune system in MS, with a notable contribution of clonally expanded TRM-like CD8+ cells.

Keywords: Adaptive immunity; Immunology; Multiple sclerosis; Neuroscience.


Conflict of interest statement

Conflict of interest: The authors have declared that no conflict of interest exists.

Figures

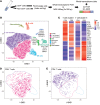
Figure 1
Figure 1. Cellular composition of lymphocytes upon analysis by scRNA-Seq.
(A) Flowchart of the analysis of human CSF by scRNA-Seq. Because CD4+ cells make up the majority of CSF cells, they were collected by magnetic beads and single CD4+ cells were isolated by flow cytometry. The remaining non-CD4+ cells were separately isolated by single-cell index sorting using different markers. Thus, the ratio of CD4+ and non-CD4+ cell numbers does not reflect the ratio of absolute cell numbers in the CSF samples. Nevertheless, ratios and cell numbers within the non-CD4+ populations are comparable. Whole transcriptomes of each single cell were determined by next-generation sequencing (NGS) with a read length of 2 × 150 bp that allows identification of the hypervariable regions of TCRs and BCRs together with their corresponding V families. Thus, not only transcriptome profiles of each single cell are determined, but also matching α:β TCR and H:L BCR chains. This allows tracking of distinct clones. (B) t-SNE projection of transcriptome data from 2752 single CSF cells and 332 PBMCs from 16 patients, profiled in 9 main clusters. For better visualization, background areas were shaded manually to indicate major cell populations, although some cells will appear in “foreign” areas. Each dot corresponds to one single cell, colored according to the respective cell cluster. DCs, pDCs, and monocytes were not specifically labeled during flow cytometry analyses; therefore up to 6 transcripts were used as discriminators and are listed next to each cluster. (C) Heatmap showing normalized mean expression levels of discriminative gene sets for T cell cluster I CD4+ (lane 1) and CD8+ cells (lane 2), and cluster II CD4+ (lane 3) and CD8+ cells (lane 4). (D) t-SNE projection of all index-sorted CD8+ T cells. (E) t-SNE projection of all index-sorted CD4+ T cells.
Figure 2
Figure 2. Cellular composition of CSF samples in different disease stages of MS and controls.
t-SNE projections of CSF samples from subjects with NIC (A), SCNI (B), MS (C), and Enc (D). Clusters were defined as in Figure 1B but blood cells were removed. CD4+ and CD8+ T cells are colored according to the index-sorting information obtained by flow cytometry.
Figure 3
Figure 3. Analysis of clonally expanded lymphocyte cells.
t-SNE projection of all CSF cells where either CD4+ (A) or CD8+ (B) cells were removed. Cells of the adaptive immune system with at least 1 detectable TCR or BCR chain are shown in light reddish color. Cells of the innate immune system are shown in gray. Expanded clones, i.e., T and B cells that express identical α:β TCR or H:L BCR chains, are highlighted in dark red for CD8+ T cells, blue for CD4+ T cells, and green for B cells. Dot sizes correlate with clonal frequencies: normal-sized dots indicate that the clone was found 2 times; larger dots indicate that it was found 3 or more times.
Figure 4
Figure 4. Analysis of clonally expanded T cells in SCNI and MS.
t-SNE projection of all CD8+ and CD4+ T cells from subjects with SCNI (A) and MS (B). Expanded T cell clones that express identical α:β TCR are highlighted in dark red for CD8+ T cells and blue for CD4+ T cells. Dot sizes correlate with clonal frequencies: normal-sized dots indicate that the clone was found 2 times; larger dots indicate that it was found 3 or more times.
Figure 5
Figure 5. Heatmap of gene expression levels of selected function-associated genes in CD8+ T cells.
CD8+ T cells were selected based on flow cytometry staining for CD8 and presence of at least one TCR chain as determined by next-generation sequencing. Gene expression of 25 marker genes for homing, migration, and activation is shown for nonexpanded CD8+ T cells and expanded CD8+ T cell clones from SCNI, MS, and Enc subjects. No distinction is made for NIC, as the number of expanded clones is too low. Color scheme is based on Z score distribution from –2.5 (blue) to 2.5 (red).
Figure 6
Figure 6. Violin plots show gene expression of CD8+ T cells on the single-cell level.
Each dot represents a single cell. Statistically significant gene expression is observed only if a violin-shaped fitting area can be calculated. (A) The homing marker S1PR1 is expressed on all T cells but is downregulated when a cell adopts a TRM phenotype. This is only the case for expanded CD8+ T cells from MS patients. (B) The TRM marker CXCR6 is upregulated only in expanded CD8+ T cells from MS and Enc patients. (C) The marker CXCL16 is the sole ligand of CXCR6. It is upregulated only in DCs and monocytes. (D) CXCL16 is expressed in DCs (left panel) and monocytes (right panel) from all patient groups.
Figure 7
Figure 7. Heatmap of gene expression levels of nonexpanded and expanded CD8+ T cells from 1 monozygotic twin pair.
Expression levels of the same genes as in Figure 5 are shown for the twin pair AR-H and AR-MS.

References

    1. Dendrou CA, Fugger L. Immunomodulation in multiple sclerosis: promises and pitfalls. Curr Opin Immunol. 2017;49:37–43. doi: 10.1016/j.coi.2017.08.013. - DOI - PubMed
    1. Hohlfeld R, Dornmair K, Meinl E, Wekerle H. The search for the target antigens of multiple sclerosis, part 1: autoreactive CD4+ T lymphocytes as pathogenic effectors and therapeutic targets. Lancet Neurol. 2016;15(2):198–209. doi: 10.1016/S1474-4422(15)00334-8. - DOI - PubMed
    1. Hohlfeld R, Dornmair K, Meinl E, Wekerle H. The search for the target antigens of multiple sclerosis, part 2: CD8+ T cells, B cells, and antibodies in the focus of reverse-translational research. Lancet Neurol. 2016;15(3):317–331. doi: 10.1016/S1474-4422(15)00313-0. - DOI - PubMed
    1. Reich DS, Lucchinetti CF, Calabresi PA. Multiple sclerosis. N Engl J Med. 2018;378(2):169–180. doi: 10.1056/NEJMra1401483. - DOI - PMC - PubMed
    1. Papalexi E, Satija R. Single-cell RNA sequencing to explore immune cell heterogeneity. Nat Rev Immunol. 2018;18(1):35–45. doi: 10.1038/nri.2017.76. - DOI - PubMed

MeSH terms