

Notch and EGFR regulate apoptosis in progenitor cells to ensure gut homeostasis in Drosophila
- PMID: 31566767
- PMCID: PMC6826210
- DOI: 10.15252/embj.2018101346
Notch and EGFR regulate apoptosis in progenitor cells to ensure gut homeostasis in Drosophila
Abstract
The regenerative activity of adult stem cells carries a risk of cancer, particularly in highly renewable tissues. Members of the family of inhibitor of apoptosis proteins (IAPs) inhibit caspases and cell death, and are often deregulated in adult cancers; however, their roles in normal adult tissue homeostasis are unclear. Here, we show that regulation of the number of enterocyte-committed progenitor (enteroblast) cells in the adult Drosophila involves a caspase-mediated physiological apoptosis, which adaptively eliminates excess enteroblast cells produced by intestinal stem cells (ISCs) and, when blocked, can also lead to tumorigenesis. Importantly, we found that Diap1 is expressed by enteroblast cells and that loss and gain of Diap1 led to changes in enteroblast numbers. We also found that antagonistic interplay between Notch and EGFR signalling governs enteroblast life/death decisions via the Klumpfuss/WT1 and Lozenge/RUNX transcription regulators, which also regulate enteroblast differentiation and cell fate plasticity. These data provide new insights into how caspases drive adult tissue renewal and protect against the formation of tumours.
Keywords: Klumpfuss/WT1; Lozenge/RUNX; caspase; intestinal enteroblast; physiological apoptosis.
© 2019 The Authors.
Conflict of interest statement
The authors declare that they have no conflict of interest.
Figures

- A
Scheme for tracing intestinal progenitor cell number regulation in midgut with low intestinal renewal (“Low”) using the lineage‐tracing ReDDM system. The strategy relies on minimizing exposure of flies to contaminated food by transferring flies to fresh food vials every 2 days (“Low”) as compared with normal culturing conditions in which flies are typically transferred to fresh food vial every week. This “Low” demand strategy effectively minimized intestinal renewal.
- B
Scheme of the ReDDM‐tracing method (Antonello et al, 2015). This system uses two fluorescent transgenes with short‐term (membrane CD8::GFP, green) and long‐term (nuclear RFP::H2B, red) stability and the Gal80 repressor (tubα1‐Gal80 ts) for temporal control of UAS‐driven transgenes. Using esg‐Gal4, the reporter transgenes are seen in the ISCs and EBs (detected as double‐labelled cells). Newly renewed ECs or EEs are traced by the nuclear RFP owing to the protein stability of RFP::H2B.
- C
Quantification of renewed ECs (RFP‐only labelled cells), left graph, and number of ISC and EB cells (double RFP+ GFP+ cells), right graph, in posterior midguts after 7, 14 or 21 days of tracing in normal (“Variable”: gut scored n = 9, 8, 4) and low demand (“Low”: n = 6, 4, 7) culturing conditions. Asterisks denote significances from one‐way ANOVA with Bonferroni's multiple comparison test (**P = 0.0016; ****P < 0.0001).
- D
Quantification of mitosis (phospho‐histone H3 (PH3)+ cells) in low demand midguts at the indicated time points. **P = 0.0015; n.s. not significant from one‐way ANOVA test.
- E
Representative adult midgut from control esg ReDDM at day 14 after temperature shift in variable demand. ECs renewed are marked positively by persistent RFP labelling (red‐only cells).
- F, G
Few ECs had been renewed in “Low” midguts after 14 (F) and 21 (G) days of tracing.
- H–J
Age‐synchronized posterior midguts of control (esg ReDDM >, H) and p35 overexpression in stem and progenitor cells (esg ReDDM >p35, p35 I and J) at 7 days after temperature shift. Arrows in (H, I) point to newly differentiated ECs. In (J), tumour mass is found in the anterior midgut.
- K
Quantification of mitosis PH3+ cells in posterior midgut (pmg) (control: gut scored n = 13 and esg>p35, p35: n = 22]). Student's t‐test (****P < 0.0001).
- L
Diap1 is monitored by the GFP.4.3 (green) reporter (Zhang et al, 2008; Djiane et al, 2013). Diap1‐GFP is detected in a subset of adult midgut esg + cells that are negative for the mitotic marker PH3 (red, inset) and for EE marker Prospero (Pros, grey in inset). Diap1‐GFP is not detected in mature EC (large nuclei cells, DAPI in blue).
- M–O
Diap1‐GFP (green) co‐localized almost 100% with the EB marker GBE‐Su(H)‐lacZ (red, M and O). Arrow points to a rare Diap1‐GFP‐negative GBE‐Su(H)‐lacZ‐positive cell.

- A
Schematic representation of the apoptotic pathway in Drosophila.
- B
Lineage tracing using the initiator caspase sensor act‐DBS‐S‐QF (14 days of tracing) combined with QUAS‐FLP and act>FRT>lacZ is visualized by βgalactosidase (βGal, green). ISCs are labelled by anti‐Dl (red, insets). Red arrowhead points to the ISC. Gut is counterstained with DAPI (blue) and DAPI (grey, in the inset).
- C, D
Control GBE‐Su(H) ReDDM> and (D) GBE‐Su(H) ReDDM >p35, p35 midguts after 7 days of tracing.
- E–E″
Adult midgut klu>mCD8::GFP, GBE‐Su(H)‐lacZ stained for β‐Gal (red) and GFP (green). DAPI counterstaining in blue (E’ and E’’). The arrows point to examples of klu‐negative Su(H)‐lacZ‐positive cells. The green label (asterisk, E) is in the overlying muscle.
- F–J
Adult midguts of (F) control klu ReDDM> (G) klu ReDDM>Debcl‐RNAi, (H) klu ReDDM>Drice‐RNAi, (I) klu ReDDM>Diap1‐RNAi, (J) klu ReDDM>Diap1 midguts after 7 days of tracing. The arrows point to examples of PH3+ labelled ISCs.
- K
Quantification of klu + cells in the indicated midguts at day 7 in low demand (Low) or standard (Variable) culturing conditions (n = 7, 5, 9, 7).
- L
Intestinal cell turnover measured by quantification of the number of newly renewed ECs (RFP‐only cells: gut scored n = 9, 13, 9, 13).
- M
Quantification of apoptotic progenitor cells (esg +) measured as GFP+ TUNEL+ cells (n = 9, 9, 9, 9).
- N
Quantification of klu + cells and renewed ECs in klu ReDDM>Diap1 posterior midguts (n = 8) relative to “Low” control in (K and L), respectively.

- A–E
Representative confocal images of posterior midguts (pmg) of control (A and D) and Dark‐RNAi (B), Dredd‐RNAi (C) and unprocessed Dronc (UAS‐Dronc.s) overexpression at day 7 after temperature shift using klu ReDDM. Mitosis is monitored by PH3 staining (grey dots). Scale bar, 100 μm. Arrowheads point to examples of activated caspase‐positive progenitor (klu +) cells.
- F
Quantification of the number of double GFP+, cleaved caspase‐3 + cells in pmg in the indicated genotypes. Control guts klu ReDDM > (n = 17), klu ReDDM >Dronc.s (n = 14) and klu ReDDM >Dark‐RNAi (n = 12).
- G
Quantitative RT–PCR assays of the efficacy of the indicated RNAi transgenes using hsp70‐Gal4 stimulation (1‐h heat shock at 37°C) (n = 10 larvae per genotype, three technical replicates). Error bars denote mean ± standard deviation (SD). P value (***P < 0,001; ****P < 0.0001)
- H
Left histogram, number of cells per clone in control (n = 90 clones scored, in 10 guts) and Drice 17 (n = 117, in 10 guts) using MARCM system. Right histogram, mitosis (PH3+ cells) in guts carrying neutral (+) and Drice 17 MARCM clones. Representative confocal images of MARCM clones of the indicated genotype are shown above the histograms.

- A, A′
Quantification of the number of PH3+ cells in posterior midguts after 7 days of tracing with or without apoptosis in EBs (A). Number of midgut scored for the indicated genotypes are n = 15, 4, 5, 6, 4, 14, 9, 10, 5, 4, 11, 9, 13, 14. (A′) Quantification of the number of new ECs (RFP+‐labelled cells) in the indicated posterior midguts (n = 18, 14, 5, 6, 8, 10, 9, 5, 4, 12, 9, 13, 14). The box and whisker plots showing min to max, and the line in the middle of the box denotes the median. **P < 0.01; ***P < 0.001; ****P < 0.0001, one‐way ANOVA with Bonferroni correction.
- B
Representative homeostatic midgut labelled with the RFP sensor of JNK activity (red) and Diap1‐GFP (green) and Dlg‐1 (grey) to outline EC membranes.
- C
A magnification of a part of the image showing JNK‐DsRed and Diap1‐GFP. JNK activity is not detected in progenitor cells. Note JNK+ cells are mature ECs as visualized by the Dlg1 marker.
- D, E
Gene expression levels addressed by qPCR for the indicated target genes upon N‐ and EGFR manipulations in age‐synchronized adult midguts after 7 days of the temperature shift to inactivate Gal80 (n = 10 guts per each biological replicate, and done three biological replicates, plus three technical replicates. The error bars denote mean ± SD. P value (*P ≤ 0.05; ***P ≤ 0.001; ****P < 0.0001), two‐tailed Student's t‐test.
- F
Adult homeostatic midgut staining with anti‐Lz (a‐Lz) antibody (pink nuclei, arrowhead).
- G, H
Midguts of control lz ReDDM (G) and with p35 overexpression (H). Note that lz + progenitor cells generated differentiated progeny (red cells in H) only when apoptosis was blocked.
- I
, I′Overexpression of lz in ISCs and EBs by esg ReDDM caused precocious differentiation (red‐only cells). Differentiated ECs are labelled by the epithelial marker Dlg‐1 (blue). Note the small size of the new ECs, denoting precocious terminal differentiation.
- J
Overexpression of EGFR act by esg ReDDM.
- K
lz overexpression simultaneously with EGFR act can suppress EB accumulation driven.

- A–E
Confocal images of representative midguts of the indicated genotypes using klu ReDDM for tracing and age‐ and EB‐specific transgene expression at day 7 after temperature shift. ISC mitosis was monitored by using PH3 labelling (white) in all guts. (B–E) Accumulation and loss of klu + cells by loss (B and E) and gain (C and D) of N and EGFR signalling. In (C), the accumulation of EC‐committed EBs (klu+ cells) in midguts with constitutively activated EGFR (klu ReDDM> EGFR act) is accompanied with a non‐autonomous increase in ISC mitosis. Inset in (C) shows labelling with Dl (blue), revealing symmetric ISC mitoses as reported previously (Jiang & Edgar, 2009).
- F
Quantification of the number of klu + (EBs) in the indicated midguts (n = 21, 14, 5, 6, 8, 6, 4, 10, 12, 9, 13, 14).
- G
Quantification of apoptotic esg + (TUNEL+ GFP+) cells in the indicated midguts (n = 28, 4, 7, 7, 16, 8, 8, 7, 10, 7, 20, 24). Quantification of PH3+ and EC renewals is in Fig EV2A.
- H–M
Confocal images of representative midguts of the indicated genotypes as in (A–E). (H and I) Rescue of the loss of EBs induced by gain of Notch (H‐RNAi) or the loss of EGFR (EGFR DN) by expressing Debcl‐RNAi. (J and K) Impact of gain of expression (J) and loss by RNAi expression (K) of lz using klu ReDDM (see Fig EV2A for PH3+ quantification). White arrowheads point to examples of mitosis labelled by PH3+. (L and M) Impact of gain of expression (L) or loss by RNAi expression (M) of klu (M) using klu ReDDM.
- N–R
Images of representative midguts of esg ReDDM at day 7 after temperature shift of the indicated genotypes. PH3 labelling (white) detected rare mitoses in the mutant genotypes.

- A–C
Control klu ReDDM midgut and (B and C) klu ReDDM>klu‐RNAi midgut after 7 days of temperature shift. In wild‐type midguts, klu‐derived cells take on the EC fate and are negative for EE marker Pros (blue). Silencing klu via RNAi converse some klu‐derived cells towards the EE fate (RFP+ Pros+ cells, in B and C). The gut in (C) is counterstained for DAPI (Blue) and Pros is in grey. White arrow (in inset) points to an example of an old EE (Pros+). Red arrows point to examples of klu‐derived renewed EE cells with large nuclei, suggesting that maturing polyploid EB reverted to an EE fate when klu gene was silenced. Scale bar, 25 μm.
- D
Quantification of the renewed EEs in the guts of the indicated genotype (gut scored: control, n = 7; klu>klu‐RNAi, n = 10).
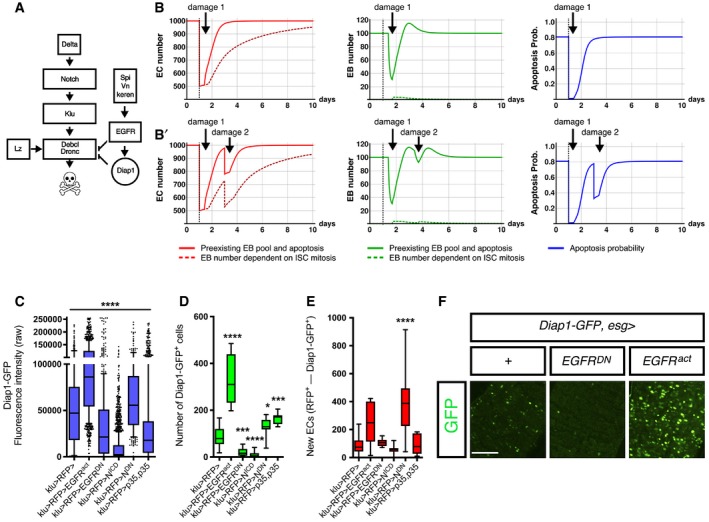
- A
A model of the regulation of physiological cell death in EC‐committed EBs based on our epistatic analysis and previous known gene interactions.
- B, B′
Number of ECs over time (left), number of EBs over time (middle) and probabilities of EB loss through apoptosis (right graph). The simulation starts with 1,000 EC cells in all figures (Appendix Supplementary Methods; Appendix Table S1). In (B), a challenge at day 1 imposes a loss of 500 EC cells (black dashed vertical line). In (B′), two successive challenges are imposed: one at day 1, reducing by half the number of ECs (as in B), and a second one at day 3, causing a loss of 200 cells.
- C
All EBs show Diap1‐GFP expression but at varying levels, consistent with EB death fate being tuned by apoptotic input counteracting survival signals.
- D
Quantification of the number of Diap1‐GFP+. Note that in p35‐expressing midguts reared in “Low”, GFP levels are not increased, consistent with the p35 protein suppressing apoptosis downstream of Diap1.
- E
Quantification of the number of newly renewed ECs in the indicated genotypes after 7 days. Increase in EB numbers and EC turnover in the EGFRact midgut reflects both suppression of EB deaths and the non‐autonomous stimulation of ISC in this background.
- F
Representative images acquired using the same laser intensity are shown for Diap1‐GFP in the indicated illustrative examples. Scale bar, 100 μm.
Similar articles
-
Overexpression of dJmj differentially affects intestinal stem cells and differentiated enterocytes.Cell Signal. 2018 Jan;42:194-210. doi: 10.1016/j.cellsig.2017.10.017. Epub 2017 Nov 2. Cell Signal. 2018. PMID: 29102770
-
InR and Pi3K maintain intestinal homeostasis through STAT/EGFR and Notch signaling in enteroblasts.J Cell Biochem. 2024 Jun;125(6):e30545. doi: 10.1002/jcb.30545. Epub 2024 Mar 4. J Cell Biochem. 2024. PMID: 38436545
-
Phosphorylated Groucho delays differentiation in the follicle stem cell lineage by providing a molecular memory of EGFR signaling in the niche.Development. 2016 Dec 15;143(24):4631-4642. doi: 10.1242/dev.143263. Epub 2016 Nov 11. Development. 2016. PMID: 27836963 Free PMC article.
-
[Main components of gene network controlling development of dorsal appendages of egg chorion in Drosophila melanogaster].Ontogenez. 2012 May-Jun;43(3):163-74. Ontogenez. 2012. PMID: 22834131 Review. Russian.
-
Inhibitor of apoptosis proteins in Drosophila: gatekeepers of death.Apoptosis. 2009 Aug;14(8):950-60. doi: 10.1007/s10495-009-0358-2. Epub 2009 Jun 3. Apoptosis. 2009. PMID: 19495985 Review.
Cited by
-
Non-apoptotic caspase activation preserves Drosophila intestinal progenitor cells in quiescence.EMBO Rep. 2020 Dec 3;21(12):e48892. doi: 10.15252/embr.201948892. Epub 2020 Nov 1. EMBO Rep. 2020. PMID: 33135280 Free PMC article.
-
The septate junction component bark beetle is required for Drosophila intestinal barrier function and homeostasis.iScience. 2023 May 19;26(6):106901. doi: 10.1016/j.isci.2023.106901. eCollection 2023 Jun 16. iScience. 2023. PMID: 37332603 Free PMC article.
-
Steroid hormone-induced wingless ligands tune female intestinal size in Drosophila.Nat Commun. 2025 Jan 6;16(1):436. doi: 10.1038/s41467-024-55664-2. Nat Commun. 2025. PMID: 39762218 Free PMC article.
-
The MicroRNA miR-277 Controls Physiology and Pathology of the Adult Drosophila Midgut by Regulating the Expression of Fatty Acid β-Oxidation-Related Genes in Intestinal Stem Cells.Metabolites. 2022 Mar 31;12(4):315. doi: 10.3390/metabo12040315. Metabolites. 2022. PMID: 35448502 Free PMC article.
-
Hyperdiploid acute lymphoblastic leukemia in children with LZTR1 germline variants.Hemasphere. 2024 Jan 26;8(1):e26. doi: 10.1002/hem3.26. eCollection 2024 Jan. Hemasphere. 2024. PMID: 38434521 Free PMC article. No abstract available.
References
-
- Baehrecke EH (2002) How death shapes life during development. Nat Rev Mol Cell Biol 3: 779–787 - PubMed
Publication types
MeSH terms
Substances
Grants and funding
- AECC CICPF16001DOMÍ/Fundación Científica Asociación Española Contra el Cáncer (AECC)/International
- Foundation Botin/International
- MICCIN BFU2015-64239-R/MEC|Consejo Superior de Investigaciones Científicas (CSIC)/International
- SEV-2013-0317/Ministerio de Economía y Competitividad (MEC)/International
- R01 GM084947/GM/NIGMS NIH HHS/United States
LinkOut - more resources
Full Text Sources
Medical
Molecular Biology Databases
Research Materials
Miscellaneous
