. 2020 Mar 16;21(6):836-844.
doi: 10.1002/cbic.201900510. Epub 2019 Dec 2.

A Method for High-Throughput Measurements of Viscosity in Sub-micrometer-Sized Membrane Systems

Affiliations

A Method for High-Throughput Measurements of Viscosity in Sub-micrometer-Sized Membrane Systems

Grzegorz Chwastek et al. Chembiochem. .

Abstract

To unravel the underlying principles of membrane adaptation in small systems like bacterial cells, robust approaches to characterize membrane fluidity are needed. Currently available relevant methods require advanced instrumentation and are not suitable for high-throughput settings needed to elucidate the biochemical pathways involved in adaptation. We developed a fast, robust, and financially accessible quantitative method to measure the microviscosity of lipid membranes in bulk suspension using a commercially available plate reader. Our approach, which is suitable for high-throughput screening, is based on the simultaneous measurements of absorbance and fluorescence emission of a viscosity-sensitive fluorescent dye, 9-(2,2-dicyanovinyl)julolidine (DCVJ), incorporated into a lipid membrane. We validated our method using artificial membranes with various lipid compositions over a range of temperatures and observed values that were in good agreement with previously published results. Using our approach, we were able to detect a lipid phase transition in the ruminant pathogen Mycoplasma mycoides.

Keywords: bacteria; high-throughput screening; lipid membranes; spectroscopy; viscosity.


Conflict of interest statement

The authors declare no conflict of interest.

Figures

Figure 1
Figure 1
Chemical structure of 9‐(2,2‐dicyanovinyl)julolidine (DCVJ).
Figure 2
Figure 2
Absorbance and fluorescence emission spectra of DCVJ in glycerol and ethylene glycol at 18 °C. At the same dye concentration, absorbance spectra are virtually identical. In contrast, fluorescence emission depends strongly on the viscosity of the solvent, and under the same experimental conditions, a substantial increase in the fluorescence intensity is observed in more viscous glycerol.
Figure 3
Figure 3
Relative brightness of DCVJ in solvents of different viscosity. Viscosity of glycerol and ethylene glycol was varied by changing the temperature. Mixtures of glycerol and methanol at various ratios were measured at constant temperature (22 °C). The line shows the power law fit.
Figure 4
Figure 4
Viscosity of lipid membrane composed of DOPC and DOPC/cholesterol 6:4. Viscosity data are shown with a fit using the Arrhenius law (line). The activation energies were 54±9 and 63±8 kJ mol−1 for pure and cholesterol doped DOPC membrane, respectively.
Figure 5
Figure 5
Membrane viscosity variation in response to lipid saturation. Viscosity data are shown along with a fit by the Arrhenius dependence (line). The activation energies of the membrane viscosity are 52±13, 54±9 and 68±8 kJ mol−1 for DLPC, DOPC and SOPC liposomes, respectively.
Figure 6
Figure 6
Viscosity of SOPC and POPC lipid membrane (symbols) along with their fits using the Arrhenius law (lines). Activation energies are 53±10 and 68±8 kJ mol−1 for POPC and SOPC vesicles, respectively.
Figure 7
Figure 7
Influence of temperature on viscosity of native lipid membranes from M. mycoides grown at 30 and 37 °C (n=5). For comparison, viscosities (symbols) of Ld (POPC/cholesterol 1:1) and Lo (DPPC/cholesterol 1:1) membranes are plotted with corresponding fit of the Arrhenius law (lines).
Figure 8
Figure 8
Correction of the absorption spectrum of DCVJ‐labeled liposome suspension. Spectra of the sample after consecutive steps of the analysis are shown with solid lines: raw spectrum of DCVJ in liposomes (light gray), result of subtraction of the spectrum of pure buffer from the raw spectrum of the sample (gray) and the resulting “clean” spectrum of DCVJ (black). The dashed line depicts the power‐law fit of the scattering background of the sample; the dash‐dotted line is the spectrum of the pure buffer. Lipid: DOPC. Temperature: 25 °C.
Figure 9
Figure 9
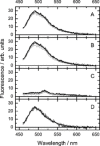
Correction of the fluorescence spectrum of DCVJ‐labeled liposome suspension. The Figure shows spectra collected from samples located on five different rows of the multi‐well plate (each shade of grey corresponds to a different row). A) Raw fluorescence spectra, B) fluorescence spectra shifted by constant offset, C) fluorescence background containing the Raman peak of water recorded from the blank sample; D) “pure” fluorescence spectrum of DCVJ produced by subtracting the spectrum displayed in (C) from that in (B). Lipid: DOPC. T=25 °C.
Figure 10
Figure 10
Normalized absorbance of the DCVJ as a function of the normalized contribution of scattering of light on liposomes to the absorption spectrum upon progressive removal of liposomes from the original sample. Circles: original sample and samples produced from it by three consecutive ultracentrifugation steps. Square: sample produced by ultrafiltration of the original sample. Lipid: DOPC. T=25 °C.

References

    1. Sinensky M., Proc. Natl. Acad. Sci. USA 1974, 71, 522–525. - PMC - PubMed
    1. Nakayama H., Ohki K., Mistsui T., Nozawa Y., Biochim. Biophys. Acta 1984, 769, 311–316. - PubMed
    1. Avery S. V., Lloyd D., Harwood J. L., Biochem. J. 1995, 312, 811–816. - PMC - PubMed
    1. van de Vossenberg J. L. C. M., Driessen A. J. M., da Costa M. S., Konings W. N., Biochim. Biophys. Acta Biomembr. 1999, 1419, 97–104. - PubMed
    1. Kaye J. Z., Baross J. A., Appl. Environ. Microbiol. 2004, 70, 6220–6229. - PMC - PubMed

Publication types

LinkOut - more resources