

Trisomy 13 and 18-Prevalence and mortality-A multi-registry population based analysis
- PMID: 31566869
- PMCID: PMC6848757
- DOI: 10.1002/ajmg.a.61365
Trisomy 13 and 18-Prevalence and mortality-A multi-registry population based analysis
Abstract
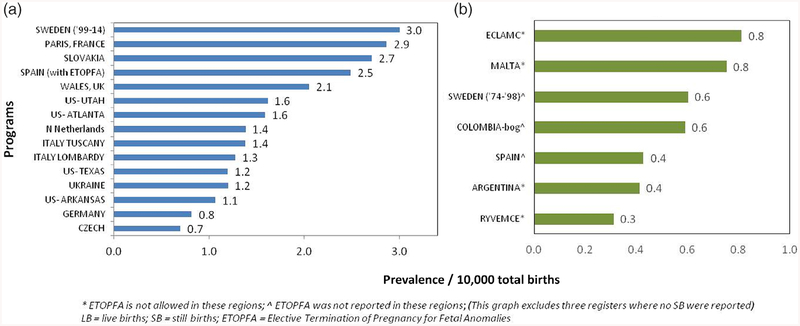
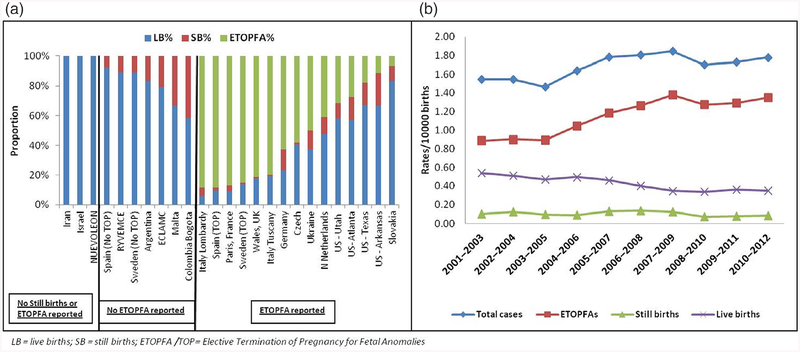
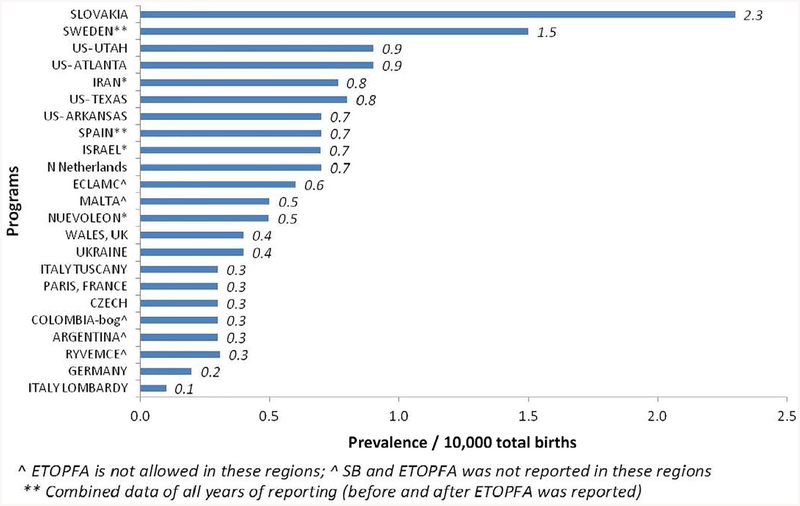
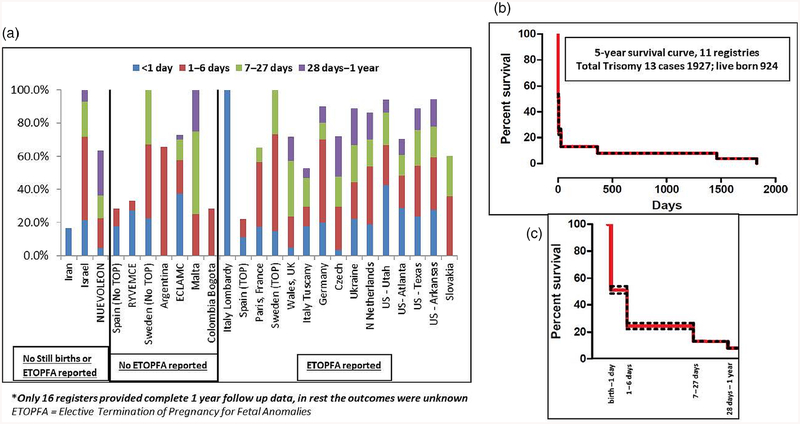
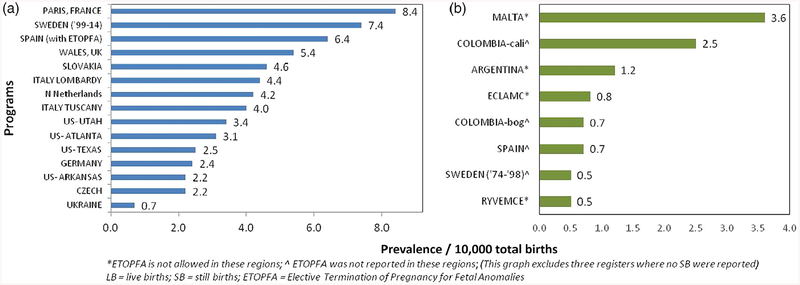
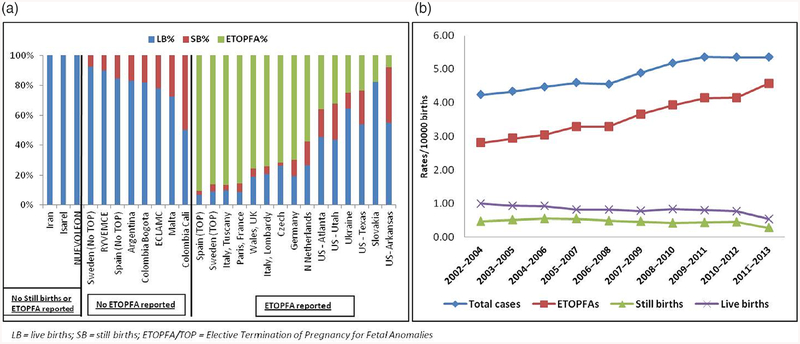
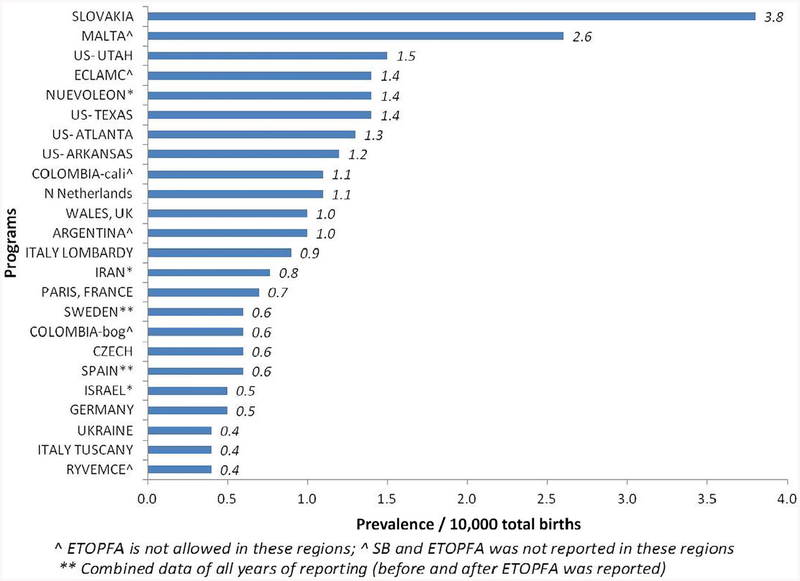
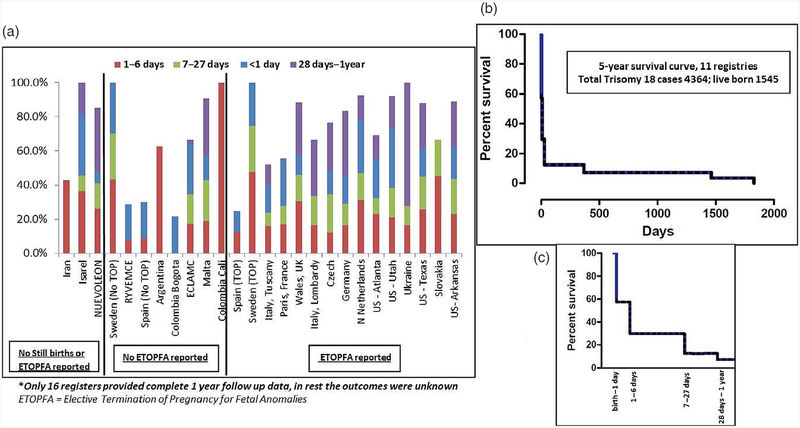
The aim of the study is to determine the prevalence, outcomes, and survival (among live births [LB]), in pregnancies diagnosed with trisomy 13 (T13) and 18 (T18), by congenital anomaly register and region. Twenty-four population- and hospital-based birth defects surveillance registers from 18 countries, contributed data on T13 and T18 between 1974 and 2014 using a common data-reporting protocol. The mean total birth prevalence (i.e., LB, stillbirths, and elective termination of pregnancy for fetal anomalies [ETOPFA]) in the registers with ETOPFA (n = 15) for T13 was 1.68 (95% CI 1.3-2.06), and for T18 was 4.08 (95% CI 3.01-5.15), per 10,000 births. The prevalence varied among the various registers. The mean prevalence among LB in all registers for T13 was 0.55 (95%CI 0.38-0.72), and for T18 was 1.07 (95% CI 0.77-1.38), per 10,000 births. The median mortality in the first week of life was 48% for T13 and 42% for T18, across all registers, half of which occurred on the first day of life. Across 16 registers with complete 1-year follow-up, mortality in first year of life was 87% for T13 and 88% for T18. This study provides an international perspective on prevalence and mortality of T13 and T18. Overall outcomes and survival among LB were poor with about half of live born infants not surviving first week of life; nevertheless about 10% survived the first year of life. Prevalence and outcomes varied by country and termination policies. The study highlights the variation in screening, data collection, and reporting practices for these conditions.
Keywords: Edwards syndrome; Patau syndrome; congenital anomaly register; trisomies; trisomy 13; trisomy 18.
© 2019 Wiley Periodicals, Inc.
Conflict of interest statement
CONFLICT OF INTEREST
The authors declare no potential conflict of interest.
Figures
Comment in
-
Emerging evidence that medical and surgical interventions improve the survival and outcome in the trisomy 13 and 18 syndromes.Am J Med Genet A. 2020 Jan;182(1):13-14. doi: 10.1002/ajmg.a.61370. Epub 2019 Oct 14. Am J Med Genet A. 2020. PMID: 31609083 No abstract available.
References
-
- ICBDSR. (2014). Annual report. Retrieved from http://www.icbdsr.org/wpcontent/annual_report/Report2014.pdf.
Publication types
MeSH terms
Grants and funding
LinkOut - more resources
Full Text Sources
