

Plasma Proteome Profiling to detect and avoid sample-related biases in biomarker studies
- PMID: 31566909
- PMCID: PMC6835559
- DOI: 10.15252/emmm.201910427
Plasma Proteome Profiling to detect and avoid sample-related biases in biomarker studies
Abstract
Plasma and serum are rich sources of information regarding an individual's health state, and protein tests inform medical decision making. Despite major investments, few new biomarkers have reached the clinic. Mass spectrometry (MS)-based proteomics now allows highly specific and quantitative readout of the plasma proteome. Here, we employ Plasma Proteome Profiling to define quality marker panels to assess plasma samples and the likelihood that suggested biomarkers are instead artifacts related to sample handling and processing. We acquire deep reference proteomes of erythrocytes, platelets, plasma, and whole blood of 20 individuals (> 6,000 proteins), and compare serum and plasma proteomes. Based on spike-in experiments, we determine sample quality-associated proteins, many of which have been reported as biomarker candidates as revealed by a comprehensive literature survey. We provide sample preparation guidelines and an online resource ( www.plasmaproteomeprofiling.org) to assess overall sample-related bias in clinical studies and to prevent costly miss-assignment of biomarker candidates.
Keywords: biomarker discovery; mass spectrometry; plasma proteomics; sample quality; study design.
© 2019 The Authors. Published under the terms of the CC BY 4.0 license.
Conflict of interest statement
The authors declare that they have no conflict of interest.
Figures
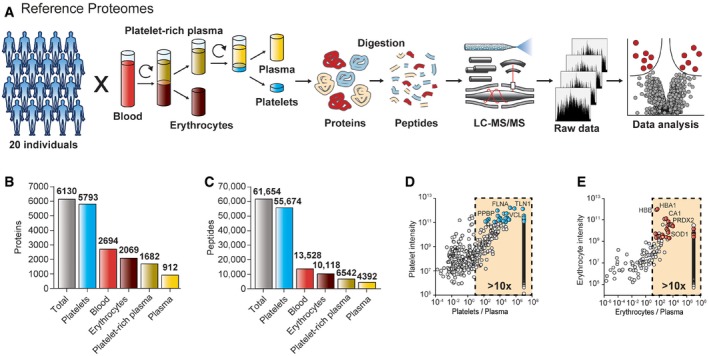
- A
Study outline and proteomic workflow. Erythrocytes, thrombocytes, platelet‐rich, and platelet‐free plasma were generated from 10 healthy female and male individuals by differential centrifugation and successive purification steps. To generate reference proteomes for each of the blood compartments, the respective protein samples of the 20 study participates were digested to peptides.
- B, C
Proteins (B) and peptides (C) identified for platelets, erythrocytes, platelet‐rich, and platelet‐free plasma.
- D, E
Selection of the most suitable quality marker proteins for (D) platelet contamination (blue dots) and (E) erythrocyte contamination (red dots) based on their abundance, the platelet/erythrocyte‐to‐plasma ratio, and the coefficient of variation. Proteins that were only detected in platelets or erythrocytes, but not in plasma are aligned on the right side of the graph.
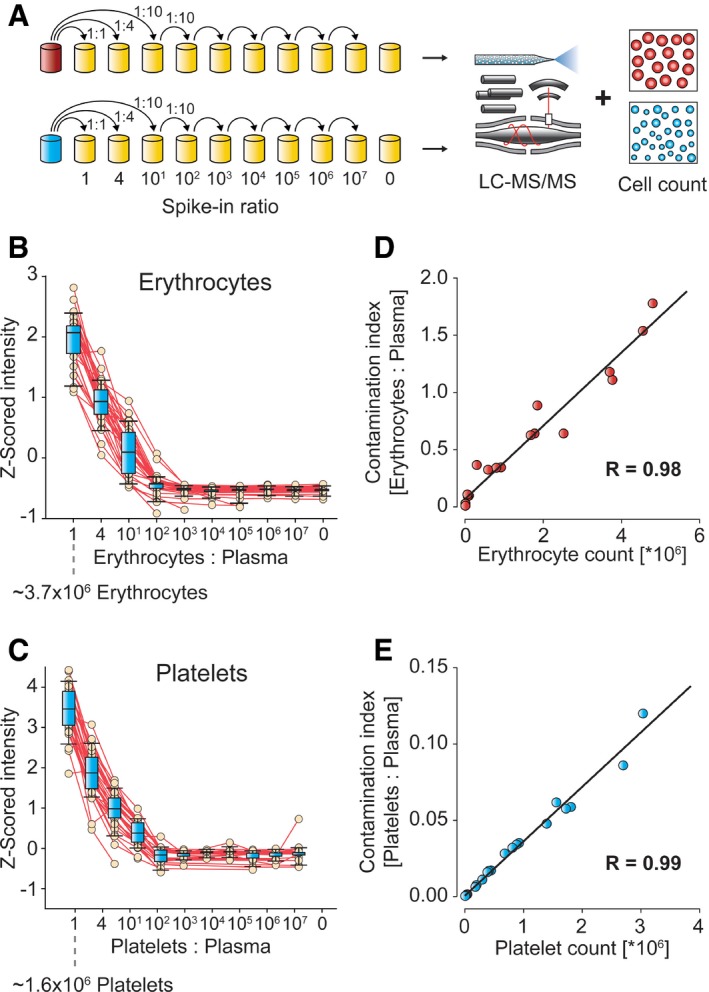
- A
Dilution and analysis scheme.
- B, C
Protein intensities were Z‐scored across the dilution series (B) for the 29 quality markers of the erythrocyte panel and (C) for the 29 markers of the platelet panel as a function of their spike‐in proportion to plasma. Whiskers indicate 10–90 percentiles, and horizontal lines denote the mean.
- D
Correlation of erythrocyte count to the “contamination index” for the erythrocyte marker panel.
- E
Correlation of platelet count to contamination index for the platelet marker panel.
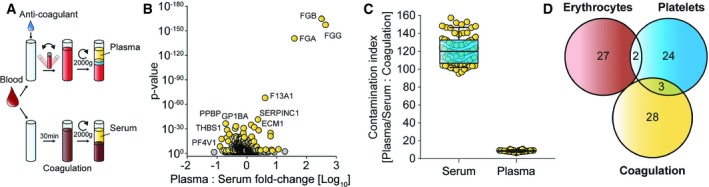
- A
Preparation of plasma and serum samples. EDTA was used as anticoagulation agent, and incubation and centrifugation values are indicated.
- B
Volcano plot comparing 72 plasma vs. 72 serum proteomes. Proteins highlighted in yellow were chosen according to their P‐value as markers for coagulation. Only the plasma‐enriched proteins (compared to serum) were used in the calculation of the coagulation contamination index.
- C
Ratio of the summed intensities of all plasma or serum proteins to the sum of the plasma‐enriched panel proteins is plotted for all samples. Whiskers indicate the 10–90 percentile, and horizontal lines denote the mean.
- D
Overlap of the three quality marker panels.
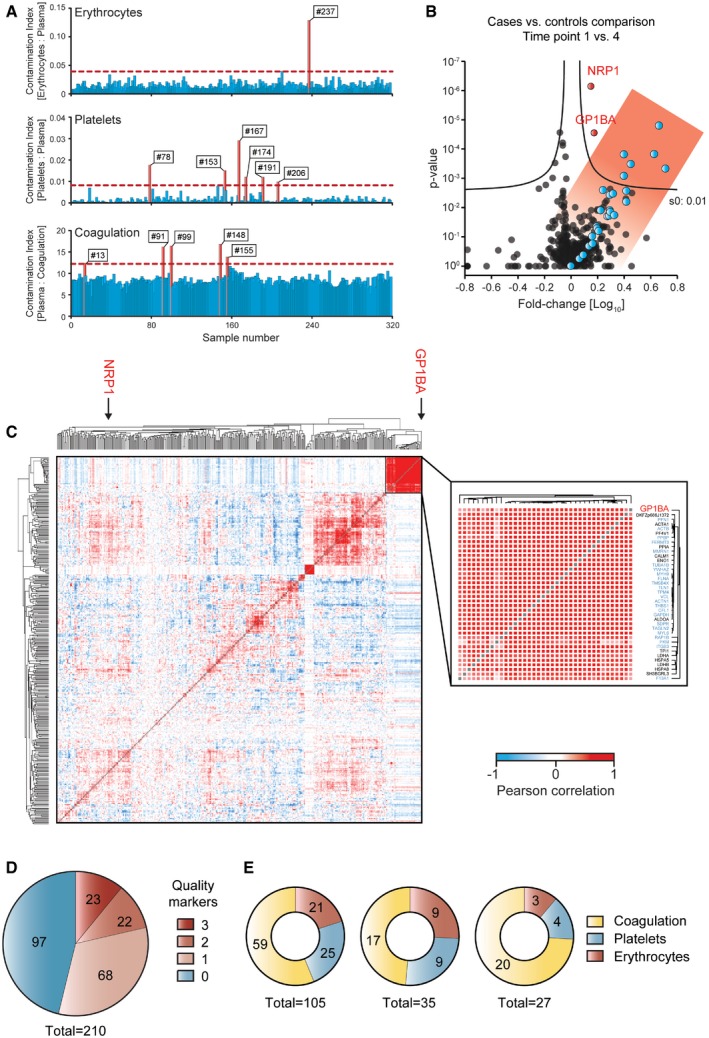
- A
Assessment of individual sample quality with respect to the three contamination indices using the online tool at
www.plasmaproteomeprofiling.org . Samples with indices that are more than two standard deviations from the mean (horizontal red lines) are flagged as potentially contaminated (red bars and sample numbers). - B
Volcano plot of the proteome comparison of time point 1 vs. 4. Proteins of the platelet panel are highlighted in blue and two additional significantly regulated proteins in red.
- C
Global correlation map on the left with an inset of the platelet cluster on the right. The two significant outliers of the volcano plot in (B) are marked in red. Platelet panel proteins are highlighted in blue in the inset. Red patches in the global correlation map indicate positive and blue patches negative correlations.
- D
Literature analysis of 210 publications using MS‐based plasma proteomics to identify new biomarkers. The number of quality markers reported as biomarker candidates in these studies is indicated.
- E
Distribution of the reported quality markers according to the three types of likely contaminations. The distribution is shown across studies that report one, two, or three proteins of the same quality marker panel.
References
-
- Aebersold R, Mann M (2003) Mass spectrometry‐based proteomics. Nature 422: 198–207 - PubMed
-
- Aebersold R, Mann M (2016) Mass‐spectrometric exploration of proteome structure and function. Nature 537: 347–355 - PubMed
-
- Albrechtsen NJW, Geyer PE, Doll S, Bojsen‐Moller KN, Martinussen C, Torekov SS, Keilhauer E, Treit PV, Meier F, Holst JJ et al (2018) Plasma proteome profiling reveals dynamics of inflammatory and lipid homeostasis markers after Roux‐en‐Y gastric bypass surgery. Cell Syst 7: 601–612 e3 - PubMed
-
- Anderson NL, Ptolemy AS, Rifai N (2013) The riddle of protein diagnostics: future bleak or bright? Clin Chem 59: 194–197 - PubMed
Publication types
MeSH terms
Substances
Grants and funding
LinkOut - more resources
Full Text Sources
Other Literature Sources
