Multicenter Study
. 2019 Oct;114(10):1614-1625.
doi: 10.14309/ajg.0000000000000371.

One-Hour Esophageal String Test: A Nonendoscopic Minimally Invasive Test That Accurately Detects Disease Activity in Eosinophilic Esophagitis

Affiliations
Multicenter Study

One-Hour Esophageal String Test: A Nonendoscopic Minimally Invasive Test That Accurately Detects Disease Activity in Eosinophilic Esophagitis

Steven J Ackerman et al. Am J Gastroenterol. 2019 Oct.

Abstract

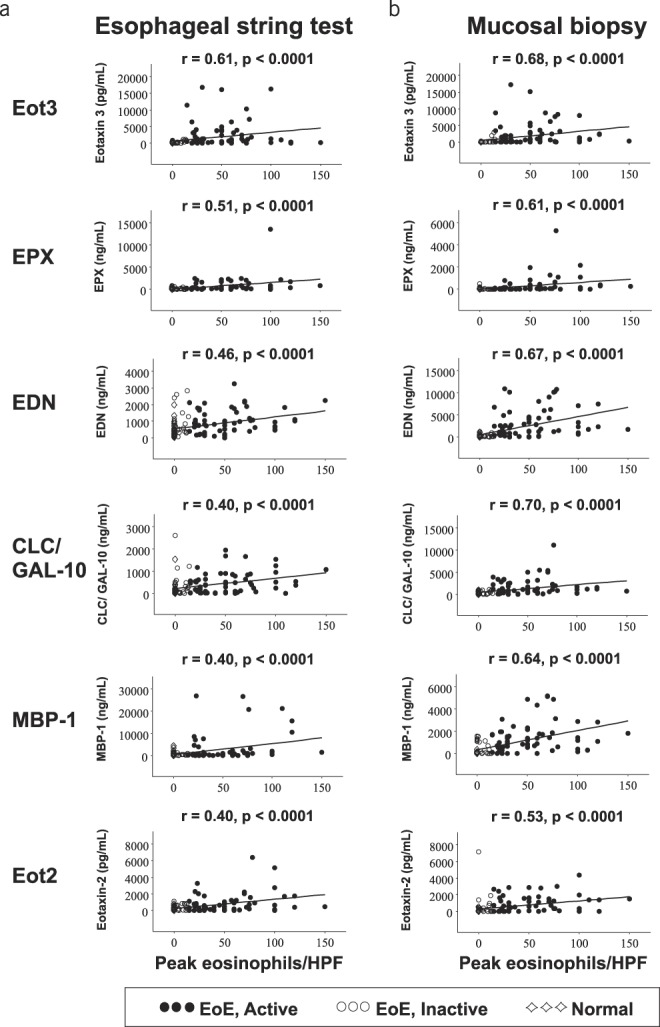
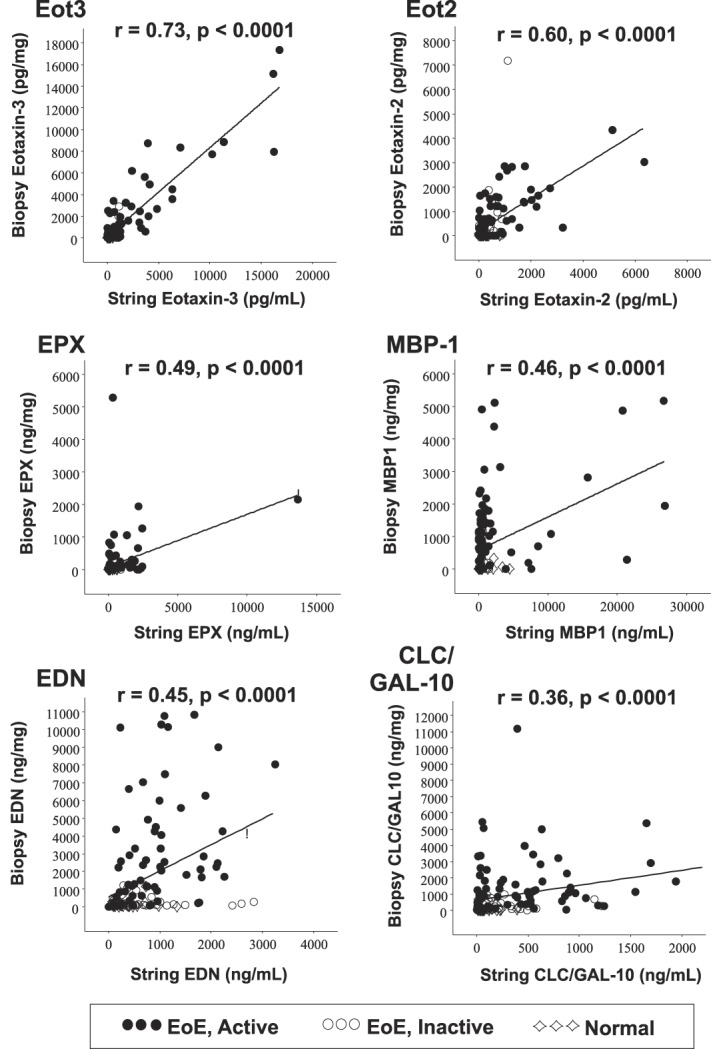
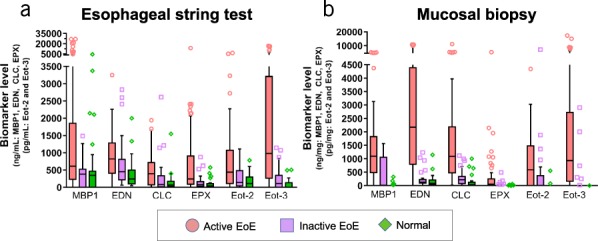
Objectives: Eosinophilic esophagitis (EoE), a chronic food allergic disease, lacks sensitive and specific peripheral biomarkers. We hypothesized that levels of EoE-related biomarkers captured using a 1-hour minimally invasive Esophageal String Test (EST) would correlate with mucosal eosinophil counts and tissue concentrations of these same biomarkers. We aimed to determine whether a 1-hour EST accurately distinguishes active from inactive EoE or a normal esophagus.

Methods: In a prospective, multisite study, children and adults (ages 7-55 years) undergoing a clinically indicated esophagogastroduodenoscopy performed an EST with an esophageal dwell time of 1 hour. Subjects were divided into 3 groups: active EoE, inactive EoE, and normal esophageal mucosa. Eosinophil-associated protein levels were compared between EST effluents and esophageal biopsy extracts. Statistical modeling was performed to select biomarkers that best correlated with and predicted eosinophilic inflammation.

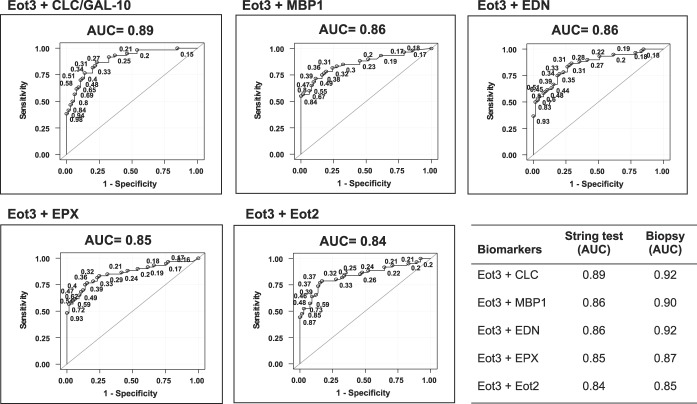
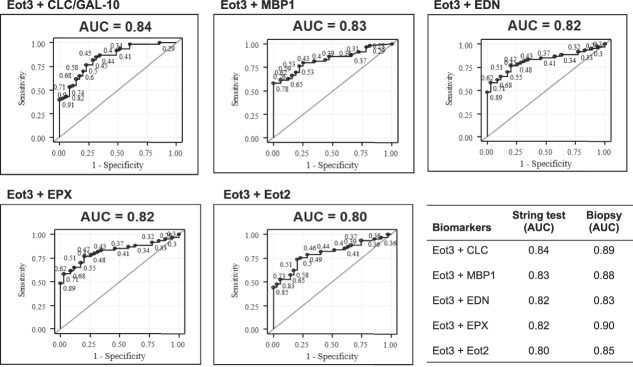
Results: One hundred thirty-four subjects (74 children, 60 adults) with active EoE (n = 62), inactive EoE (n = 37), and patient controls with a normal esophagus (n = 35) completed the study. EST-captured eosinophil-associated biomarkers correlated significantly with peak eosinophils/high-power field, endoscopic visual scoring, and the same proteins extracted from mucosal biopsies. Statistical modeling, using combined eotaxin-3 and major basic protein-1 concentrations, led to the development of EoE scores that distinguished subjects with active EoE from inactive EoE or normal esophagi. Eighty-seven percent of children, 95% of parents, and 92% of adults preferred the EST over endoscopy if it provided similar information.

Discussion: The 1-hour EST accurately distinguishes active from inactive EoE in children and adults and may facilitate monitoring of disease activity in a safe and minimally invasive fashion.


Figures

Figure 1.
Figure 1.
Eosinophil-associated biomarkers in EST and biopsy extract samples correlate with peak histologic eosinophil counts. Spearman analyses correlating EST samples (left panel) and biopsy extracts (right panel) with peak eosinophils/HPF were performed. Spearman rank correlation coefficients (r) and associated P-values are shown. Symbols denote subjects with (●) EoE, active; (◯) EoE, inactive; (◇) normal esophagus. CLC/GAL-10, Charcot-Leyden crystal protein/Galectin-10; EDN, eosinophil-derived neurotoxin; EoE, eosinophilic esophagitis; eos/HPF, eosinophils/high-power field; Eot2, eotaxin 2; Eot3, eotaxin 3; EPX, eosinophil peroxidase; EST, esophageal string test; MBP-1, eosinophil granule major basic protein 1.
Figure 2.
Figure 2.
Eosinophil-associated biomarkers captured by the EST are significantly correlated with those measured in esophageal mucosal biopsies. Spearman rank correlation coefficients (r) and associated P-values are shown. Symbols denote subjects with (●) EoE, active; (◯) EoE, inactive; (◇) normal esophagus. CLC/GAL-10, Charcot-Leyden crystal protein/Galectin-10; EDN, eosinophil-derived neurotoxin; EoE, eosinophilic esophagitis; Eot2, eotaxin 2; Eot3, eotaxin 3; EPX, eosinophil peroxidase; EST, esophageal string test; MBP-1, eosinophil granule major basic protein 1.
Figure 3.
Figure 3.
Luminal concentrations of eosinophil-associated biomarkers measured in EST samples differentiate subjects with active EoE, inactive EoE, or normal esophagus. Biomarkers were measured by ELISA in EST and mucosal biopsy samples. Levels in biopsy extracts were normalized to total protein content and are reported as ng biomarker/mg total protein. Biomarker levels in EST samples are reported as ng/mL of EST supernatant. Results are presented as box/whisker plots where the horizontal line and diamond inside the box are median and mean values, respectively; the box is the interquantiles; the lower and upper ends of whiskers are 5th and 95th percentiles, respectively; and symbols are data points with extreme values. Differences in protein biomarker levels across patient groups were compared using nonparametric ANOVA (refer to Supplemental Table S1 for P-values, see Supplementary Digital Content 1, http://links.lww.com/AJG/B281). CLC, Charcot-Leyden crystal protein; EoE, eosinophilic esophagitis; EDN, eosinophil-derived neurotoxin; Eot2, eotaxin 2; Eot3, eotaxin 3; EPX, eosinophil peroxidase; EST, esophageal string test; MBP-1, eosinophil granule major basic protein 1.
Figure 4.
Figure 4.
ROC curves show significant sensitivity and specificity for identifying active EoE (≥15 Eos/hpf) among all patients (active or inactive EoE, or normal esophagus). ROC analyses used the level of Eot3 plus one additional biomarker as indicated captured by the 1-hour EST or measured in mucosal biopsy extracts (lower right panel; see Figure S2, Supplementary Digital Content 1, http://links.lww.com/AJG/B281). Results are shown for Eot3, Eot3 plus CLC (Gal-10), Charcot-Leyden crystal protein/Galectin-10; MBP-1, EDN, eosinophil-derived neurotoxin; EPX, eosinophil peroxidase; and Eot2, eotaxin 2. Points on the ROC curves are labeled by their predictive probabilities. The AUC is indicated above each panel; AUC values >0.80 are considered highly predictive. The table (lower right panel) shows the comparative AUC values for the 1-hour EST vs mucosal biopsy extracts for the indicated biomarker combinations. AUC, area under the curve; CLC, Charcot-Leyden crystal protein; EoE, eosinophilic esophagitis; EDN, eosinophil-derived neurotoxin; Eot2, eotaxin 2; Eot3, eotaxin 3; EPX, eosinophil peroxidase; MBP-1, eosinophil granule major basic protein 1; ROC, receiver operating characteristic.
Figure 5.
Figure 5.
ROC curves distinguish subjects with active EoE (≥15 Eos/hpf) from inactive EoE (<15 Eos/hpf). ROC analyses used the level of Eot3 plus one additional biomarker captured by the 1-hour EST or measured in mucosal biopsy extracts (lower right panel; see Figure S3, Supplementary Digital Content 1, http://links.lww.com/AJG/B281). Results are shown for Eot3, Eot3 plus CLC (Gal-10), Charcot-Leyden crystal protein/galectin-10; MBP-1, major basic protein-1; EPX, eosinophil peroxidase; EDN, eosinophil-derived neurotoxin; and Eot2, eotaxin 2. Points on the ROC curves are labeled by their predictive probabilities. The AUC is indicated above each panel; AUC values >0.80 are considered highly predictive. The table (lower right panel) shows the comparative AUC values for the 1-hour EST vs mucosal biopsy extracts for the indicated biomarker combinations. AUC, area under the curve; CLC/GAL-10, Charcot-Leyden crystal protein/Galectin-10; EoE, eosinophilic esophagitis; EDN, eosinophil-derived neurotoxin; Eot2, eotaxin 2; Eot3, eotaxin 3; EPX, eosinophil peroxidase; MBP-1, eosinophil granule major basic protein 1; ROC, receiver operating characteristic.

Similar articles

Cited by

References

    1. Furuta GT, Katzka DA. Eosinophilic esophagitis. N Engl J Med 2015;373:1640–8. - PMC - PubMed
    1. Dellon ES, Hirano I. Epidemiology and natural history of eosinophilic esophagitis. Gastroenterology 2018;154:319–32. - PMC - PubMed
    1. O'Shea KM, Aceves SS, Dellon ES, et al. Pathophysiology of eosinophilic esophagitis. Gastroenterology 2018;154:333–45. - PMC - PubMed
    1. Straumann A, Katzka DA. Diagnosis and treatment of eosinophilic esophagitis. Gastroenterology 2018;154:346–59. - PubMed
    1. Schoepfer AM, Straumann A, Safroneeva E. Pharmacologic treatment of eosinophilic esophagitis: An update. Gastrointest Endosc Clin N Am 2018;28:77–88. - PubMed

Publication types

MeSH terms