. 2019 Sep 30;15(9):e1008415.
doi: 10.1371/journal.pgen.1008415. eCollection 2019 Sep.

Cytoneme-mediated signaling essential for tumorigenesis

Affiliations

Cytoneme-mediated signaling essential for tumorigenesis

Sol Fereres et al. PLoS Genet. .

Abstract

Communication between neoplastic cells and cells of their microenvironment is critical to cancer progression. To investigate the role of cytoneme-mediated signaling as a mechanism for distributing growth factor signaling proteins between tumor and tumor-associated cells, we analyzed EGFR and RET Drosophila tumor models and tested several genetic loss-of-function conditions that impair cytoneme-mediated signaling. Neuroglian, capricious, Irk2, SCAR, and diaphanous are genes that cytonemes require during normal development. Neuroglian and Capricious are cell adhesion proteins, Irk2 is a potassium channel, and SCAR and Diaphanous are actin-binding proteins, and the only process to which they are known to contribute jointly is cytoneme-mediated signaling. We observed that diminished function of any one of these genes suppressed tumor growth and increased organism survival. We also noted that EGFR-expressing tumor discs have abnormally extensive tracheation (respiratory tubes) and ectopically express Branchless (Bnl, a FGF) and FGFR. Bnl is a known inducer of tracheation that signals by a cytoneme-mediated process in other contexts, and we determined that exogenous over-expression of dominant negative FGFR suppressed tumor growth. Our results are consistent with the idea that cytonemes move signaling proteins between tumor and stromal cells and that cytoneme-mediated signaling is required for tumor growth and malignancy.


Conflict of interest statement

The authors declare that no competing interests exist.

Figures

Fig 1
Fig 1. Cytonemes in EGFR-Pcni tumor and tumor-associated cells.
(A) Cartoon of a 3rd instar larval wing disc with wing blade primordia (wbp), disc-associated myoblasts (orange), trachea (white, outlined in blue) and air sac primordium (ASP), Dpp expressing cells (green stripe), Bnl expressing cells (blue circle). (B) Control wing disc expressing CD8:GFP in dorsal driven epithelial cells (ap-Gal4; green), and mCherry:CAAX in myoblasts ((15B03-lexA; red). (C) Schematic representation of tumor induction: animals developed for five days at 18°C with Gal4 repressed by Gal80, were transferred to 29°C to induce Gal4 and tumor growth for seven days (unless indicated otherwise). (D-F) Unfixed EGFR-Pcn tumor model wing discs. (D) Wing disc with tumor cells (CD8:GFP; green) and myoblasts (mCherry:CAAX; red). Genotype: ap-Gal4,UAS-psqRNAi/115B03-lexA,lexO-Cherry-CAAX;UAS-EGFR,tub-Gal80ts/UAS-CD8:GFP. Scale bars: 100μm. (E) Cytonemes in the tumor epithelial cells (green, arrows); genotype: ap-Gal4,UAS-psqRNAi/+;UAS-EGFR,tub-Gal80ts/UAS-CD8:GFP. (F-F’) Cytonemes in myoblasts (red, arrows) extend towards epithelial cells (green); genotype: ap-Gal4,UAS-psqRNAi/115B03-lexA,lexO-Cherry-CAAX;UAS-EGFR,tub-Gal80ts/UAS-CD8:GFP; scale bars: 50μm. (G-H) Unfixed wing discs with marked tracheal cells (green, arrows); (G) control, genotype: btl-LHG,lexO-CD2-GFP; (H) EGFR-Pcn tumor, genotype: ap-Gal4,UAS-psqRNAi/btl-LHG,lexO-CD2-GFP;UAS-EGFR,tub-Gal80ts/+. Excessive tracheal growth and ectopic branches indicated by arrows; scale bars: 100μm.
Fig 2
Fig 2. Dpp signaling in the EGFR-Pcn tumor model.
(A,A’,B) Unfixed wing discs showing the Dpp distribution. (A) Control disc with Dpp (red, arrow). Genotype: Dpp:mCherry. Scale bar: 100μm. (A’) Disc with EGFR-Pcn tumor induced for 5 days expressing Dpp (red) in tumor cells. Genotype: ap-Gal4,UAS-psqRNAi/Dpp:mCherry;UAS-EGFR,tub-Gal80ts/UAS-CD8:GFP. Arrows indicate Dpp up-regulation. (A”-A”’) EGFR-Pcn wing showing epithelial tumor cells (green) fixed and stained with α-phosphorylated MAD (pMad, red) antibody to monitor Dpp signaling and α-Cut (blue) to label myoblasts. Genotype: ap-Gal4,UAS-psqRNAi/+;UAS-EGFR,tub-Gal80ts/UAS-CD8:GFP. Scale bar: 100μm. (A”’) Higher magnification image of the box area in (A”), scale bar: 50μm. (B-B”) Cytoneme (green) extending from epithelial tumor cell (green) with Dpp:mCherry (red); arrow indicates Dpp:mCherry in cytoneme. Genotype: ap-Gal4,UAS-psqRNAi/Dpp:mCherry;UAS-EGFR,tub-Gal80ts/UAS-CD8:GFP. Scale bar: 50μm.
Fig 3
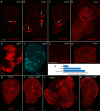
Fig 3. Conditions that ablate cytonemes decrease signaling, reduce myoblast and tumor growth.
(A-I) Fixed wing discs stained with α-phosphorylated MAD (pMad, red) antibody to monitor Dpp signaling and α-Cut (cyan) to label myoblasts. Scale bars: 100μm. (A,A’) Control. (B,B’) EGFR-Pcn tumor, genotype: ap-Gal4,UAS-psqRNAi/+;UAS-EGFR,tub-Gal80ts/UAS-CD8:GFP. (C,C’) Tumor + NrgRNAi, genotype: ap-Gal4,UAS-psqRNAi/UAS-NrgRNAi;UAS-EGFR,tub-Gal80ts/+. (D) Tumor + CapsDN, genotype:ap-Gal4,UAS-psqRNAi/UAS-CAPSDN;UAS-EGFR,tub-Gal80ts/+. (E) Tumor + SCARRNAi, genotype:ap-Gal4,UAS-psqRNAi/+;UAS-EGFR,tub-Gal80ts/UAS-SCARRNAi. (F,F’) EGFR-Pcn + diaRNAi in epithelial cells. Genotype: ap-Gal4,UAS-psqRNAi/+;UAS-EGFR,tub-Gal80ts/UAS-diaRNAi. (G) Tumor + NrgRNAi, diaRNAi, genotype: ap-Gal4,UAS-psqRNAi/UAS-NrgRNAi;UAS-EGFR,tub-Gal80ts/UAS-diaRNAi. (I-I’) EGFR-Pcn + diaRNAi expressed in the myoblasts. Genotype: ap-Gal4,UAS-psqRNAi/115B03-lexA;UAS-EGFR,tub-Gal80ts/ lexO-diaRNAi. (H) Quantification of the total wing disc area (blue) and relative area of Cut-expressing cells (orange) of control, EGFR+Pcn tumor, tumor + diaRNAi expressed in epithelial cells, diaRNAi expressed in myoblasts, NrgRNAi, SCARRNAi, CapsDN, NrgRNAi+diaRNAi, dsRNAi, ftRNAi, fjRNAi and BtlDN larvae. Data was normalized to control. Student’s t test P values (P >1.10−9 for all except no significant difference for tumor + dsRNAi, ftRNAi and fjRNAi); n = 15–20 discs for each genotype. (J-J”) Sagittal sections of fixed wing discs stained with α-Dlg antibody (red) to mark the cell’s apical compartments, Scale bar: 50μm. (J) Control. (J’) EGFR-Pcn tumor, genotype: ap-Gal4,UAS-psqRNAi/UAS-CD8:GFP;UAS-EGFR,tub-Gal80ts/+) (J”) EGFR-Pcn + diaRNAi expressed in epithelial cells, genotype: ap-Gal4,UAS-psqRNAi/+;UAS-EGFR,tub-Gal80ts/UAS-diaRNAi.
Fig 4
Fig 4. Conditions that ablate cytonemes promote survival.
(A) Cartoon of a wild type larva depicting cells expressing GFP in the imaginal disc dorsal compartments (ap-Gal4; green, arrow) and of EGFR-Pcn tumor larva with overgrowth and metastasis throughout the larva (green). (B) Survival of EGFR-Pcn tumor, tumor + diaRNAi, NrgRNAi, SCARRNAi and CapsDN larvae to pupal (blue), pharate adult (orange) and adult stage (gray). Student’s t test P values: (between P<0.05 and P >1.10−8) with n = 15–30 larvae for each genotype. (C) Control adult wing. (D) EGFR-Pcn + diaRNAi wing, genotype: ap-Gal4,UAS-psqRNAi/UAS-CD8:GFP;UAS-EGFR,tub-Gal80ts/UAS-diaRNAi.
Fig 5
Fig 5. FGF signaling in the EGFR-Pcn tumor model.
(A-B) Unfixed wing discs with Bnl-expressing cells marked with Cherry-CAAX (red, arrows). (A) Control, genotype: bnl-lexA,lexO-mCherry:CAAX/+. Scale bar: 100μm. (B) EGFR-Pcn tumor, genotype: ap-Gal4,UAS-psqRNAi/+;UAS-EGFR,tub-Gal80ts/bnl-lexA,lexO-mCherry:CAAX. Arrows indicate FGF up-regulation (red). (C-D’) Unfixed wing discs with Btl distribution marked by Btl:mCherry (red, arrows). (C) Control, genotype: Btl:mCherry/+. Btl is only expressed in the tracheal cells. Scale bar: 100μm (C’) Higher magnification image of the boxed area in (C). (D) 5 day EGFR-Pcn tumor disc, genotype: ap-Gal4,UAS-psqRNAi/UAS-CD4-mIFP;UAS-EGFR,tub-Gal80ts/Btl:mCherry. Btl expression is upregulated in the tumor cells. (D’) Higher magnification image of the box area in (D). Scale bars: 50μm. (E-F) EGFR-Pcn tumor +BtlDN fixed wing disc stained with α-phosphorylated MAD (pMad, red) antibody to monitor Dpp signaling (E) and α-Cut (cyan) to label myoblasts (F). Scale bar: 100μm. Genotype: ap-Gal4,UAS-psqRNAi/+;UAS-EGFR,tub-Gal80ts/UAS-BtlDN. (G) EGFR mRNA measured by quantitative real-time PCR. RNA was extracted from 5 discs of the indicated genotypes. Data were normalized to rp49. The data show mean ± SD from three technical replicates of a representative experiment. Significance was analyzed using Student’s t-test (p<0.001). Comparable results were obtained in 3 independent biological replicates. Genotypes are ap-Gal4,UAS-CD8:GFP (WT), ap-Gal4,UAS-psqRNAi/+;UAS-EGFR,tub-Gal80ts/ UAS-CD8:GFP (tumor) and ap-Gal4,UAS-psqRNAi/+;UAS-EGFR,tub-Gal80ts/UAS-BtlDN. (H-K) Fixed wing disc stained with α-phosphorylated ERK to monitor EGF signaling (dpERK, red). (H) Control, genotype: ap-Gal4,UAS-CD8:GFP. (I) Control+BtlDN, genotype: ap-Gal4/+;UAS-BtlDN/+. (I) EGFR-Pcn tumor disc, genotype: ap-Gal4,UAS-psqRNAi/+;UAS-EGFR,tub-Gal80ts/ UAS-CD8:GFP. EGFR-Pcn tumor + BtlDN, genotype: ap-Gal4,UAS-psqRNAi/+;UAS-EGFR,tub-Gal80ts/UAS-BtlDN.
Fig 6
Fig 6. RET-MEN2 tumor growth and survival depends on cytonemes.
(A-B’) Unfixed wing discs expressing CD8:GFP (green) driven by ptc-Gal4. Scale bar: 100μm. (A) Control. (A’) Cytonemes in wild type cells (green, arrows). Scale bar: 50μm. (B) RET tumor, genotype: ptc-Gal4,CD8:GFP;UAS-RETMEN2/UAS-CD8:GFP. (B’) Cytonemes in RET tumor cells (green, arrows). (C-E) Unfixed wing discs expressing CD8:GFP (green) and either RET + diaRNAi (C); RET + SCARRNAi (D); and RET + Irk2DN (E). (C) Genotype: ptc-Gal4,CD8:GFP;UAS-RETMEN2/UAS-diaRNAi. (D) Genotype: ptc-Gal4,CD8:GFP;UAS-RETMEN2/UAS-SCARRNAi. (E) Genotype: ptc-Gal4,CD8:GFP/Irk2DN ;UAS-RETMEN2. (F) Quantification of the area of the disc expressing GFP (% of disc) in control, RET tumor, or RET and either diaRNAi, SCARRNAi or Irk2DN. Significance was analyzed using Student’s t-test (P<1.10−5) with 15–18 discs. (G) Survival of RET-tumor and RET and either diaRNAi, SCARRNAi or Irk2DN to pupa (blue) and adult (orange). Significance using Student’s t-test for adults is (P<0.001), n = 30–40 for each genotype. (H) RET tumor, diaRNAi wing blade; genotype: ptc-Gal4,CD8:GFP;UAS-RETMEN2/UAS-diaRNAi. Arrow points to abnormal crossvein.

Similar articles

Cited by

References

    1. Hanahan D, Weinberg RA. The hallmarks of cancer. Cell. 2000;100: 57–70. 10.1016/s0092-8674(00)81683-9 - DOI - PubMed
    1. Roswall P, Bocci M, Bartoschek M, Li H, Kristiansen G, Jansson S, et al. Microenvironmental control of breast cancer subtype elicited through paracrine platelet-derived growth factor-CC signaling. Nature Medicine. 2018;24: 463–473. 10.1038/nm.4494 - DOI - PMC - PubMed
    1. Pietras K, Östman A. Hallmarks of cancer: Interactions with the tumor stroma. Experimental Cell Research. 2010. pp. 1324–1331. 10.1016/j.yexcr.2010.02.045 - DOI - PubMed
    1. Sonoshita M, Cagan RL. Modeling Human Cancers in Drosophila. Current topics in developmental biology. 2017. pp. 287–309. 10.1016/bs.ctdb.2016.07.008 - DOI - PubMed
    1. Huang H, Liu S, Kornberg TB. Glutamate signaling at cytoneme synapses. Science. 2019;363: 948–955. 10.1126/science.aat5053 - DOI - PMC - PubMed

Publication types

MeSH terms

Substances