Comparative Study
. 2019 Sep 30;13(9):e0007723.
doi: 10.1371/journal.pntd.0007723. eCollection 2019 Sep.

Mapping Schistosoma mansoni endemicity in Rwanda: a critical assessment of geographical disparities arising from circulating cathodic antigen versus Kato-Katz diagnostics

Affiliations
Comparative Study

Mapping Schistosoma mansoni endemicity in Rwanda: a critical assessment of geographical disparities arising from circulating cathodic antigen versus Kato-Katz diagnostics

Nicholas J Clark et al. PLoS Negl Trop Dis. .

Abstract

Background: Schistosomiasis is a neglected tropical disease caused by Schistosoma parasites. Intervention relies on identifying high-risk regions, yet rapid Schistosoma diagnostics (Kato-Katz stool assays (KK) and circulating cathodic antigen urine assays (CCA)) yield different prevalence estimates. We mapped S. mansoni prevalence and delineated at-risk regions using a survey of schoolchildren in Rwanda, where S. mansoni is an endemic parasite. We asked if different diagnostics resulted in disparities in projected infection risk.

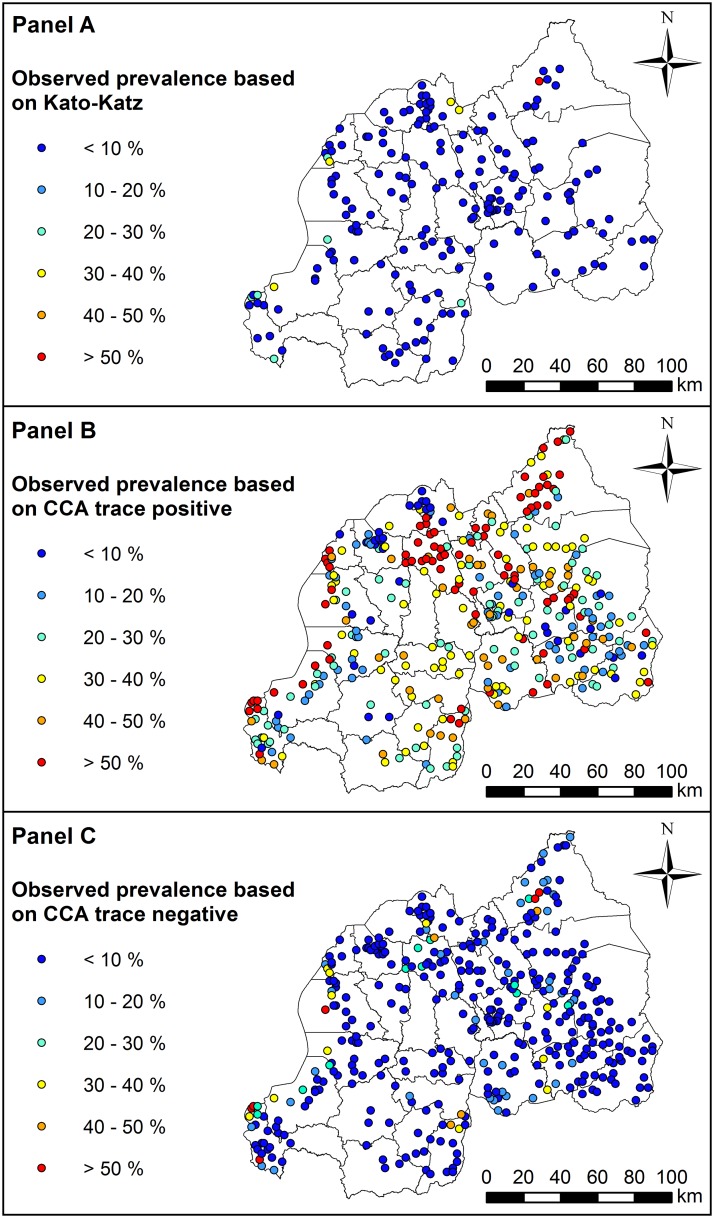
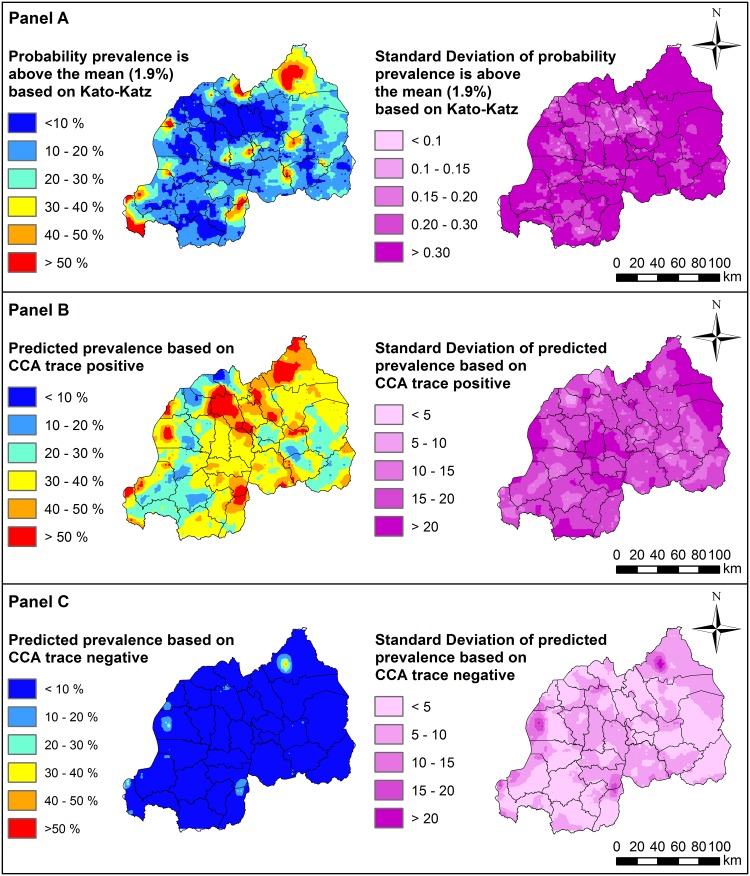
Methods: Infection data was obtained from a 2014 Rwandan school-based survey that used KK and CCA diagnostics. Across 386 schools screened by CCA (N = 19,217). To allow for uncertainty when interpreting ambiguous CCA trace readings, which accounted for 28.8% of total test results, we generated two presence-absence datasets: CCA trace as positive and CCA trace as negative. Samples (N = 9,175) from 185 schools were also screened by KK. We included land surface temperature (LST) and the Normalized Difference Vegetation and Normalized Difference Water Indices (NDVI, NDWI) as predictors in geostatistical regressions.

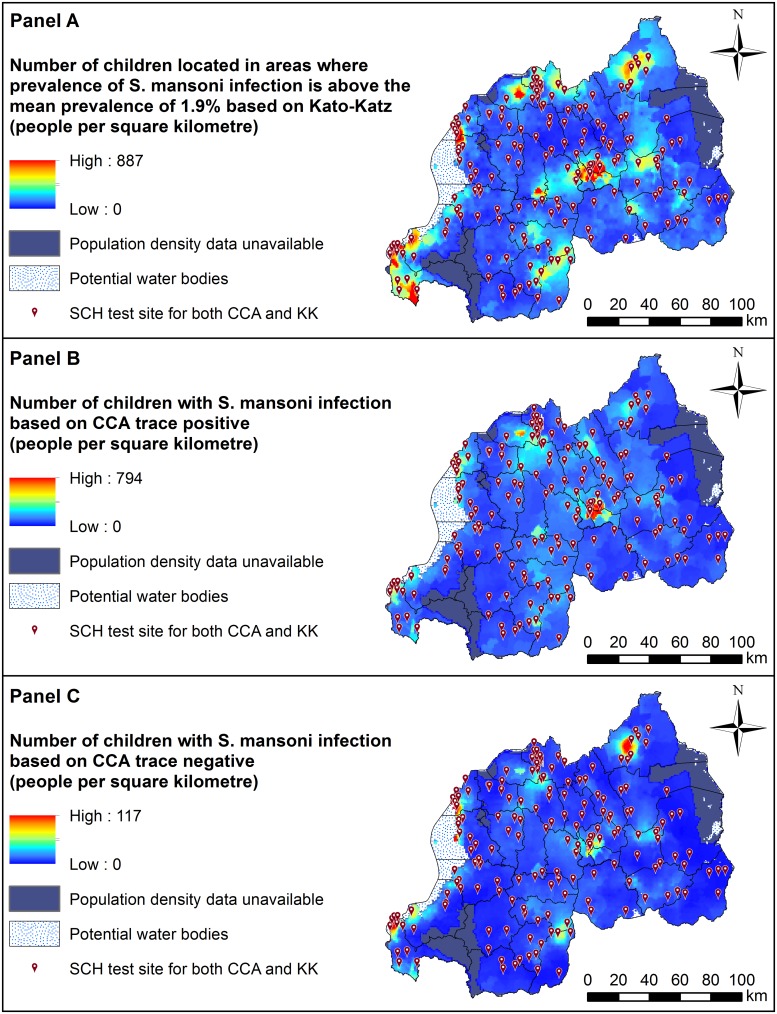
Findings: Across 8,647 children tested by both methods, prevalence was 35.93% for CCA trace as positive, 7.21% for CCA trace as negative and 1.95% for KK. LST was identified as a risk factor using KK, whereas NDVI was a risk factor for CCA models. Models predicted high endemicity in Northern and Western regions of Rwanda, though the CCA trace as positive model identified additional high-risk areas that were overlooked by the other methods. Estimates of current burden for children at highest risk (boys aged 5-9 years) varied by an order of magnitude, with 671,856 boys projected to be infected by CCA trace as positive and only 60,453 projected by CCA trace as negative results.

Conclusions: Our findings show that people in Rwanda's Northern, Western and capital regions are at high risk of S. mansoni infection. However, variation in identification of environmental risk factors and delineation of at-risk regions using different diagnostics likely provides confusing messages to disease intervention managers. Further research and statistical analyses, such as latent class analysis, can be used to improve CCA result classification and assess its use in guiding treatment regimes.


Conflict of interest statement

RSM declares that he is an editorial board member of PLoS Neglected Tropical Diseases.

Figures

Fig 1
Fig 1. Observed prevalence of Schistosoma mansoni infection in Rwandan schoolchildren estimated using three different diagnostic methods: Kato-Katz (Panel A), CCA with trace as positive (Panel B), and CCA with trace as negative (Panel C).
Refer to S3 Fig in Supporting Information for names of geographical districts. This figure was produced in ArcMap 10.4 (ESRI, Redlands, CA) using a shapefile representing Rwanda’s current administrative units (obtained from the geographic data warehouse DIVA GIS (www.diva-gis.org/Data)). CCA; Circulating Cathodic Antigen.
Fig 2
Fig 2. Predicted prevalence of Schistosoma mansoni infection in Rwandan boys aged 5–9 years, estimated using three different diagnostic methods: Kato-Katz (Panel A), CCA with trace as positive (Panel B), and CCA with trace as negative (Panel C).
Predictions were generated using separate geostatistical models to account for possible discrepancies in diagnostic performance and estimates of geographical endemicity. Refer to S3 Fig in Supporting Information for names of geographical districts. This figure was produced in ArcMap 10.4 (ESRI, Redlands, CA) using a shapefile representing Rwanda’s current administrative units (obtained from the geographic data warehouse DIVA GIS (www.diva-gis.org/Data)). CCA; Circulating Cathodic Antigen.
Fig 3
Fig 3. Distributions of the number of Rwandan boys aged 5–9 years (per square kilometre) estimated to be infected with Schistosoma mansoni based on results from three different diagnostic methods: Kato-Katz (Panel A), CCA with trace as positive (Panel B) and CCA with trace as negative (Panel C).
Estimates were generated using geostatistical predictions applied to a map of Rwanda’s 2018 population. This raster was generated by multiplying National Institute of Statistics Rwanda, Fourth Population and Housing Census 2012 data [51, 52] by the reported United Nations Development Programme (UNDP) average annual rate of population change (i.e. 2.53%), which was then multiplied by the proportion of 5–9 year olds. Refer to S3 Fig in Supporting Information for names of geographical districts. This figure was produced in ArcMap 10.4 (ESRI, Redlands, CA) using a shapefile representing Rwanda’s current administrative units (obtained from the geographic data warehouse DIVA GIS (www.diva-gis.org/Data)). CCA; Circulating Cathodic Antigen. SCH; Schistosoma prevalence mapping unit.

Similar articles

Cited by

References

    1. Rujeni N, Morona D, Ruberanziza E, Mazigo HD. Schistosomiasis and soil-transmitted helminthiasis in Rwanda: an update on their epidemiology and control. Infect Dis Poverty. 2017;6(1):8 10.1186/s40249-016-0212-z - DOI - PMC - PubMed
    1. Burke M, Jones M, Gobert G, Li Y, Ellis M, McManus D. Immunopathogenesis of human schistosomiasis. Paras Immunol. 2009;31(4):163–76. - PubMed
    1. King CH, Dangerfield-Cha M. The unacknowledged impact of chronic schistosomiasis. Chronic Illness. 2008;4(1):65–79. 10.1177/1742395307084407 . - DOI - PubMed
    1. Lardans V, Dissous C. Snail control strategies for reduction of schistosomiasis transmission. Parasitology Today. 1998;14(10):413–7. 10.1016/s0169-4758(98)01320-9 - DOI - PubMed
    1. Grimes JE, Croll D, Harrison WE, Utzinger J, Freeman MC, Templeton MR. The relationship between water, sanitation and schistosomiasis: a systematic review and meta-analysis. PLoS Negl Trop Dis. 2014;8(12):e3296 10.1371/journal.pntd.0003296 - DOI - PMC - PubMed

Publication types

MeSH terms

Substances