Modeling spatial variation in density of golden eagle nest sites in the western United States
- PMID: 31568505
- PMCID: PMC6768475
- DOI: 10.1371/journal.pone.0223143
Modeling spatial variation in density of golden eagle nest sites in the western United States
Abstract
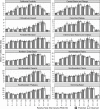
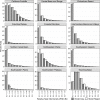
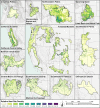
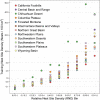
In order to contribute to conservation planning efforts for golden eagles (Aquila chrysaetos) in the western U.S., we developed nest site models using >6,500 nest site locations throughout a >3,483,000 km2 area of the western U.S. We developed models for twelve discrete modeling regions, and estimated relative density of nest sites for each region. Cross-validation showed that, in general, models accurately estimated relative nest site densities within regions and sub-regions. Areas estimated to have the highest densities of breeding golden eagles had from 132-2,660 times greater densities compared to the lowest density areas. Observed nest site densities were very similar to those reported from published studies. Large extents of each modeling region consisted of low predicted nest site density, while a small percentage of each modeling region contained disproportionately high nest site density. For example, we estimated that areas with relative nest density values <0.3 represented from 62.8-97.8% ([Formula: see text] = 82.5%) of each modeling area, and those areas contained from 14.7-30.0% ([Formula: see text] = 22.1%) of the nest sites. In contrast, areas with relative nest density values >0.5 represented from 1.0-12.8% ([Formula: see text] = 6.3%) of modeling areas, and those areas contained from 47.7-66.9% ([Formula: see text] = 57.3%) of the nest sites. Our findings have direct application to: 1) large-scale conservation planning efforts, 2) risk analyses for land-use proposals such as recreational trails or wind power development, and 3) identifying mitigation areas to offset the impacts of human disturbance.
Conflict of interest statement
Dave LaPlante (owner and the only employee of Natural Resources Geospatial) received funding to work on this project from the US Fish and Wildlife Service (Agreement numbers: F14AP00144, F17AC01011). Thus, his company did not fund the project. Dave was a member of our research team, and participated in several aspects of the study, including data analyses, some design features, and reviewing of the manuscript. Our intention from the onset of the project was to publish the study, we all viewed it as “a given” that this would occur. This does not alter our adherence to PLOS ONE policies on sharing data and materials.
Figures


References
-
- Gaston KJ, Fuller RA. The sizes of species’ geographic ranges. J Anim Ecol. 2009;46:1–9.
-
- Fretwell SD. Populations in a seasonal environment Monographs in population biology 5. Princeton, New Jersey: Princeton University Press; 1972. - PubMed
-
- Calsbeek R, Sinervo B. An experimental test of the ideal despotic distribution. J Anim Ecol. 2002;71:513–523.
Publication types
MeSH terms
LinkOut - more resources
Full Text Sources

