. 2019 Sep 30;15(9):e1006453.
doi: 10.1371/journal.pcbi.1006453. eCollection 2019 Sep.

Telescope: Characterization of the retrotranscriptome by accurate estimation of transposable element expression

Affiliations

Telescope: Characterization of the retrotranscriptome by accurate estimation of transposable element expression

Matthew L Bendall et al. PLoS Comput Biol. .

Abstract

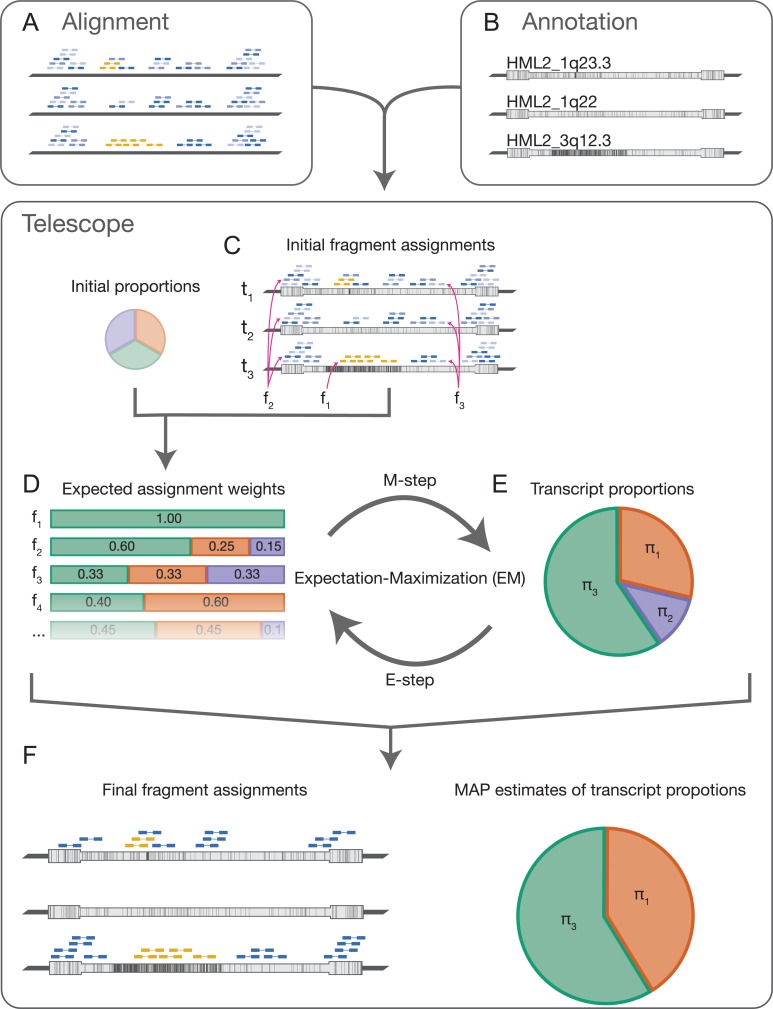
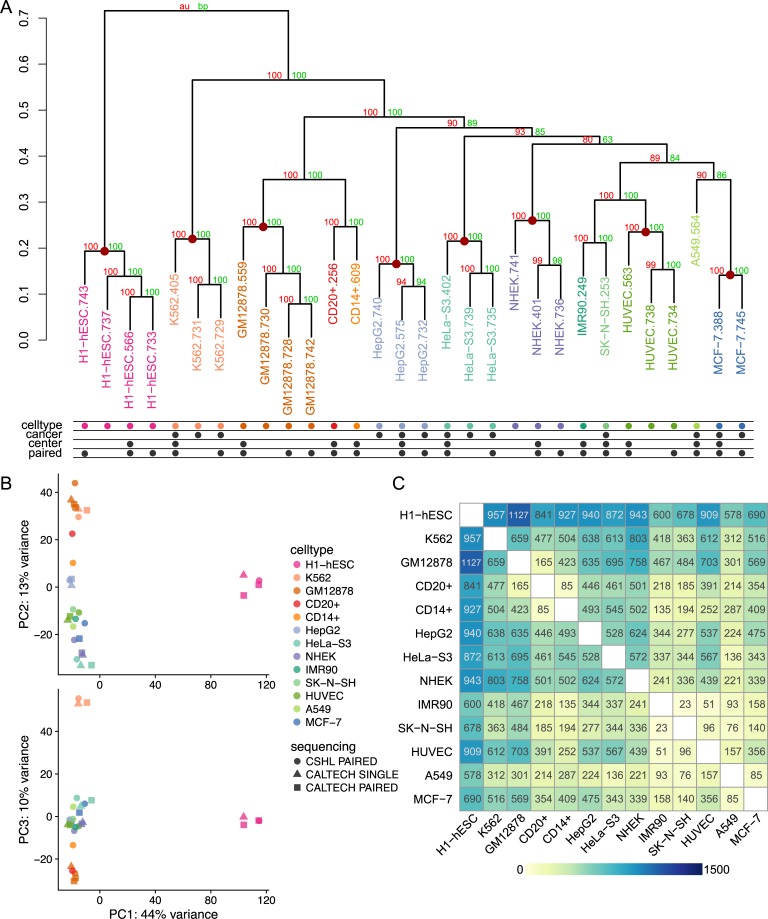
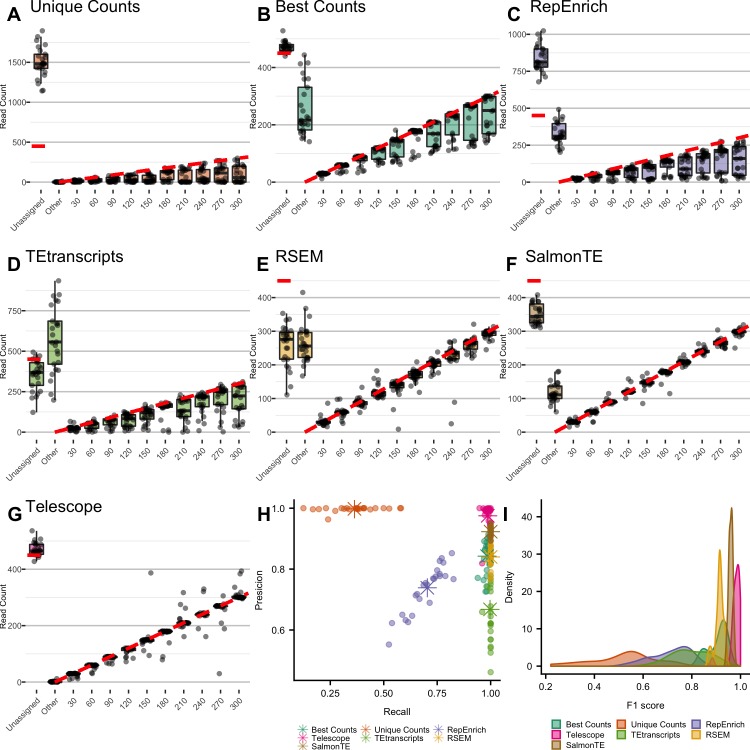
Characterization of Human Endogenous Retrovirus (HERV) expression within the transcriptomic landscape using RNA-seq is complicated by uncertainty in fragment assignment because of sequence similarity. We present Telescope, a computational software tool that provides accurate estimation of transposable element expression (retrotranscriptome) resolved to specific genomic locations. Telescope directly addresses uncertainty in fragment assignment by reassigning ambiguously mapped fragments to the most probable source transcript as determined within a Bayesian statistical model. We demonstrate the utility of our approach through single locus analysis of HERV expression in 13 ENCODE cell types. When examined at this resolution, we find that the magnitude and breadth of the retrotranscriptome can be vastly different among cell types. Furthermore, our approach is robust to differences in sequencing technology and demonstrates that the retrotranscriptome has potential to be used for cell type identification. We compared our tool with other approaches for quantifying transposable element (TE) expression, and found that Telescope has the greatest resolution, as it estimates expression at specific TE insertions rather than at the TE subfamily level. Telescope performs highly accurate quantification of the retrotranscriptomic landscape in RNA-seq experiments, revealing a differential complexity in the transposable element biology of complex systems not previously observed. Telescope is available at https://github.com/mlbendall/telescope.


Conflict of interest statement

The authors have declared that no competing interests exist.

Figures

Fig 1
Fig 1. Telescope conceptual overview.
Telescope requires as input an alignment to the reference genome (A) and an annotation of transposable element locations (B). Alignments should identify many possible high-scoring mappings for each fragment. Fragments shown in gold represent unique mapping locations, dark blue fragments represent a best alignment out of several possible alignments, and light blue fragments represent alignments with suboptimal alignment scores (A). Annotations describe the locations of TE transcripts to be quantified. Three representative HML-2 loci are shown; vertical lines represent differences from the HML-2 consensus sequence (B). Telescope intersects the aligned fragments with annotated TE loci; fragments with no alignments intersecting the annotation are discarded (C). The set of alignments and corresponding alignment scores for each fragment are used to calculate the expected assignment weights, initially assuming equal expression for all elements (D). For example, fragment f1 aligns uniquely to locus t3, and has an expected assignment weight of 1; the best alignment for f2 is to t3 and has a weight of 0.6; f3 aligns equally well to t1, t2, and t3 (C,D). The assignment weights estimated in (D) are used to find the maximum likelihood estimate (MLE) for the proportion of each transcript (E). Next, we update the expected assignment weights, now assuming that the MLE represents our best estimate of transcript expression (D,E). The steps in panels (D) and (E) describe an expectation-maximization procedure, and we further refine the assignment weights and MLE by iterating until parameter estimates converge. Telescope produces a report that includes the maximum a posteriori estimate of the transcript proportions and the final number of fragments assigned to each transcript, as well as an updated alignment including the final fragment assignments (F).
Fig 2
Fig 2. Genome-wide maps of locus-specific HERV expression for 8 ENCODE tier 1 and 2 cell types.
The outer track is a bar chart showing the number of HERV loci in 10 Mbp windows, ranging from 0 to 200, with the red part of the bar representing the number of loci that are expressed in one or more cell types. The 8 inner rings show the expression levels (log2 counts per million (CPM)) of 1365 HERV loci that were expressed in at least one of the cell types examined. Moving from the outer ring to the inner ring are replicates for each of the 8 cell types with duplicates: H1-hESC, GM12878, K562, HeLa-S3, HepG2, HUVEC, MCF-7, and NHEK.
Fig 3
Fig 3. Overall HERV expression patterns.
(A) Number of HERV elements that are expressed for each cell type; expressed loci have CPM > 0.5 in the majority of replicates. The darker section of the bar corresponds to expressed loci that are unique to cell type, while the lighter part is expressed in other cell types. (B) The proportion of mapped RNA-seq fragments that are generated from HERV transcripts in each of eight replicated cell types. Each point is one replicate; boxplot shows the median and first and third quartiles. (C) Top 10 most highly expressed loci for each cell type. Height of the bar is average CPM of all replicates with error bars representing the standard error calculated from replicates CPM values.
Fig 4
Fig 4. Family-level HERV expression profiles using Telescope.
Family-level HERV expression profiles were computed from locus-specific profiles (generated by Telescope) by summing expression across all locations within each subfamily. (A) The proportion of fragments assigned to each HERV subfamily relative to the total amount of HERV expression. Families that account for at least 5% of total HERV expression in at least one cell type are shown, with the remaining families in “other”. (B) Number of expressed HERV loci (left) and fragment counts per million mapped fragments (CPM, right) for selected HERV families. Boxplots for each family were constructed using the average CPM for each expressed locus, with a dark line representing the median of all loci and the box borders representing the 1st and 3rd quartiles. Outlying loci that are greater than 1.5 times the interquartile range from the border of the box are plotted as individual points.
Fig 5
Fig 5. Cell type characterization based on HERV expression profiles using unsupervised learning and linear models.
Unsupervised learning and linear modeling were used to identify patterns in HERV expression profiles generated by Telescope for 30 polyA RNA-seq datasets from 13 cell types. (A) Similarities among normalized expression profiles were explored using hierarchical cluster analysis. Supporting p-values were based on 1000 multiscale bootstrap replicates and calculated using Approximately Unbiased (AU, red) and Bootstrap probability (BP, green) approaches. Red dots are placed on nodes that exclusively cluster together all replicates for a cell type. (B) Principal component analysis (PCA) of normalized expression profiles. The first component accounts for 44% of the variance in the data, and is plotted against component 2 and 3, which account for 13% and 10% of the variance, respectively. (C) Heatmap of the number of HERV elements found to be significantly differentially expressed (DE) among each pair of cell types. Significance was determined using cutoffs for the false discovery rate (FDR < 0.1) and log2 fold change (abs(LFC) > 1.0). Yellow indicates low numbers of differentially expressed elements, while blue indicates high numbers.
Fig 6
Fig 6. Comparison of performance results for TE quantification approaches.
25 RNA-seq samples were simulated, each sample consisted of 10 randomly chosen HML-2 loci with simulated counts equal to 30, 60, 90, 120, 150, 180, 210, 240, 270, and 300. Each point represents the final count from one simulation, with the expected (simulated) expression value on the x-axis. Reads that were not assigned to one of the 10 expressed loci were categorized as “Unassigned” if the read did not map to any loci in the annotation, and “Other” if assigned to an annotated locus that was not expressed; these categories are also shown on the x-axis. A boxplot showing the median and quartiles is shown for each category, and the expected expression value is represented with a red dashed line. Approaches tested: (A) unique counts, (B) best counts, (C) RepEnrich, (D) TEtranscripts, (E) RSEM, (F) SalmonTE, and (G) Telescope. The precision and recall for each sample simulated as well as the mean of both are shown for all methods (H), and F1-score calculation (I).

Similar articles

Cited by

References

    1. Dunham I, Kundaje A, Aldred SF, Collins PJ, Davis CA, Doyle F, et al. An integrated encyclopedia of DNA elements in the human genome. Nature. 2012;489: 57–74. 10.1038/nature11247 - DOI - PMC - PubMed
    1. Kellis M, Wold B, Snyder MP, Bernstein BE, Kundaje A, Marinov GK, et al. Defining functional DNA elements in the human genome. Proc Natl Acad Sci U S A. 2014;111: 6131–8. 10.1073/pnas.1318948111 - DOI - PMC - PubMed
    1. Magiorkinis G, Belshaw R, Katzourakis A. “There and back again”: revisiting the pathophysiological roles of human endogenous retroviruses in the post-genomic era. Philos Trans R Soc B Biol Sci. 2013;368: 20120504–20120504. 10.1098/rstb.2012.0504 - DOI - PMC - PubMed
    1. Wang-Johanning F, Frost AR, Jian B, Epp L, Lu DW, Johanning GL. Quantitation of HERV-K env gene expression and splicing in human breast cancer. Oncogene. 2003;22: 1528–1535. 10.1038/sj.onc.1206241 - DOI - PubMed
    1. Tang Z, Steranka JP, Ma S, Grivainis M, Rodić N, Huang CRL, et al. Human transposon insertion profiling: Analysis, visualization and identification of somatic LINE-1 insertions in ovarian cancer. Proc Natl Acad Sci. 2017;114: E733–E740. 10.1073/pnas.1619797114 - DOI - PMC - PubMed

Publication types

Substances