

Coastal proximity of populations in 22 Pacific Island Countries and Territories
- PMID: 31568527
- PMCID: PMC6768456
- DOI: 10.1371/journal.pone.0223249
Coastal proximity of populations in 22 Pacific Island Countries and Territories
Abstract
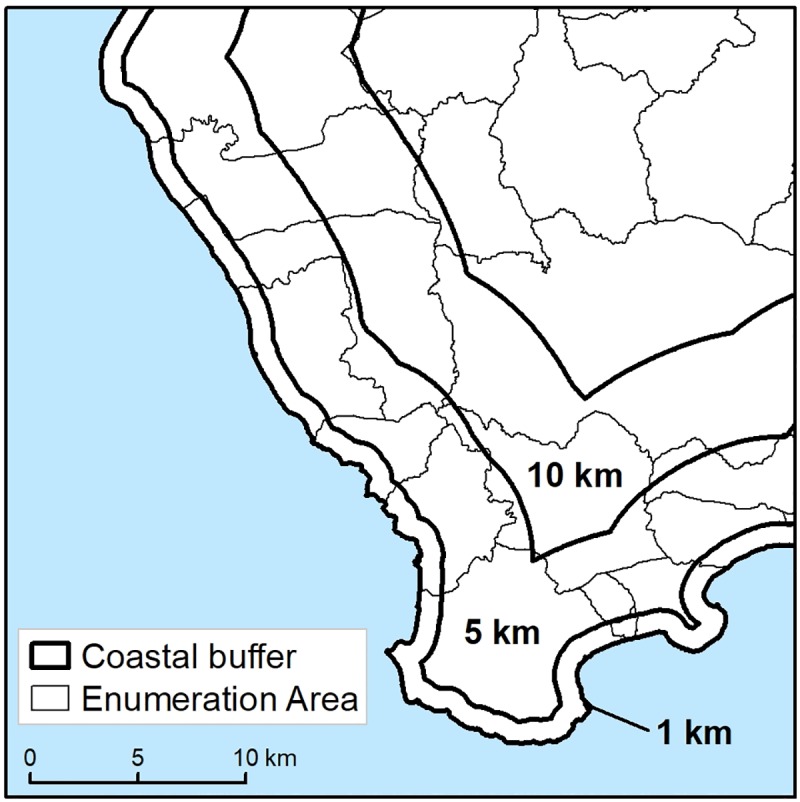
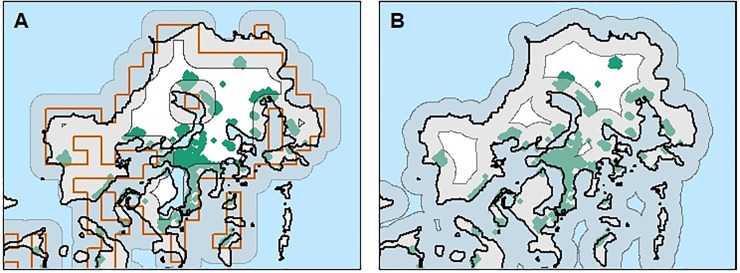
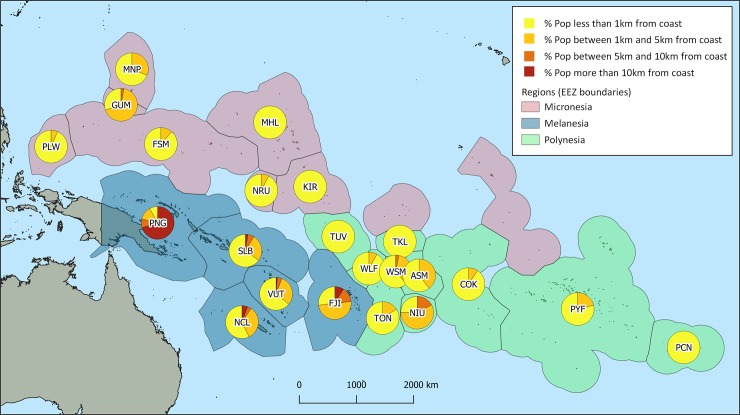
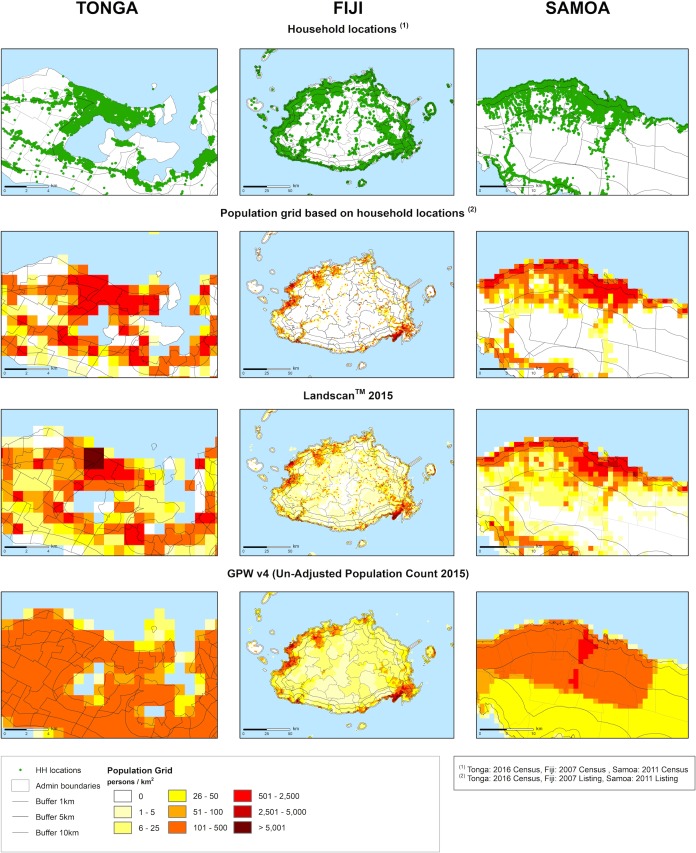
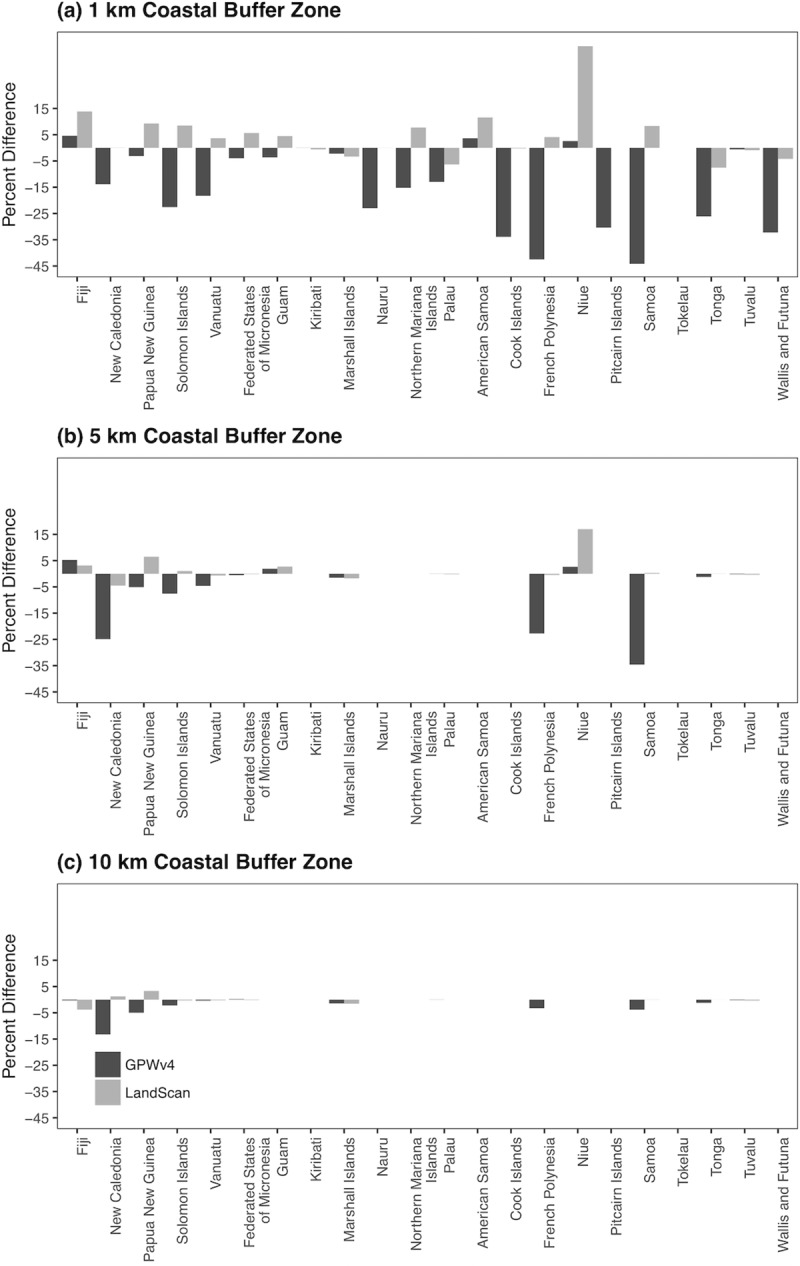
The coastal zones of Small Island States are hotspots of human habitation and economic endeavour. In the Pacific region, as elsewhere, there are large gaps in understandings of the exposure and vulnerability of people in coastal zones. The 22 Pacific Countries and Territories (PICTs) are poorly represented in global analyses of vulnerability to seaward risks. We combine several data sources to estimate populations to zones 1, 5 and 10 km from the coastline in each of the PICTs. Regional patterns in the proximity of Pacific people to the coast are dominated by Papua New Guinea. Overall, ca. half the population of the Pacific resides within 10 km of the coast but this jumps to 97% when Papua New Guinea is excluded. A quarter of Pacific people live within 1 km of the coast, but without PNG this increases to slightly more than half. Excluding PNG, 90% of Pacific Islanders live within 5 km of the coast. All of the population in the coral atoll nations of Tokelau and Tuvalu live within a km of the ocean. Results using two global datasets, the SEDAC-CIESIN Gridded Population of the World v4 (GPWv4) and the Oak Ridge National Laboratory Landscan differed: Landscan under-dispersed population, overestimating numbers in urban centres and underestimating population in rural areas and GPWv4 over-dispersed the population. In addition to errors introduced by the allocation models of the two methods, errors were introduced as artefacts of allocating households to 1 km x 1 km grid cell data (30 arc-seconds) to polygons. The limited utility of LandScan and GPWv4 in advancing this analysis may be overcome with more spatially resolved census data and the inclusion of elevation above sea level as an important dimension of vulnerability.
Conflict of interest statement
The authors have declared that no competing interests exist.
Figures
References
-
- Small C, Nicholls RJ. A global analysis of human settlement in coastal zones. J Coast Res [Internet]. 2003;19(3):584–99. Available from: http://www.jstor.org/stable/4299200
-
- Mortreux C, Barnett J. Climate change, migration and adaptation in Funafuti, Tuvalu. Glob Environ Chang. 2009;19(1):105–12.
-
- Rudiak-Gould P. Promiscuous corroboration and climate change translation: A case study from the Marshall Islands. Glob Environ Chang [Internet]. Elsevier Ltd; 2012;22(1):46–54. Available from: 10.1016/j.gloenvcha.2011.09.011 - DOI
-
- Hau’ofa E. We are the ocean. A new Ocean Rediscovering our sea islands [Internet]. 2008;188 Available from: http://savageminds.org/wp-content/image-upload/our-sea-of-islands-epeli-...
Publication types
MeSH terms
LinkOut - more resources
Full Text Sources
