

Testosterone therapy induces molecular programming augmenting physiological adaptations to resistance exercise in older men
- PMID: 31568675
- PMCID: PMC6903447
- DOI: 10.1002/jcsm.12472
Testosterone therapy induces molecular programming augmenting physiological adaptations to resistance exercise in older men
Abstract
Background: The andropause is associated with declines in serum testosterone (T), loss of muscle mass (sarcopenia), and frailty. Two major interventions purported to offset sarcopenia are anabolic steroid therapies and resistance exercise training (RET). Nonetheless, the efficacy and physiological and molecular impacts of T therapy adjuvant to short-term RET remain poorly defined.
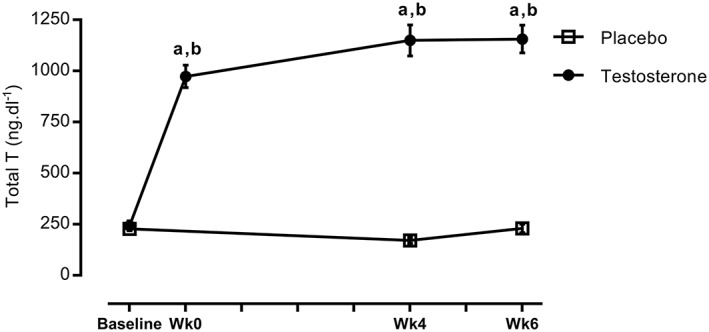
Methods: Eighteen non-hypogonadal healthy older men, 65-75 years, were assigned in a random double-blinded fashion to receive, biweekly, either placebo (P, saline, n = 9) or T (Sustanon 250 mg, n = 9) injections over 6 week whole-body RET (three sets of 8-10 repetitions at 80% one-repetition maximum). Subjects underwent dual-energy X-ray absorptiometry, ultrasound of vastus lateralis (VL) muscle architecture, and knee extensor isometric muscle force tests; VL muscle biopsies were taken to quantify myogenic/anabolic gene expression, anabolic signalling, muscle protein synthesis (D2 O), and breakdown (extrapolated).
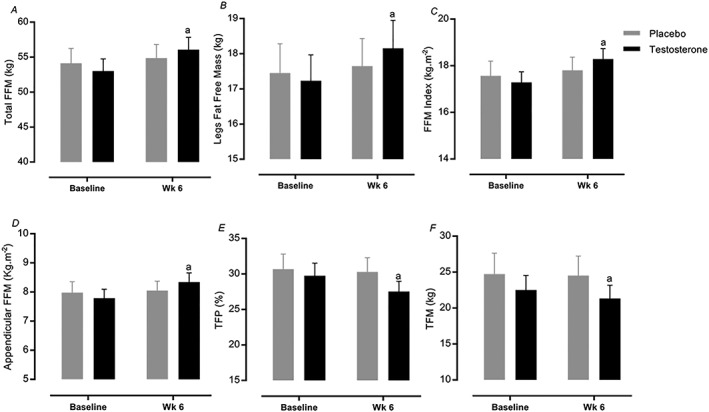
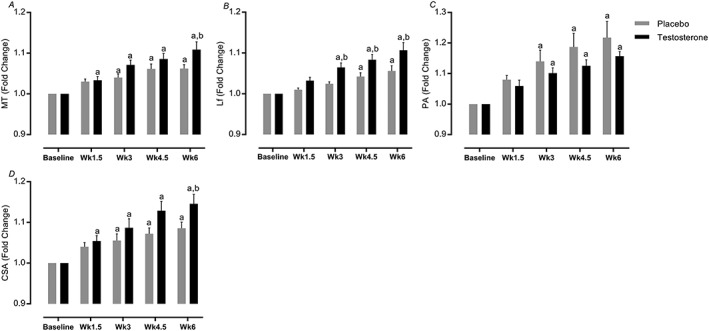
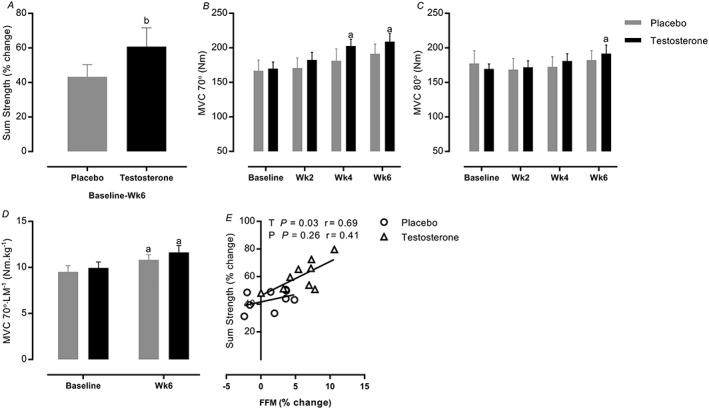
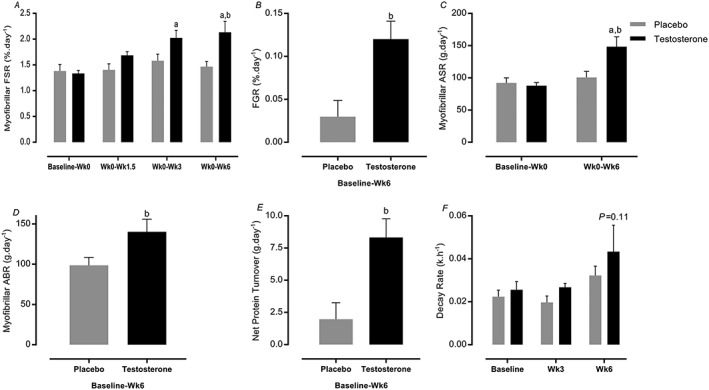
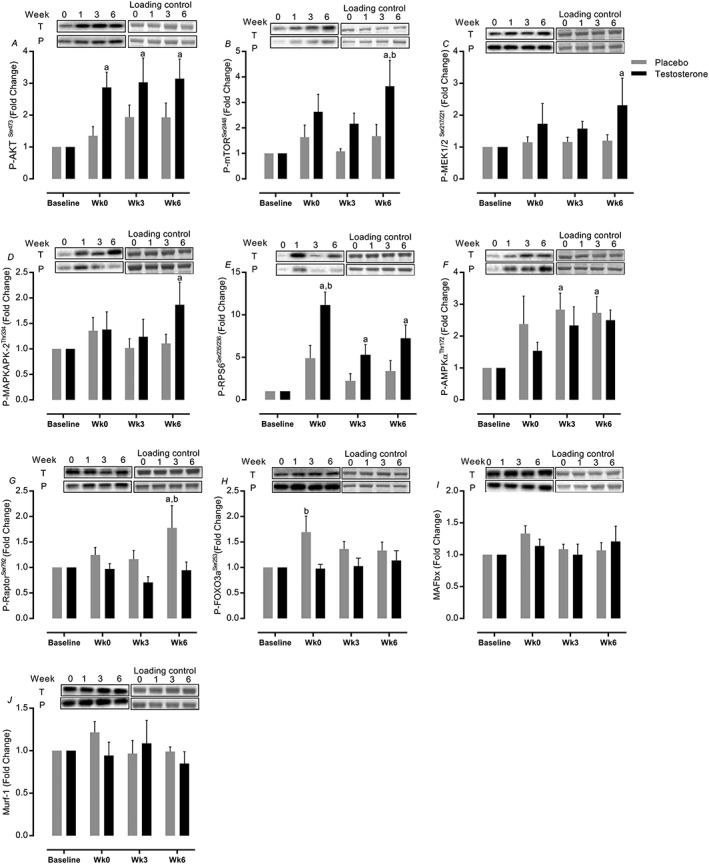
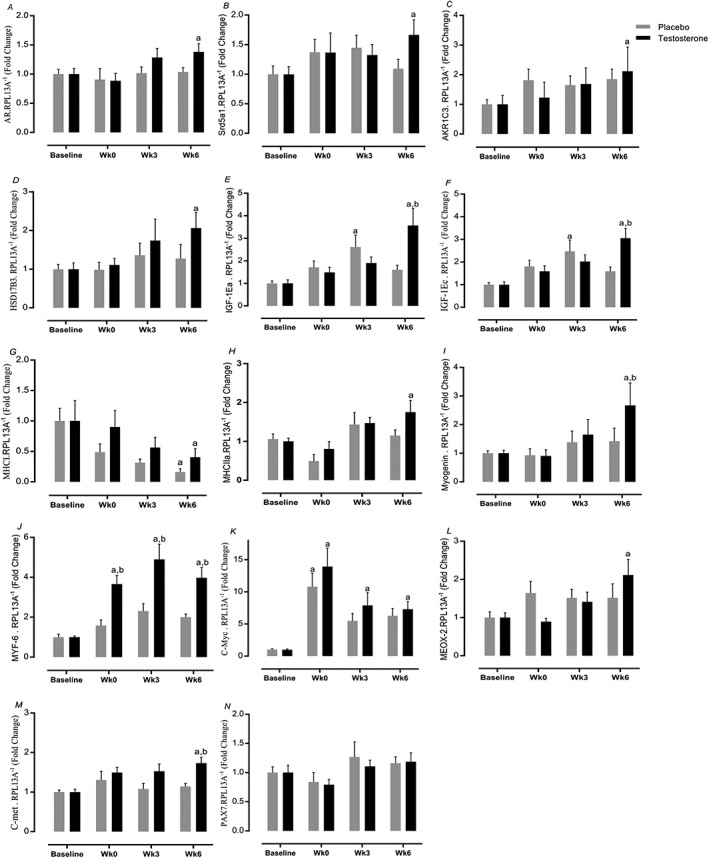
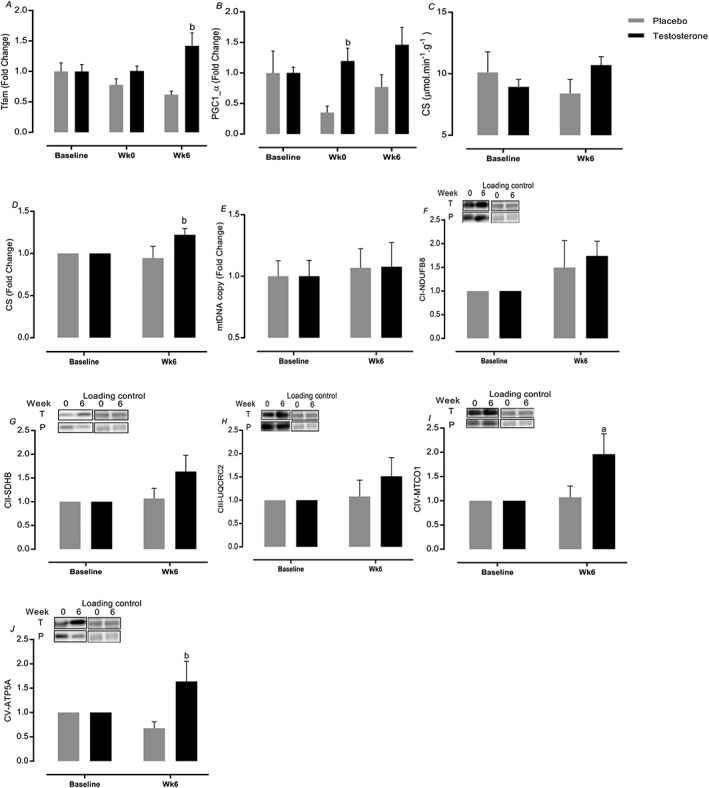
Results: Testosterone adjuvant to RET augmented total fat-free mass (P=0.007), legs fat-free mass (P=0.02), and appendicular fat-free mass (P=0.001) gains while decreasing total fat mass (P=0.02). Augmentations in VL muscle thickness, fascicle length, and quadriceps cross-section area with RET occured to a greater extent in T (P < 0.05). Sum strength (P=0.0009) and maximal voluntary contract (e.g. knee extension at 70°) (P=0.002) increased significantly more in the T group. Mechanistically, both muscle protein synthesis rates (T: 2.13 ± 0.21%·day-1 vs. P: 1.34 ± 0.13%·day-1 , P=0.0009) and absolute breakdown rates (T: 140.2 ± 15.8 g·day-1 vs. P: 90.2 ± 11.7 g·day-1 , P=0.02) were elevated with T therapy, which led to higher net turnover and protein accretion in the T group (T: 8.3 ± 1.4 g·day-1 vs. P: 1.9 ± 1.2 g·day-1 , P=0.004). Increases in ribosomal biogenesis (RNA:DNA ratio); mRNA expression relating to T metabolism (androgen receptor: 1.4-fold; Srd5a1: 1.6-fold; AKR1C3: 2.1-fold; and HSD17β3: two-fold); insulin-like growth factor (IGF)-1 signalling [IGF-1Ea (3.5-fold) and IGF-1Ec (three-fold)] and myogenic regulatory factors; and the activity of anabolic signalling (e.g. mTOR, AKT, and RPS6; P < 0.05) were all up-regulated with T therapy. Only T up-regulated mitochondrial citrate synthase activity (P=0.03) and transcription factor A (1.41 ± 0.2-fold, P=0.0002), in addition to peroxisome proliferator-activated receptor-γ co-activator 1-α mRNA (1.19 ± 0.21-fold, P=0.037).
Conclusions: Administration of T adjuvant to RET enhanced skeletal muscle mass and performance, while up-regulating myogenic gene programming, myocellular translational efficiency and capacity, collectively resulting in higher protein turnover, and net protein accretion. T coupled with RET is an effective short-term intervention to improve muscle mass/function in older non-hypogonadal men.
Keywords: Ageing; Protein turnover; Resistance exercise; Skeletal muscle; Testosterone.
© 2019 The Authors. Journal of Cachexia, Sarcopenia and Muscle published by John Wiley & Sons Ltd on behalf of the Society on Sarcopenia, Cachexia and Wasting Disorders.
Conflict of interest statement
None declared.
Figures

References
-
- Ferrando AA, Sheffield‐Moore M, Yeckel CW, Gilkison C, Jiang J, Achacosa A, et al. Testosterone administration to older men improves muscle function: molecular and physiological mechanisms. Am J Physiol Endocrinol Metab 2002;282:601–607. - PubMed
Publication types
MeSH terms
Substances
Grants and funding
LinkOut - more resources
Full Text Sources
Medical
Miscellaneous
