

Comparison of the Mycobacterium tuberculosis molecular bacterial load assay, microscopy and GeneXpert versus liquid culture for viable bacterial load quantification before and after starting pulmonary tuberculosis treatment
- PMID: 31568973
- PMCID: PMC6899431
- DOI: 10.1016/j.tube.2019.101864
Comparison of the Mycobacterium tuberculosis molecular bacterial load assay, microscopy and GeneXpert versus liquid culture for viable bacterial load quantification before and after starting pulmonary tuberculosis treatment
Abstract
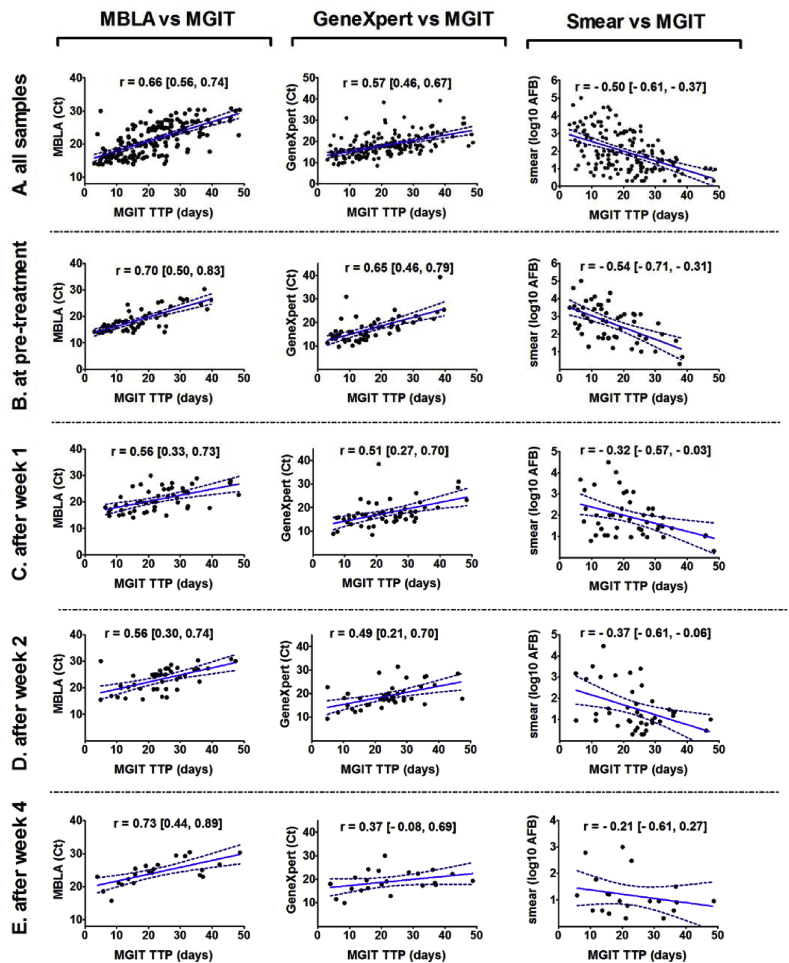
Molecular bacterial load assay (MBLA) rapidly quantifies viable Mycobacterium tuberculosis (Mtb) and may be useful for monitoring treatment response and treatment efficacy. We conducted a prospective study in 56 adults with pulmonary tuberculosis from whom 244 sputum samples were collected before and during the first month of treatment. We evaluated MBLA for early monitoring of bacterial burden and investigated bactericidal activities of first-line therapy in patients infected with drug susceptible and resistant isolates. Mtb loads measured by MBLA and culture were correlated after one-week (r = 0.56) and one-month (r = 0.73) of treatment. Correlations between culture and GeneXpert or microscopy were weaker during treatment. Mtb load by MBLA declined more rapidly than GeneXpert after one-week (2.73 Ct, P < 0.001; 0.95 Ct, P = 0.297, respectively) and one-month (8.94 Ct, P < 0.001; 6.78 Ct, P < 0.001). Mtb loads in multidrug resistant (MDR) infections were significantly greater than in both sensitive and poly/mono-resistance after one-week (P < 0.02) and one-month treatment (P = 0.001). MBLA performed better than GeneXpert and microscopy in comparison to culture for quantifying viable Mtb during treatment. It can be used for monitoring bacterial load during TB treatment, facilitating early detection of treatment failure thus improving outcomes.
Keywords: 16S rRNA; Bactericidal activity; Mycobacterium tuberculosis; Treatment; Viable bacterial load.
Copyright © 2019 The Authors. Published by Elsevier Ltd.. All rights reserved.
Figures

References
-
- World Health Organization . WHO; Geneva, Switzerland: 2011. Global tuberculosis report 2017.
-
- Gaikwad U.N., Gaikwad N.R. Modalities to monitor the treatment response in tuberculosis. Indian J Tuberc. 2018;65(2):109–117. - PubMed
-
- de Knegt G.J. Assessment of treatment response by colony forming units, time to culture positivity and the molecular bacterial load assay compared in a mouse tuberculosis model. Tuberculosis. 2017;105:113–118. - PubMed
Publication types
MeSH terms
Substances
Grants and funding
LinkOut - more resources
Full Text Sources
Other Literature Sources
