. 2019 Dec;20(12):932-942.
doi: 10.1111/tra.12700. Epub 2019 Oct 23.

Actin-spectrin scaffold supports open fenestrae in liver sinusoidal endothelial cells

Affiliations

Actin-spectrin scaffold supports open fenestrae in liver sinusoidal endothelial cells

Bartlomiej Zapotoczny et al. Traffic. 2019 Dec.

Abstract

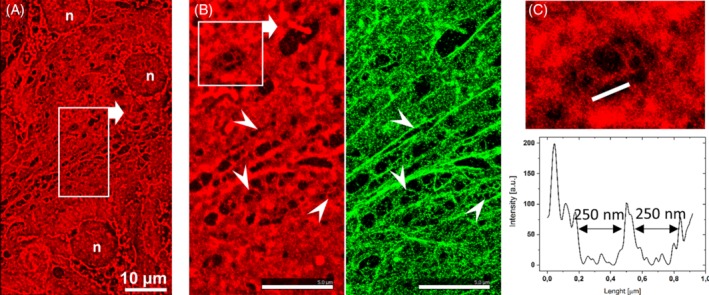
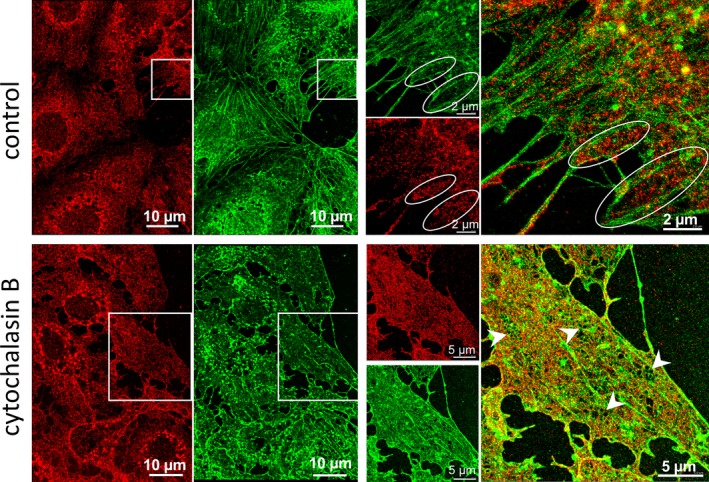
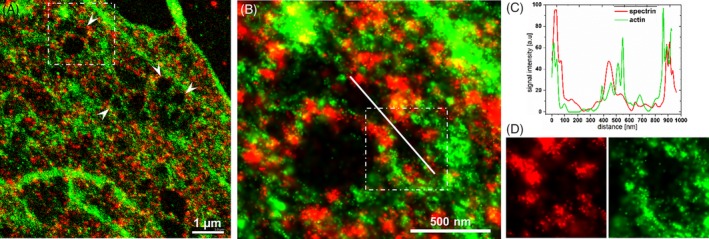
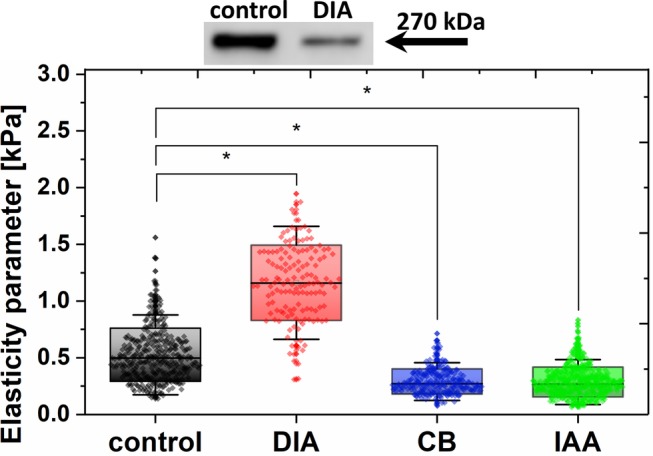
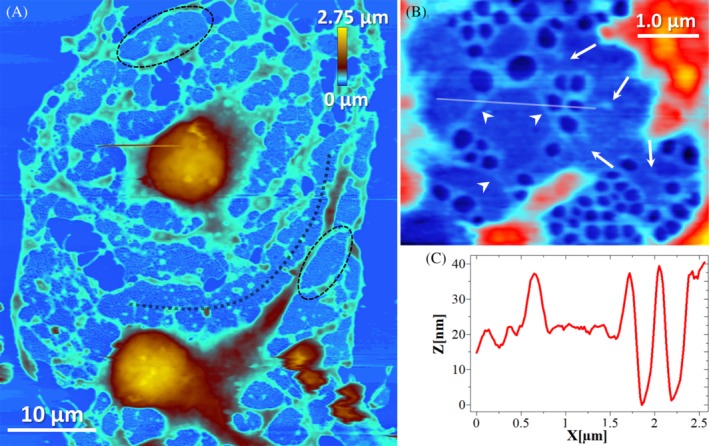
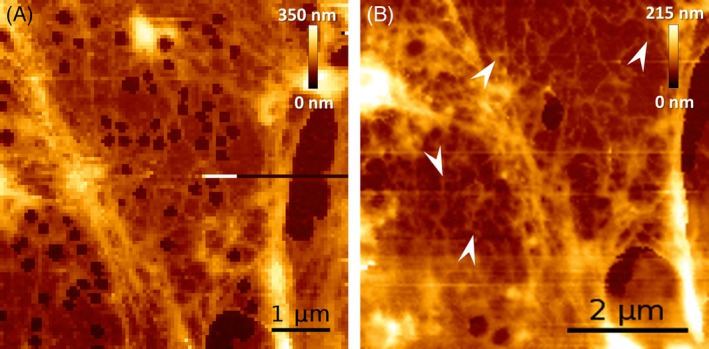
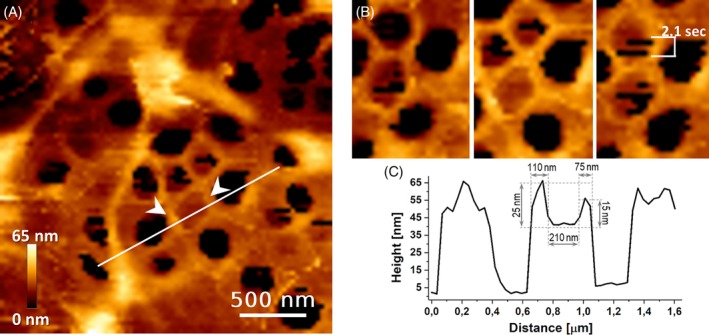
Fenestrae are open transmembrane pores that are a structural hallmark of healthy liver sinusoidal endothelial cells (LSECs). Their key role is the transport of solutes and macromolecular complexes between the sinusoidal lumen and the space of Disse. To date, the biochemical nature of the cytoskeleton elements that surround the fenestrae and sieve plates in LSECs remain largely elusive. Herein, we took advantage of the latest developments in atomic force imaging and super-resolution fluorescence nanoscopy to define the organization of the supramolecular complex(es) that surround the fenestrae. Our data revealed that spectrin, together with actin, lines the inner cell membrane and provided direct structural support to the membrane-bound pores. We conclusively demonstrated that diamide and iodoacetic acid (IAA) affect fenestrae number by destabilizing the LSEC actin-spectrin scaffold. Furthermore, IAA induces rapid and repeatable switching between the open vs closed state of the fenestrae, indicating that the spectrin-actin complex could play an important role in controlling the pore number. Our results suggest that spectrin functions as a key regulator in the structural preservation of the fenestrae, and as such, it might serve as a molecular target for altering transendothelial permeability.

Keywords: actin; cytoskeleton; fenestrae (fenestrations); liver sinusoidal endothelial cells; membrane-bound pores; spectrin; transendothelial transport.


Figures

Figure 1
Figure 1
Two‐colored dSTORM images revealing the organization of the LSEC membrane and the localization of Actin. A, A low‐magnification image of the cell membrane (CellMask Deep Red) acquired at the interconnection of a few LSECs. B, Magnification of the area indicated in image A. The cell membrane (CellMask Deep Red, red) and actin (phalloidin‐Atto488, green) are shown. The arrowheads indicate the selected fenestrae that can be distinguished in both channels. C, Magnification of the area indicated in image B for CellMask presenting a single sieve plate with a few fenestrae. The cross section shows the diameters of the selected fenestrae determined based on the intensity of the fluorescence signal
Figure 2
Figure 2
Two‐colored dSTORM images revealing the organization of actin and spectrin in the LSEC cytoskeleton. Intact control cells (first row) and LSECs treated with 21 μM CB for 30 minutes before fixation (second row). Spectrin (red, spectrin β II Antibody conjugated with Alexa Fluor 647) and actin (green, phalloidin Atto488) distribution at the interconnection of several LSECs are shown in the left panels. The right panels present the magnifications of the selected areas (white squares) where independent and merged channels are shown. In the control samples, the encircled areas indicate sieve plates. The individual fenestrae are identified only in CB‐treated samples in TIRF mode as black (eg, arrowheads)
Figure 3
Figure 3
High‐magnification dSTORM image of the cytoskeleton of CB‐treated LSECs. A, The cytoplasmic distributions of actin (green, phalloidin Atto 488) and spectrin (red, spectrin β II antibody conjugated with Alexa Fluor 647). Arrowheads indicate individual fenestrae. B, Magnification of the selected white line indicating the cross section presented in C. D, Magnification of the single fenestrae marked in C. Separated channels show spectrin and actin distribution around the fenestra
Figure 4
Figure 4
Western blot of spectrin in control and DIA‐treated LSECs (500 μM, 5 minutes) (top). Elasticity parameter (effective Young's modulus) calculated from Hertz‐Sneddon model fit to the force‐distance curves taken at the nuclear part of live LSECs, both untreated and treated with DIA (500 μM), CB (21 μM) or IAA (10 μM) (bottom). The boxes indicate SD (SD), with a line and black dot indicating the median and mean value, respectively. *P < .001
Figure 5
Figure 5
AFM image showing GA‐fixed LSECs after 30 minutes of CB treatment (21 μM). A, A bulging nucleus area (brown‐orange, >400 nm) is observed. Cell height on the periphery rarely exceeds 400 nm (blue, <400 nm). Black outlines indicate examples of the individual sieve plates, but some sieve plates are merged (eg, black dotted line). B, Magnification of a single sieve plate. Each fenestra in the sieve plate is surrounded with FACR. Actin filaments are often connected to each other and form long filaments (arrowheads). Incompletely closed FACRs do not contain an open pore within (arrows). C, A cross section presents the height of the FACR and flat regions within the sieve plate
Figure 6
Figure 6
AFM images highlighting FACRs in LSECs. A, Peripheral part of an LSEC sieve plate presenting fenestrated morphology (control). A net of FACRs can be observed as brighter (higher) parts within the cell cytoplasm. B, After injection of 500 μM DIA to the medium, a similar area of the same LSEC was visualized and shows immediate (<5 minutes) closing of the fenestrae. The measurement initiated after ~3 minutes (8 minutes long) from the injection presents the F‐actin filament structure around FACR (arrowheads)
Figure 7
Figure 7
High‐resolution AFM image on a part of a single‐laying sieve plate within a live LSEC. A, Note, measurements are derived after exposure to 10 μM IAA. B, FACRs (white arrowheads) remained unchanged while the fenestrae changed from an open to closed state. C, The cross section indicated as a white line in A shows elevated FACR surrounding a closed fenestra. Each AFM image/frame took 55 seconds and consisted of 80 × 80 pixels. See Supplementary Animation 1 for the corresponding 18‐minute long video animation

References

    1. Marchesi V, Steers EJ. Selective solubilization of a protein component of the red cell membrane. Science. 1968;159(811):203‐204. - PubMed
    1. Baek HJ, Lee YM, Kim TH, et al. Caspase‐3/7‐mediated cleavage of β2‐spectrin is required for acetaminophen‐induced liver damage. Int J Biol Sci. 2016;12(2):172‐183. 10.7150/ijbs.13420. - DOI - PMC - PubMed
    1. Machnicka B, Grochowalska R, Bogusławska DM, Sikorski AF, Lecomte MC. Spectrin‐based skeleton as an actor in cell signaling. Cell Mol Life Sci. 2012;69(2):191‐201. 10.1007/s00018-011-0804-5. - DOI - PMC - PubMed
    1. Heltianu C, Bogdan I, Constantinescu E, Simionescu M. Endothelial cells express a spectrin‐like cytoskeletal protein. Circ Res. 1986;58(4):605‐610. - PubMed
    1. Levine J, Fodrin WM. Axonally transported polypeptides associated with the internal periphery of many cells. J Cell Biol. 1981;90(3):631‐643. 10.1083/jcb.90.3.631. - DOI - PMC - PubMed

Publication types

LinkOut - more resources