Human Cysteine Cathepsins Degrade Immunoglobulin G In Vitro in a Predictable Manner
- PMID: 31569504
- PMCID: PMC6801702
- DOI: 10.3390/ijms20194843
Human Cysteine Cathepsins Degrade Immunoglobulin G In Vitro in a Predictable Manner
Abstract
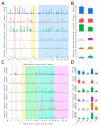
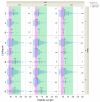
Cysteine cathepsins are critical components of the adaptive immune system involved in the generation of epitopes for presentation on human leukocyte antigen (HLA) molecules and have been implicated in degradation of autoantigens. Immunoglobulin variable regions with somatic mutations and random complementarity region 3 amino acid composition are inherently immunogenic. T cell reactivity towards immunoglobulin variable regions has been investigated in relation to specific diseases, as well as reactivity to therapeutic monoclonal antibodies. Yet, how the immunoglobulins, or the B cell receptors, are processed in endolysosomal compartments of professional antigen presenting cells has not been described in detail. Here we present in silico and in vitro experimental evidence suggesting that cysteine cathepsins S, L and B may have important roles in generating peptides fitting HLA class II molecules, capable of being presented to T cells, from monoclonal antibodies as well as from central nervous system proteins including a well described autoantigen. By combining neural net models with in vitro proteomics experiments, we further suggest how such degradation can be predicted, how it fits with available cellular models, and that it is immunoglobulin heavy chain variable family dependent. These findings are relevant for biotherapeutic drug design as well as to understand disease development. We also suggest how these tools can be improved, including improved machine learning methodology.
Keywords: B cell; antigen presenting cell; bioinformatics; cathepsin; endolysosome; endosome; in silico model; protease; protease cleavage prediction.
Conflict of interest statement
R.B. and E.J.H. hold equity in ioGenetics LLC, the company responsible for designing the bioinformatics models used in this project. RAH, AL, TH have all received speakers’ honoraria, unrestricted research grants and/or participated in advisory boards for Biogen, Merck, Novartis, Roche and Sanofi Genzyme. SBT and BB declare no conflicts of interest. The funders had no role in the design of the study; in the collection, analyses, or interpretation of data; in the writing of the manuscript, or in the decision to publish the results.
Figures


Similar articles
-
Cysteine Cathepsins Activate ELR Chemokines and Inactivate Non-ELR Chemokines.J Biol Chem. 2015 May 29;290(22):13800-11. doi: 10.1074/jbc.M115.638395. Epub 2015 Apr 1. J Biol Chem. 2015. PMID: 25833952 Free PMC article.
-
Computational predictions of cysteine cathepsin-mediated fibrinogen proteolysis.Protein Sci. 2018 Mar;27(3):714-724. doi: 10.1002/pro.3366. Epub 2017 Dec 28. Protein Sci. 2018. PMID: 29266558 Free PMC article.
-
Generation of cytotoxic T lymphocytes specific for B-cell acute lymphoblastic leukemia family-shared peptides derived from immunoglobulin heavy chain framework region.Chin Med J (Engl). 2007 Apr 20;120(8):652-7. Chin Med J (Engl). 2007. PMID: 17517179
-
Cysteine cathepsins: from structure, function and regulation to new frontiers.Biochim Biophys Acta. 2012 Jan;1824(1):68-88. doi: 10.1016/j.bbapap.2011.10.002. Epub 2011 Oct 12. Biochim Biophys Acta. 2012. PMID: 22024571 Free PMC article. Review.
-
Cysteine Cathepsins and their Extracellular Roles: Shaping the Microenvironment.Cells. 2019 Mar 20;8(3):264. doi: 10.3390/cells8030264. Cells. 2019. PMID: 30897858 Free PMC article. Review.
Cited by
-
CD4+ T Cells in the Blood of MS Patients Respond to Predicted Epitopes From B cell Receptors Found in Spinal Fluid.Front Immunol. 2020 Apr 9;11:598. doi: 10.3389/fimmu.2020.00598. eCollection 2020. Front Immunol. 2020. PMID: 32328067 Free PMC article.
-
The multifaceted roles of cathepsins in immune and inflammatory responses: implications for cancer therapy, autoimmune diseases, and infectious diseases.Biomark Res. 2024 Dec 31;12(1):165. doi: 10.1186/s40364-024-00711-9. Biomark Res. 2024. PMID: 39736788 Free PMC article. Review.
-
Single-cell transcriptomics combined with proteomics of intrathecal IgG reveal transcriptional heterogeneity of oligoclonal IgG-secreting cells in multiple sclerosis.Front Cell Neurosci. 2023 Jun 8;17:1189709. doi: 10.3389/fncel.2023.1189709. eCollection 2023. Front Cell Neurosci. 2023. PMID: 37362001 Free PMC article.
-
Protection of Mice against Experimental Cryptococcosis by Synthesized Peptides Delivered in Glucan Particles.mBio. 2021 Feb 22;13(1):e0336721. doi: 10.1128/mbio.03367-21. Epub 2022 Jan 4. mBio. 2021. PMID: 35089095 Free PMC article.
-
Determinants of tumor immune evasion: the role of T cell exposed motif frequency and mutant amino acid exposure.Front Immunol. 2023 May 5;14:1155679. doi: 10.3389/fimmu.2023.1155679. eCollection 2023. Front Immunol. 2023. PMID: 37215122 Free PMC article.
References
-
- Shimabukuro-Vornhagen A., Zoghi S., Liebig T.M., Wennhold K., Chemitz J., Draube A., Kochanek M., Blaschke F., Pallasch C., Holtick U., et al. Inhibition of protein geranylgeranylation specifically interferes with CD40-dependent B cell activation, resulting in a reduced capacity to induce T cell immunity. J. Immunol. 2014;193:5294–5305. doi: 10.4049/jimmunol.1203436. - DOI - PubMed
MeSH terms
Substances
Grants and funding
LinkOut - more resources
Full Text Sources
Other Literature Sources
Research Materials

