Review
. 2019 Sep 29;11(10):1462.
doi: 10.3390/cancers11101462.

FADD in Cancer: Mechanisms of Altered Expression and Function, and Clinical Implications

Affiliations
Review

FADD in Cancer: Mechanisms of Altered Expression and Function, and Clinical Implications

José L Marín-Rubio et al. Cancers (Basel). .

Abstract

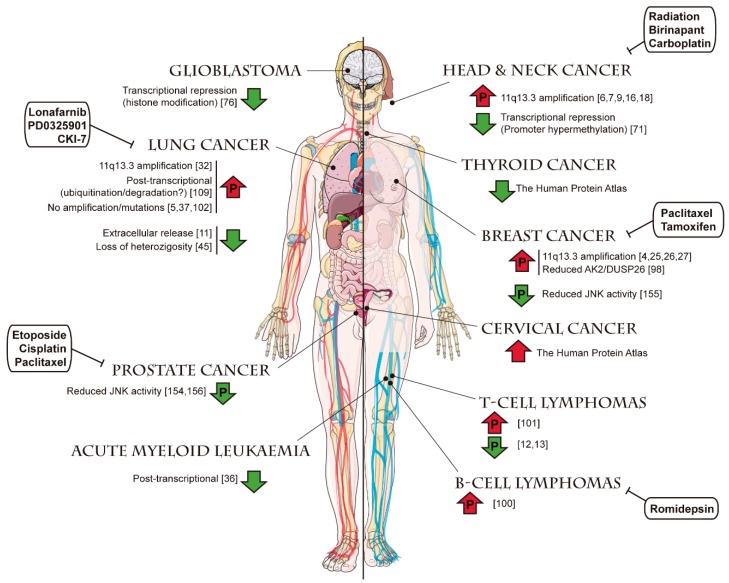
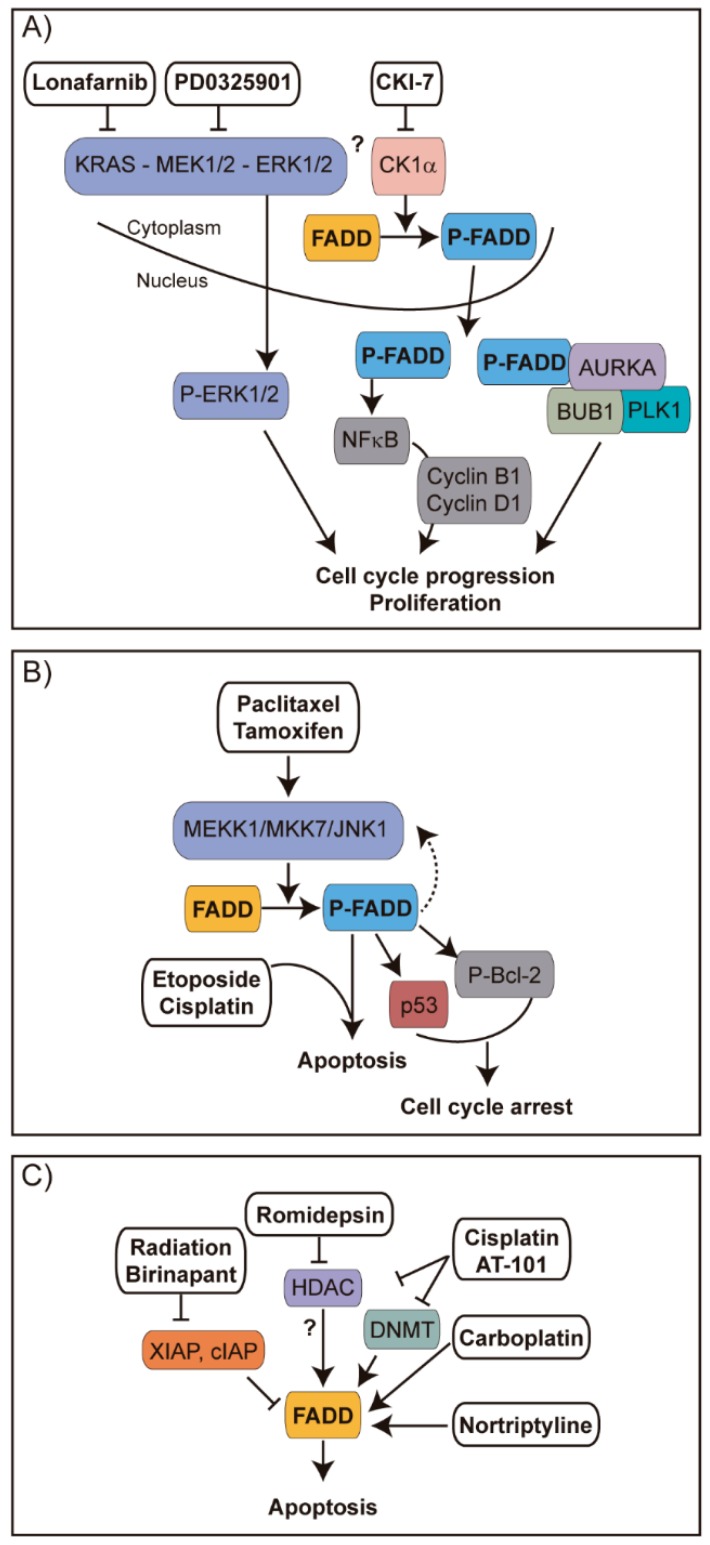
FADD was initially described as an adaptor molecule for death receptor-mediated apoptosis, but subsequently it has been implicated in nonapoptotic cellular processes such as proliferation and cell cycle control. During the last decade, FADD has been shown to play a pivotal role in most of the signalosome complexes, such as the necroptosome and the inflammasome. Interestingly, various mechanisms involved in regulating FADD functions have been identified, essentially posttranslational modifications and secretion. All these aspects have been thoroughly addressed in previous reviews. However, FADD implication in cancer is complex, due to pleiotropic effects. It has been reported either as anti- or protumorigenic, depending on the cell type. Regulation of FADD expression in cancer is a complex issue since both overexpression and downregulation have been reported, but the mechanisms underlying such alterations have not been fully unveiled. Posttranslational modifications also constitute a relevant mechanism controlling FADD levels and functions in tumor cells. In this review, we aim to provide detailed, updated information on alterations leading to changes in FADD expression and function in cancer. The participation of FADD in various biological processes is recapitulated, with a mention of interesting novel functions recently proposed for FADD, such as regulation of gene expression and control of metabolic pathways. Finally, we gather all the available evidence regarding the clinical implications of FADD alterations in cancer, especially as it has been proposed as a potential biomarker with prognostic value.

Keywords: FADD; chromosomal alterations; clinical implications; epigenetic regulation; gene expression; metabolism; mutations; polymorphisms; posttranslational modifications; transcription factors.


Conflict of interest statement

The authors declare no conflict of interest.

Figures

Figure 1
Figure 1
FADD expression in healthy human tissues, performed by RNA sequencing. (A) Data obtained from BioProject PRJEB4337 of samples from 95 individuals representing 27 different healthy tissues [3]. RPKM, Reads Per Kilobase Million. (B) Data obtained from GTEx Analysis Release V7 (dbGaP Accession phs000424.v7.p2). Expression values are shown in transcripts per million (TPM), calculated from a gene model with isoforms collapsed to a single gene and no other normalization steps applied. Box plots are shown as median and 25th and 75th percentiles; points are displayed as outliers if they are above or below 1.5 times the interquartile range.
Figure 2
Figure 2
FADD expression in cancer. (A) RNA-sequencing data from The Cancer Genome Atlas (TCGA) project of Genomic Data Commons (GDC). Seventeen cancer types representing 21 cancer subtypes with a corresponding major cancer type in The Human Pathology Atlas were included to allow for comparisons with the protein staining data from The Human Protein Atlas. The FPKMs (number fragments per kilobase of exon per million reads) were used for quantification of expression with a detection threshold of 1 FPKM. (B,C) FADD protein levels from The Human Protein Atlas. For each cancer, color-coded bars indicate the percentage of patients (maximum: 12) with high and medium protein expression level. Low or not detected protein expression results in a white bar. (B) Results obtained using HPA001464 antibody. Cases of colorectal, breast, ovarian, urothelial, gastric, pancreatic, and liver cancers, and melanomas showed weak to moderate cytoplasmic positivity. The remaining cancers were negative. (C) Results obtained using CAB010209 antibody. The majority of cancer cells showed weak to moderate cytoplasmic positivity. Nucleolar staining was observed in several cases. A few breast cancers were strongly stained. (D) Selection of five standard cancer tissue samples representative of the overall staining pattern. Scale bar: 50 µm.
Figure 3
Figure 3
FADD expression in human cancer, indicating the occurrence of copy number alterations. Screenshot image modified from cBioPortal. RNA-sequencing data are obtained from TCGA PanCancer Atlas Studies in 10,967 tumor samples from various origins.
Figure 4
Figure 4
FADD mutations. (A) Screenshot modified from cBioPortal. Mutation diagram circles are colored with respect to the corresponding mutation types. In case of different mutation types at a single position, the color of the circle is determined with respect to the most frequent mutation type. (B) Screenshot image modified from IntOGen. The mutations needle plot shows the distribution of the observed cancer mutations along the protein sequence and its possible mutational clusters and hotspots. The needles’ height and head size represent mutational recurrence. Needles of different categories that fall in the same amino acid residues are stacked.
Figure 5
Figure 5
FADD expression in human cancer, indicating the occurrence of mutations. Screenshot image modified from cBioPortal. RNA-sequencing data are obtained from TCGA PanCancer Atlas Studies in 10967 tumor samples from various origins.
Figure 6
Figure 6
Example of FADD expression quantitative trait loci (eQTLs), or FADD genetic variants exhibiting high correlation with changes in gene expression. Screenshot from GTEx Portal showing, for variant ID chr11_70241122_G_GCTT_b38, SNP rs559543475, single-tissue eQTL normalized effect size (NES) with 95% confidence interval (left) and Single-tissue eQTL p-value vs. Multi-tissue posterior probability (right). The Y axis indicates the −log10 of p-value (obtained from a t-test that compares observed beta from single-tissue eQTL analysis to a null beta of 0). The X axis indicates the m-value, which indicates the posterior probability that an eQTL effect exists in each tissue tested in the cross-tissue meta-analysis. The m-value ranges between 0 and 1 and is interpreted as follows: m-value < 0.1 indicates that the tissue is predicted to not have an eQTL effect; m-value > 0.9 indicates that the tissue is predicted to have an eQTL effect; otherwise, the prediction of the existence of an eQTL effect is ambiguous [58]. Normalized effect size (NES): the slope of the linear regression of normalized expression data versus the three genotype categories using single-tissue eQTL analysis, representing eQTL effect size. The normalized expression values are based on quantile normalization within each tissue, followed by inverse quantile normalization for each gene across samples. Colors represent distinct tissue categories.
Figure 7
Figure 7
Screenshot image from SCREEN hg19 (search candidate cis-regulatory elements by ENCODE). This search is showing candidate cis-regulatory elements located between the first and last transcription start sites (TSSs) of FADD and up to 50 kb upstream.
Figure 8
Figure 8
Kaplan‒Meier plots for cancer types where high FADD expression has significant (p < 0.001) association with patient survival. Based on the FPKM value, patients were divided based on FADD mRNA level into one of the two groups “low” (under cutoff) or “high” (over cutoff). The X-axis shows time for survival (years) and the Y-axis shows the probability of survival, where 1.0 corresponds to 100 percent. The prognosis of each group of patients was examined by Kaplan‒Meier survival estimators, and the survival outcomes of the two groups were compared by log-rank tests. (From The Human Protein Atlas).
Figure 9
Figure 9
Alterations of FADD levels reported in different cancer types. For each tumor type, reported evidence of an increase (upwards red arrow) or a decrease (downwards green arrow) of FADD levels is shown, indicating the underlying mechanism when this information is available (references indicated in brackets). Arrows including a “P” indicate changes also affecting the levels of phosphorylated FADD. Anticancer therapies reported to target FADD in certain tumor types are shown in white boxes, and their mechanisms of action are detailed in Figure 10. Templates to build this figure were obtained from SMART Servier Medical Art (Attribution 3.0 Unported, CC BY 3.0).
Figure 10
Figure 10
Strategies for therapeutic intervention of cancer involving FADD. (A) In lung cancer, CKIα-mediated phosphorylation of FADD leads to the translocation of S194-P-FADD to the nucleus, where it can induce expression of cyclins B1 and D1 through NF-κB signaling [5], or it can interact with key G2/M transition proteins like AURKA, PLK1 or BUB1 [102], promoting cell cycle progression and proliferation. Inhibiting KRAS with Lonafarnib, MEK with PD0325901, or CK1α with CKI-7 decreased the abundance of phosphorylated FADD and decreased cell proliferation, apparently due to a loss of interaction between FADD and the G2/M transition proteins. As a result, tumor treated cells would fail to progress through G2/M. (B) Tamoxifen and paclitaxel in breast cancer [155] and paclitaxel in prostate cancer [165] have been reported to activate the MEKK1/MKK7/JNK pathway, which contributes to FADD phosphorylation. In breast cancer, this results in cell cycle arrest and suppression of cancer growth through p53 stabilization or Bcl-2 phosphorylation. In prostate cancer, phosphorylated FADD in turn upregulates MEKK1 and downstream JNK1 activation, which is essential for sensitization to apoptosis induced by etoposide or cisplatin combined with paclitaxel [165]. Thus, chemosensitization can be amplified through FADD phosphorylation and the MEKK1/MKK7/JNK1 pathway. (C) In head and neck cancer, the SMAC mimetic Birinapant plus radiation induces tumor regression [16]. Radiation induces DNA damage and in consequence the intrinsic cell death pathway through mitochondrial release of SMAC. The negative effect of SMAC on IAPs is enhanced by SMAC mimetic Birinapant, resulting in degradation of IAPs to enhance FADD-involving DR-induced apoptosis. In chronic lymphocytic leukemia, the HDAC inhibitor Romidepsin sensitizes tumor cells to TRAIL-induced apoptosis through enhancement of FADD recruitment to the DISC [164]. In ovarian cancer, the combination of the BH3-mimetic molecule AT-101 with cisplatin strongly sensitize cells towards apoptosis; they inhibit HDAC and DNA methyltransferase (DNMT) enzyme activities and they induce FADD expression among other apoptosis-related genes [163]. Carboplatin and Nortriptyline also favor FADD expression in tongue carcinoma [161] and bladder cancer cells [162], respectively.

Similar articles

Cited by

References

    1. Chinnaiyan A.M., O’Rourke K., Tewari M., Dixit V.M. FADD, a novel death domain-containing protein, interacts with the death domain of Fas and initiates apoptosis. Cell. 1995;81:505–512. doi: 10.1016/0092-8674(95)90071-3. - DOI - PubMed
    1. Yeh W.C., de la Pompa J.L., McCurrach M.E., Shu H.B., Elia A.J., Shahinian A., Ng M., Wakeham A., Khoo W., Mitchell K., et al. FADD: Essential for embryo development and signaling from some, but not all, inducers of apoptosis. Science. 1998;279:1954–1958. doi: 10.1126/science.279.5358.1954. - DOI - PubMed
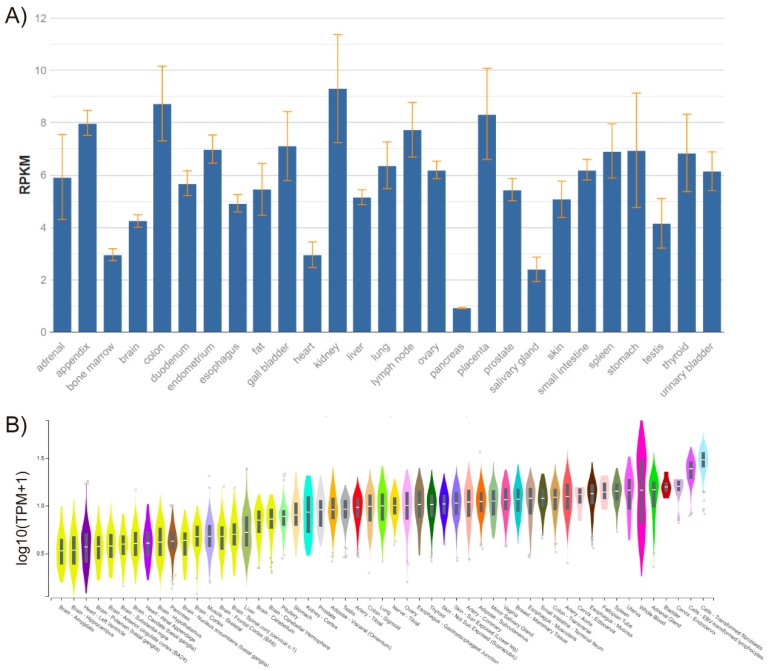
    1. Fagerberg L., Hallstrom B.M., Oksvold P., Kampf C., Djureinovic D., Odeberg J., Habuka M., Tahmasebpoor S., Danielsson A., Edlund K., et al. Analysis of the human tissue-specific expression by genome-wide integration of transcriptomics and antibody-based proteomics. Mol. Cell. Proteom. 2014;13:397–406. doi: 10.1074/mcp.M113.035600. - DOI - PMC - PubMed
    1. Callegari C.C., Cavalli I.J., Lima R.S., Jucoski T.S., Torresan C., Urban C.A., Kuroda F., Anselmi K.F., Cavalli L.R., Ribeiro E.M. Copy number and expression analysis of FOSL1, GSTP1, NTSR1, FADD and CCND1 genes in primary breast tumors with axillary lymph node metastasis. Cancer Genet. 2016;209:331–339. doi: 10.1016/j.cancergen.2016.06.003. - DOI - PubMed
    1. Chen G., Bhojani M.S., Heaford A.C., Chang D.C., Laxman B., Thomas D.G., Griffin L.B., Yu J., Coppola J.M., Giordano T.J., et al. Phosphorylated FADD induces NF-kappaB, perturbs cell cycle, and is associated with poor outcome in lung adenocarcinomas. Proc. Natl. Acad. Sci. USA. 2005;102:12507–12512. doi: 10.1073/pnas.0500397102. - DOI - PMC - PubMed