

MYB Gene Family in Potato (Solanum tuberosum L.): Genome-Wide Identification of Hormone-Responsive Reveals Their Potential Functions in Growth and Development
- PMID: 31569557
- PMCID: PMC6801432
- DOI: 10.3390/ijms20194847
MYB Gene Family in Potato (Solanum tuberosum L.): Genome-Wide Identification of Hormone-Responsive Reveals Their Potential Functions in Growth and Development
Abstract
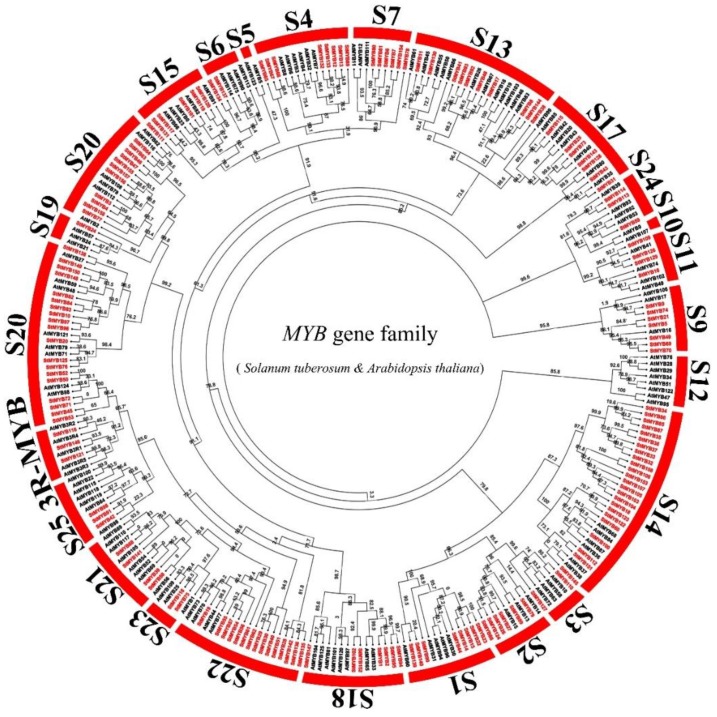
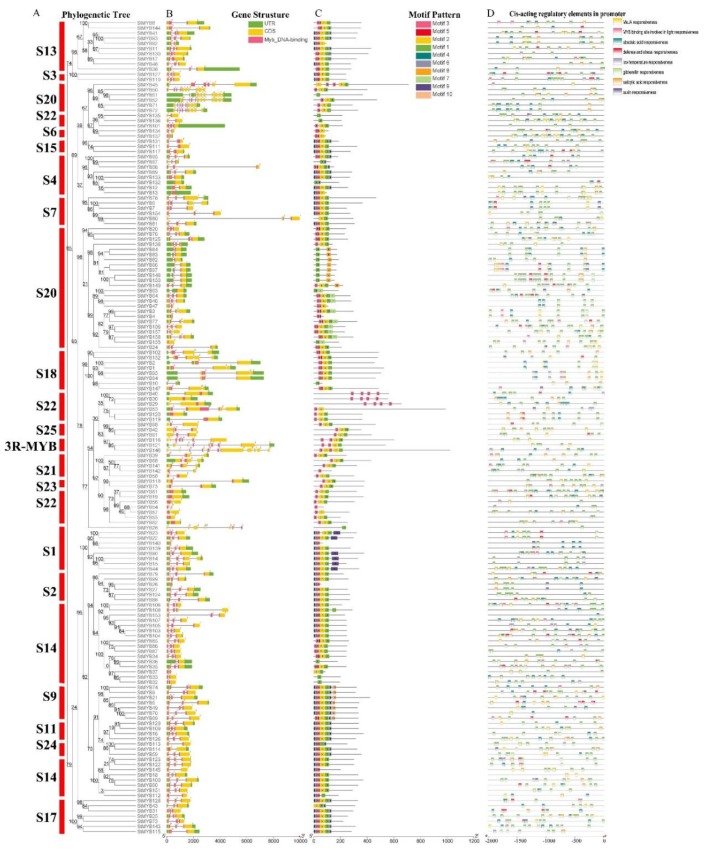
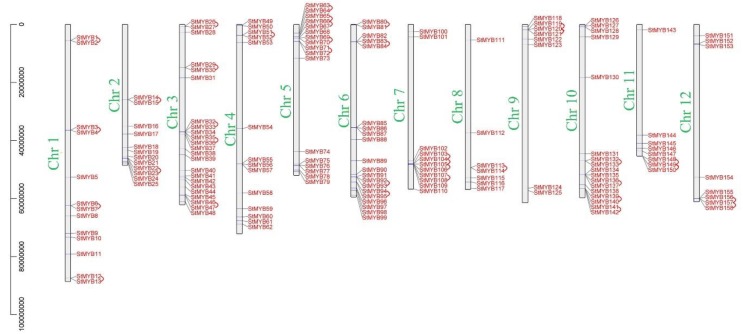
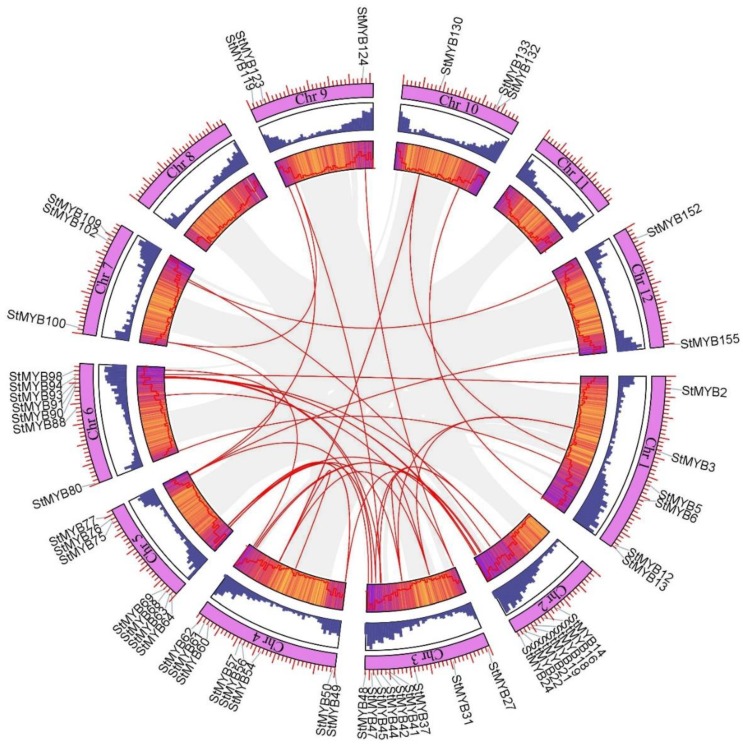
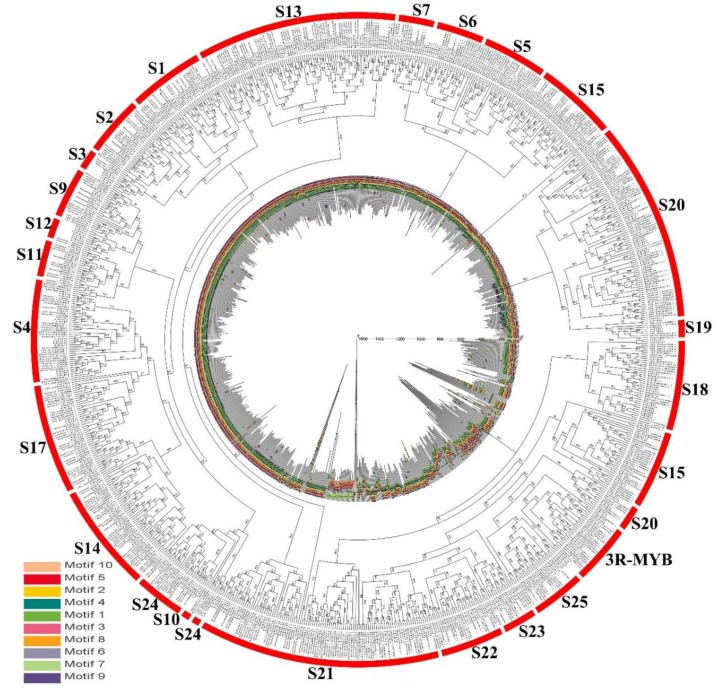
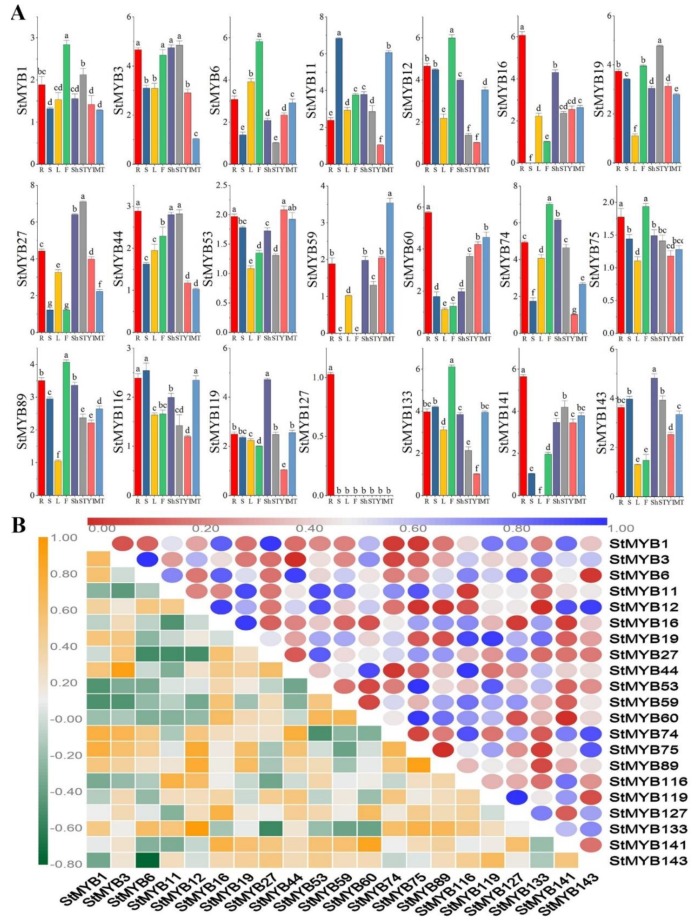
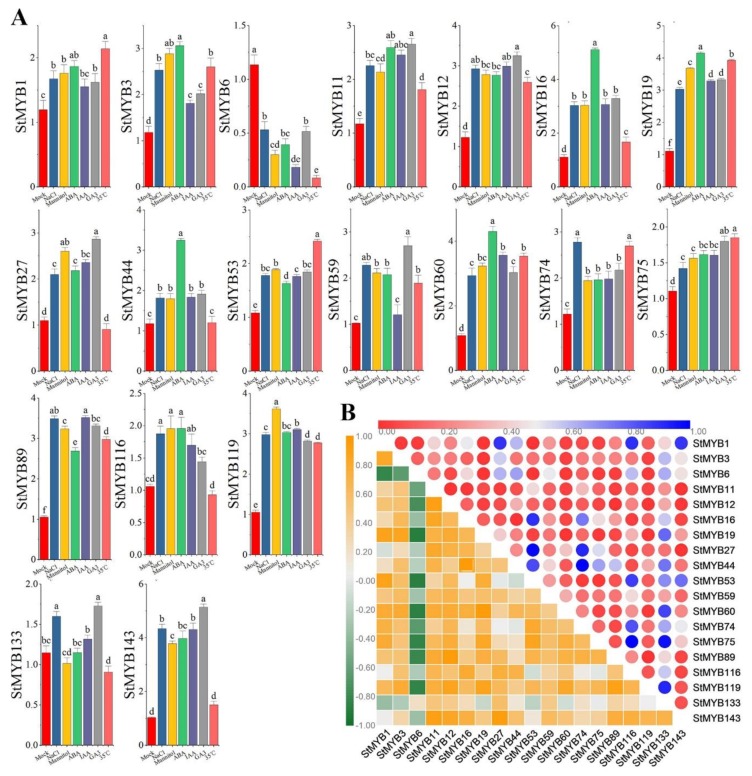
As an important nongrain crop, the growth and yield of potato (Solanum tuberosum L.) is often affected by an unfavorable external environment in the process of cultivation. The MYB family is one of the largest and most important gene families, participating in the regulation of plant growth and development and response to abiotic stresses. Several MYB genes in potato that regulate anthocyanin synthesis and participate in abiotic stress responses have been identified. To identify all Solanum tuberosum L. MYB (StMYB) genes involved in hormone or stress responses to potentially regulate potato growth and development, we identified the MYB gene family at the genome-wide level. In this work, 158 StMYB genes were found in the potato genome. According to the amino acid sequence of the MYB domain and gene structure, the StMYB genes were divided into R2R3-MYB and R1R2R3-MYB families, and the R2R3-MYB family was divided into 20 subgroups (SGs). The expression of 21 StMYB genes from different SGs in roots, stems, leaves, flowers, shoots, stolons, young tubers, and mature tubers was determined by quantitative real-time polymerase chain reaction (qRT-PCR). The expression patterns of StMYB genes in potatoes treated with abscisic acid (ABA), indole-3-acetic acid (IAA), gibberellin acid 3 (GA3), NaCl, mannitol, and heat were also measured. We have identified several potential candidate genes that regulate the synthesis of potato flavonoids or participate in hormone or stress responses. This work provides a comprehensive understanding of the MYB family in potato and will lay a foundation for the future investigation of the potential functions of StMYB genes in the growth and development of potato.
Keywords: StMYB; expression patterns; hormone or stress responses; potato genome.
Conflict of interest statement
The authors declare no conflict of interest.
Figures
Similar articles
-
Systematic Analysis of MYB Family Genes in Potato and Their Multiple Roles in Development and Stress Responses.Biomolecules. 2019 Jul 30;9(8):317. doi: 10.3390/biom9080317. Biomolecules. 2019. PMID: 31366107 Free PMC article.
-
Genomic survey and gene expression analysis of the MYB-related transcription factor superfamily in potato (Solanum tuberosum L.).Int J Biol Macromol. 2020 Dec 1;164:2450-2464. doi: 10.1016/j.ijbiomac.2020.08.062. Epub 2020 Aug 11. Int J Biol Macromol. 2020. PMID: 32795581
-
Genome-wide analysis and expression profiles of the StR2R3-MYB transcription factor superfamily in potato (Solanum tuberosum L.).Int J Biol Macromol. 2020 Apr 1;148:817-832. doi: 10.1016/j.ijbiomac.2020.01.167. Epub 2020 Jan 18. Int J Biol Macromol. 2020. PMID: 31962068
-
Role of microRNAs and their putative mechanism in regulating potato (Solanum tuberosum L.) life cycle and response to various environmental stresses.Plant Physiol Biochem. 2024 Feb;207:108334. doi: 10.1016/j.plaphy.2024.108334. Epub 2024 Jan 3. Plant Physiol Biochem. 2024. PMID: 38219424 Review.
-
Abiotic stress elements in in vitro potato (Solanum tuberosum L.) exposed to air-based and liquid-based ultrasound: A comparative transcriptomic assessment.Prog Biophys Mol Biol. 2020 Dec;158:47-56. doi: 10.1016/j.pbiomolbio.2020.09.001. Epub 2020 Sep 8. Prog Biophys Mol Biol. 2020. PMID: 32916176 Review.
Cited by
-
Genome-wide identification of the longan R2R3-MYB gene family and its role in primary and lateral root.BMC Plant Biol. 2023 Sep 23;23(1):448. doi: 10.1186/s12870-023-04464-9. BMC Plant Biol. 2023. PMID: 37741992 Free PMC article.
-
Genome-wide analysis of R2R3-MYB transcription factors family in the autopolyploid Saccharum spontaneum: an exploration of dominance expression and stress response.BMC Genomics. 2021 Aug 18;22(1):622. doi: 10.1186/s12864-021-07689-w. BMC Genomics. 2021. PMID: 34404342 Free PMC article.
-
Mapping QTL/QTN and mining candidate genes for plant height and its response to planting densities in soybean [Glycine max (L.) Merr.] through a FW-RIL population.Mol Breed. 2021 Feb 3;41(2):12. doi: 10.1007/s11032-021-01209-0. eCollection 2021 Feb. Mol Breed. 2021. PMID: 37309477 Free PMC article.
-
Genome-wide identification of R2R3-MYB family in wheat and functional characteristics of the abiotic stress responsive gene TaMYB344.BMC Genomics. 2020 Nov 12;21(1):792. doi: 10.1186/s12864-020-07175-9. BMC Genomics. 2020. PMID: 33183233 Free PMC article.
-
Genome-wide identification and transcriptome analysis of the cytochrome P450 genes revealed its potential role in the growth of Flammulina filiformis.BMC Genomics. 2025 Apr 7;26(1):346. doi: 10.1186/s12864-025-11555-4. BMC Genomics. 2025. PMID: 40197176 Free PMC article.
References
-
- Goode J.A., Organizers D.C. Improving Plant Drought, Salt and Freezing Tolerance by Gene Transfer of a Single Stress-Inducible Transcription Factor. Nat. Biotechnol. 2007;17:287–291. - PubMed
-
- Wang Z., Tang J., Hu R., Wu P., Hou X.L., Song X.M., Xiong A.S. Genome-wide analysis of the R2R3-MYB transcription factor genes in Chinese cabbage (Brassica rapa ssp. pekinensis) reveals their stress and hormone responsive patterns. BMC Genom. 2015;16:17–38. doi: 10.1186/s12864-015-1216-y. - DOI - PMC - PubMed
-
- Li C., Ng K.Y., Fan L.M. MYB transcription factors, active players in abiotic stress signaling. Environ. Exp. Bot. 2015;114:80–91. doi: 10.1016/j.envexpbot.2014.06.014. - DOI
MeSH terms
Substances
LinkOut - more resources
Full Text Sources
Research Materials
