. 2019 Sep 27;8(10):1161.
doi: 10.3390/cells8101161.

An Efficient and Flexible Method for Deconvoluting Bulk RNA-Seq Data with Single-Cell RNA-Seq Data

Affiliations

An Efficient and Flexible Method for Deconvoluting Bulk RNA-Seq Data with Single-Cell RNA-Seq Data

Xifang Sun et al. Cells. .

Abstract

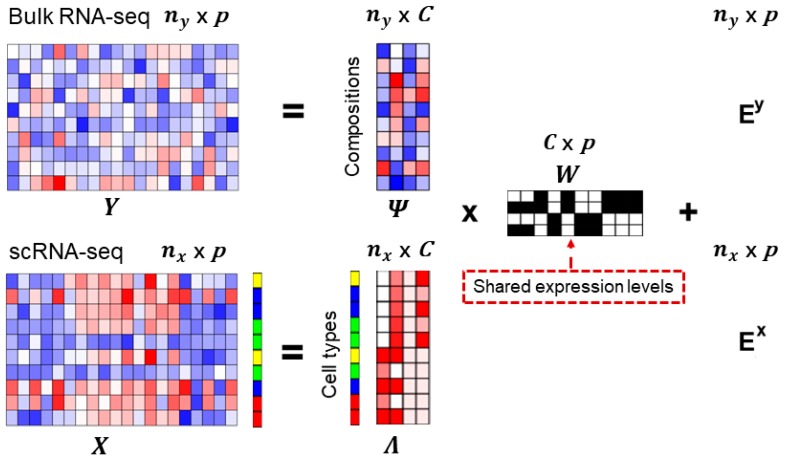
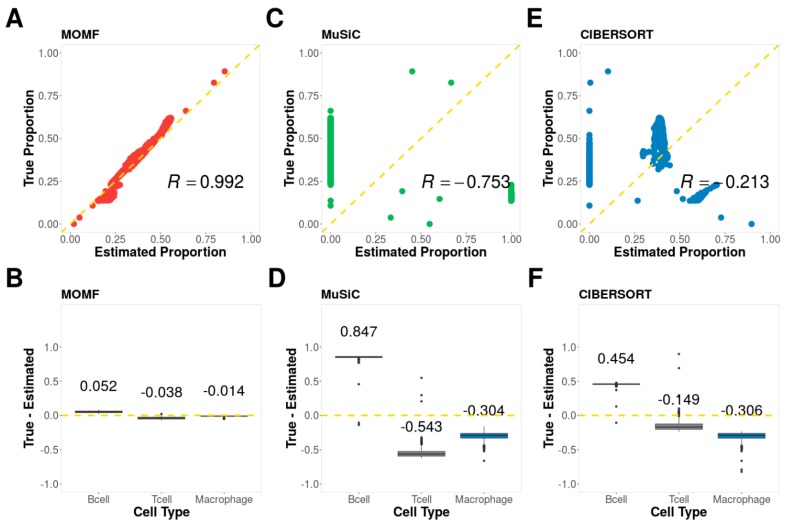
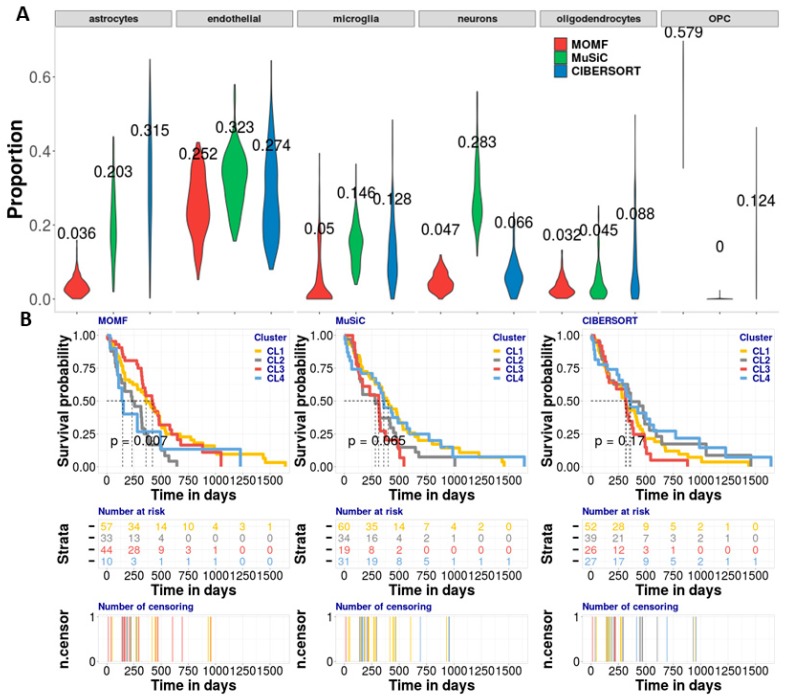
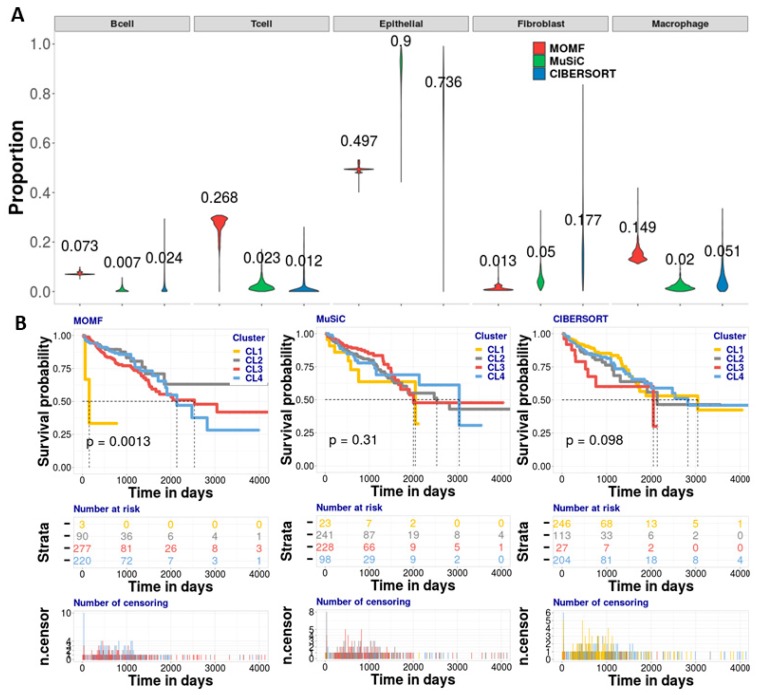
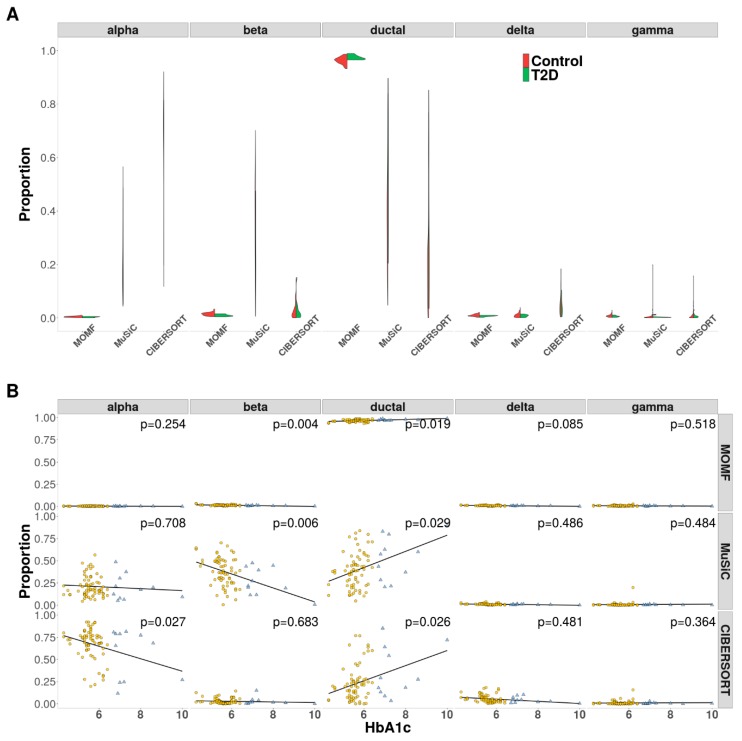
Estimating cell type compositions for complex diseases is an important step to investigate the cellular heterogeneity for understanding disease etiology and potentially facilitate early disease diagnosis and prevention. Here, we developed a computationally statistical method, referring to Multi-Omics Matrix Factorization (MOMF), to estimate the cell-type compositions of bulk RNA sequencing (RNA-seq) data by leveraging cell type-specific gene expression levels from single-cell RNA sequencing (scRNA-seq) data. MOMF not only directly models the count nature of gene expression data, but also effectively accounts for the uncertainty of cell type-specific mean gene expression levels. We demonstrate the benefits of MOMF through three real data applications, i.e., Glioblastomas (GBM), colorectal cancer (CRC) and type II diabetes (T2D) studies. MOMF is able to accurately estimate disease-related cell type proportions, i.e., oligodendrocyte progenitor cells and macrophage cells, which are strongly associated with the survival of GBM and CRC, respectively.

Keywords: cell-type compositions; deconvolution; gene expression; nonnegative matrix factorization; single-cell RNA-seq.


Conflict of interest statement

The authors declare that the research was conducted in the absence of any commercial or financial relationships that could be construed as a potential conflict of interest.

Figures

Figure 1
Figure 1
Overview of Multi-Omics Matrix Factorization (MOMF) framework. MOMF integrates bulk RNA-seq data and scRNA-seq data, to deconvolute the two expression matrices by the shared information and estimate the cell-type proportions for each individual. Specifically, MOMF jointly models both bulk RNA-seq count matrix Y and scRNA-seq count matrix X to infer the cell compositions Ψ of bulk RNA-seq data and low-rank matrix Λ of scRNA-seq data via matrix factorization, i.e., Y=ΨW+Ey and X=ΛW+Ex, where W is the common shared gene expression levels and Ey and Ex represent the residual errors for bulk RNA-seq data and scRNA-seq data, respectively. The heatmaps are used to illustrate the gene expression level (Y and X); cell specific expression levels (bulk RNA-seq: Ψ; scRNA-seq: Λ); and gene specific expression levels (W). The color bar along with the heatmaps of scRNA-seq data represents the cell types. ny is the number of individuals; nx is the number of cells; p is the number of common shared genes; C is the number of cell types.
Figure 2
Figure 2
Simulation results. The simulated data based three cell types, B cells, T cells, and Macrophage cells. (A) The scatter plot of ground truth and cell type proportion estimated by MOMF; (B) The boxplot to show the difference between ground truth and cell type proportion estimated by MOMF (C) The scatter plot of ground truth and cell type proportion estimated by MuSiC; (D) The boxplot to show the difference between ground truth and cell type proportion estimated by MuSiC (E) The scatter plot of ground truth and cell type proportion estimated by CIBERSORT; (F) The boxplot to show the difference between ground truth and cell type proportion estimated by CIBERSORT. R: Pearson correlation.
Figure 3
Figure 3
Analyzing GBM bulk RNA-seq data with brain scRNA-seq data. (A) The violin plot is to show the effect proportion of each cell type from three different deconvolution methods. We found that the OPCs and endothelial cells are enriched by MOMF, which means that the two cell types potentially contribute to the survival of GBM. (B) The KM plots are used to show the survival analysis for four clusters from the TCGA bulk RNAseq data. We use log-rank test to compare the distributions of four clusters. MOMF grouped the GBM samples into four subtypes (p-value = 0.007). The cluster CL4 is the poor-prognosis. Number at risk in the table shows the number of survival individuals at each 250 days. Number of censoring in the table shows censoring time of each individual. The numbers labeled in different colors in the two tables indicate the different subtypes.
Figure 4
Figure 4
Analyzing CRC bulk RNA-seq data with colorectal cancer scRNA-seq data. (A) The violin plot is to show the effect proportion of each cell type from three different methods. We found that the epithelial, T and macrophage cells are enriched by MOMF, which means that the two cell types potentially contribute to the survival of CRC. (B) The KM plots are used to show the survival analysis for four clusters from the TCGA bulk data. We used log-rank test to compare the distributions of four clusters. MOMF grouped the CRC samples into four subtypes (p-value = 0.0013). The cluster CL1 shows the poor-prognosis. Number at risk in the table shows the number of survival individuals at each 1,000 days. Number of censoring in the table shows censoring time of each individual. The numbers labeled in different colors in the two tables indicate the different subtypes.
Figure 5
Figure 5
AnalyzingT2D bulk RNA-seq data with pancreatic scRNA-seq data. (A) The violin plot is to show the effect proportion of each cell type from three different methods. beta and ductal cells are enriched from MOMF, which means that the two cell types potentially contribute to the survival of CRC. (B) The scatter plots are used to show the results of the associations between Hb1Ac level and cell proportion as adjust the covariates. The estimated beta cell proportions by both MOMF and MuSiC are strongly associated with Hb1Ac (p-value = 0.004 and 0.006).

Similar articles

Cited by

References

    1. Wagner J., Rapsomaniki M.A., Chevrier S., Anzeneder T., Langwieder C., Dykgers A., Rees M., Ramaswamy A., Muenst S., Soysal S.D., et al. A Single-Cell Atlas of the Tumor and Immune Ecosystem of Human Breast Cancer. Cell. 2019;177:1330–1345.e1318. doi: 10.1016/j.cell.2019.03.005. - DOI - PMC - PubMed
    1. Van Hove H., Martens L., Scheyltjens I., De Vlaminck K., Pombo Antunes A.R., De Prijck S., Vandamme N., De Schepper S., Van Isterdael G., Scott C.L., et al. A single-cell atlas of mouse brain macrophages reveals unique transcriptional identities shaped by ontogeny and tissue environment. Nat. Neurosci. 2019;22:1021–1035. doi: 10.1038/s41593-019-0393-4. - DOI - PubMed
    1. Yuan L., Guo F., Wang L., Zou Q. Prediction of tumor metastasis from sequencing data in the era of genome sequencing. Brief. Funct. Genom. 2019 doi: 10.1093/bfgp/elz010. - DOI - PubMed
    1. Smolders J., Heutinck K.M., Fransen N.L., Remmerswaal E.B., Hombrink P., Ten Berge I.J., van Lier R.A., Huitinga I., Hamann J. Tissue-resident memory T cells populate the human brain. Nat. Commun. 2018;9:4593. doi: 10.1038/s41467-018-07053-9. - DOI - PMC - PubMed
    1. Altschuler S.J., Wu L.F. Cellular Heterogeneity: Do Differences Make a Difference? Cell. 2010;141:559–563. doi: 10.1016/j.cell.2010.04.033. - DOI - PMC - PubMed

Publication types