. 2019 Sep 27;20(19):4815.
doi: 10.3390/ijms20194815.

Decorin Secreted by Human Umbilical Cord Blood-Derived Mesenchymal Stem Cells Induces Macrophage Polarization via CD44 to Repair Hyperoxic Lung Injury

Affiliations

Decorin Secreted by Human Umbilical Cord Blood-Derived Mesenchymal Stem Cells Induces Macrophage Polarization via CD44 to Repair Hyperoxic Lung Injury

Ji Hye Kwon et al. Int J Mol Sci. .

Abstract

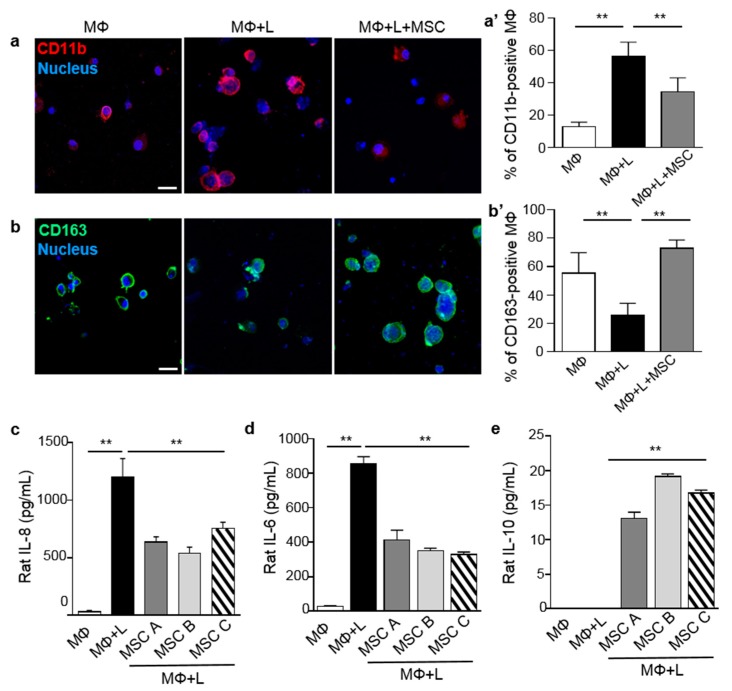
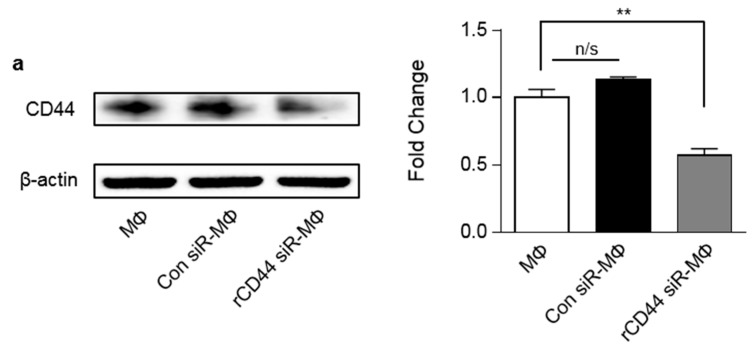
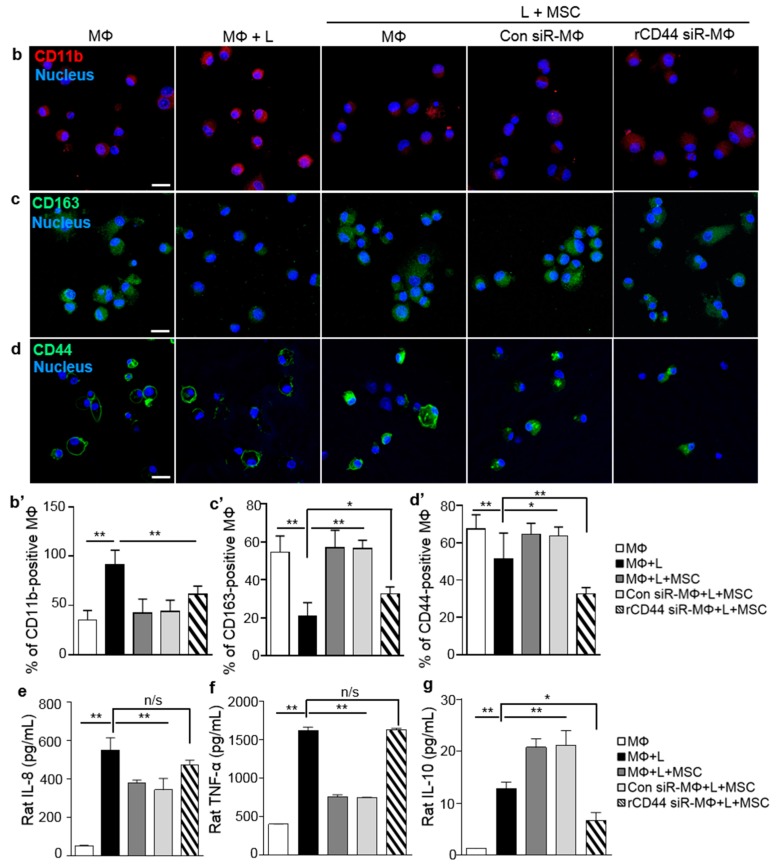
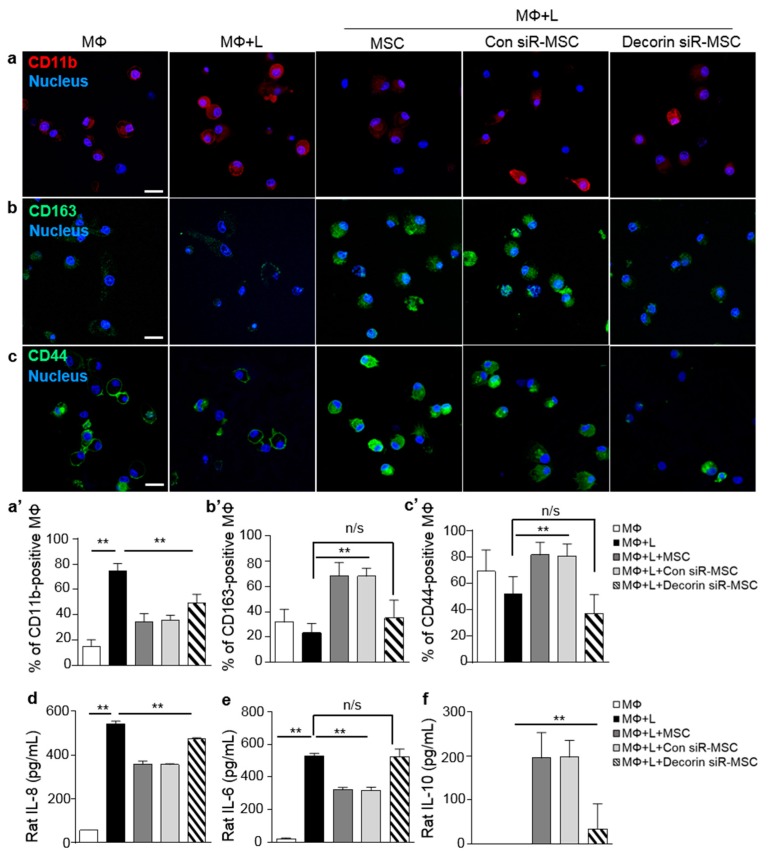
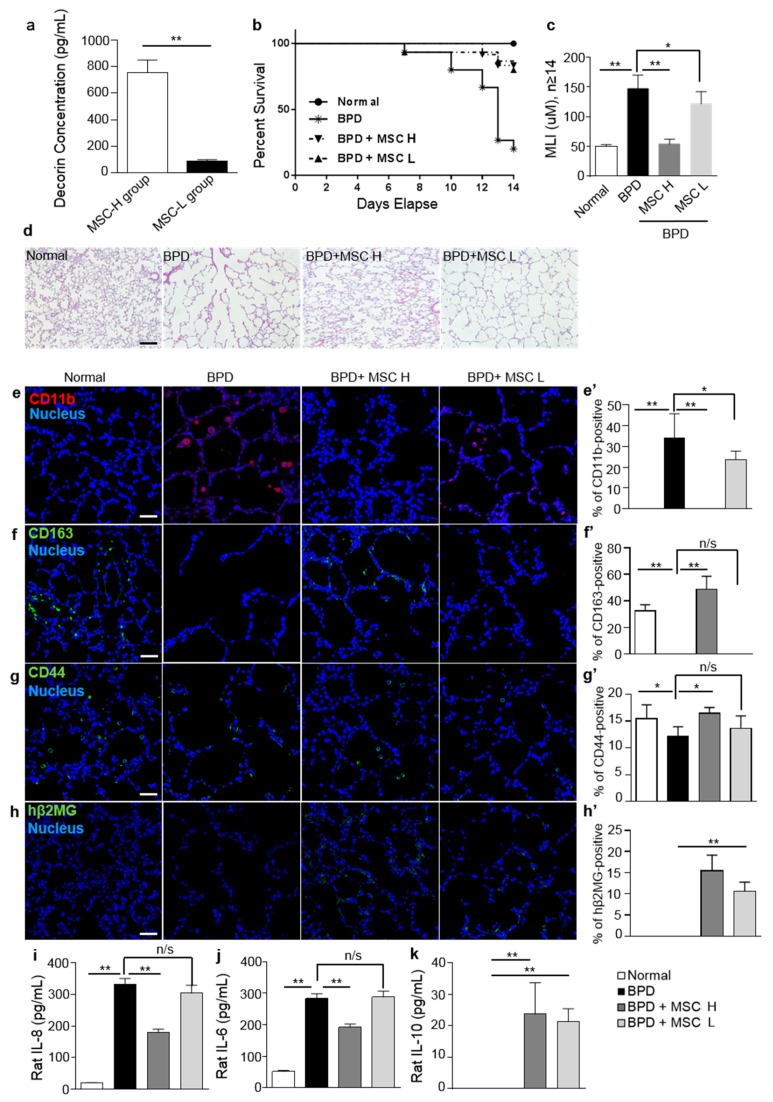
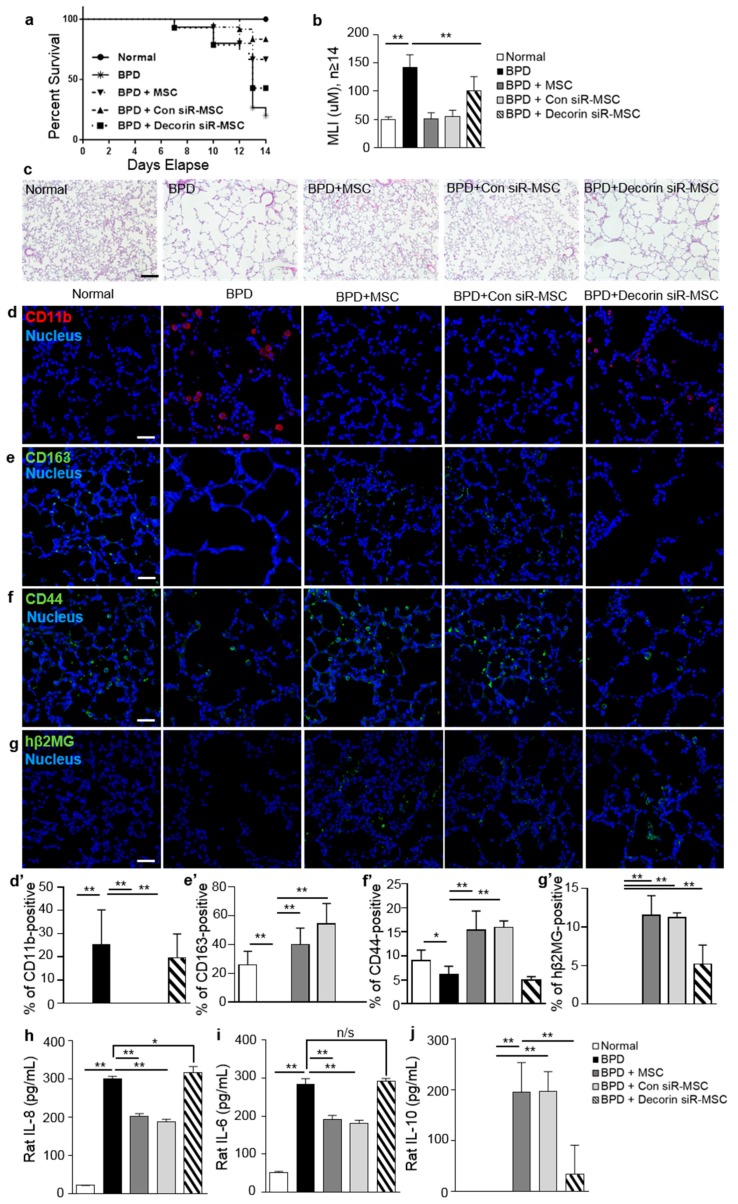
Bronchopulmonary dysplasia (BPD), caused by hyperoxia in newborns and infants, results in lung damage and abnormal pulmonary function. However, the current treatments for BPD are steroidal and pharmacological therapies, which cause neurodevelopmental impairment. Treatment with umbilical cord blood-derived mesenchymal stem cells (UCB-MSCs) is an efficient alternative approach. To prevent pulmonary inflammation in BPD, this study investigated the hypothesis that a key regulator was secreted by MSCs to polarize inflammatory macrophages into anti-inflammatory macrophages at inflammation sites. Lipopolysaccharide-induced macrophages co-cultured with MSCs secreted low levels of the inflammatory cytokines, IL-8 and IL-6, but high levels of the anti-inflammatory cytokine, IL-10. Silencing decorin in MSCs suppressed the expression of CD44, which mediates anti-inflammatory activity in macrophages. The effects of MSCs were examined in a rat model of hyperoxic lung damage. Macrophage polarization differed depending on the levels of decorin secreted by MSCs. Moreover, intratracheal injection of decorin-silenced MSCs or MSCs secreting low levels of decorin confirmed impaired alveolarization of damaged lung tissues by down-regulation of decorin. In tissues, a decrease in the anti-inflammatory macrophage marker, CD163, was observed via CD44. Thus, we identified decorin as a key paracrine factor, inducing macrophage polarization via CD44, a master immunoregulator in mesenchymal stem cells.

Keywords: CD44; bronchopulmonary dysplasia; decorin; macrophage polarization; mesenchymal stem cell.


Conflict of interest statement

The funders had no role in the design of the study; in the collection, analyses, or interpretation of data; in the writing of the manuscript, or in the decision to publish the results.

Figures

Figure 1
Figure 1
Mesenchymal stem cells (MSCs) attenuate M1 activation and facilitate M2 activation. (a,a’) Rat alveolar macrophages (NR8383) stimulated by lipopolysaccharide (LPS) were co-cultured with MSCs for 3 days. LPS-activated macrophages expressed the M1 marker, CD11b. (b,b’) The number of macrophages stained for the M2 marker, CD163, increased after co-culture with MSCs. CD11b-positive macrophages and CD163-positive macrophages were analyzed according to the percentage of CD11b- and CD163-positive cells. Red (CD11b) and green (CD163) staining indicated cells positive for these markers. Nuclei were stained with Hoechst 33342. (ce) The secretion of the inflammatory markers, IL-8 and IL-6 and the anti-inflammatory marker, IL-10, by macrophages were measured by ELISA. Three different MSCs were tested to confirm the effects of MSCs. All MSCs predisposed macrophages to polarization and subsequent secretion of the anti-inflammatory cytokines indicative of the M2 phenotype. Scale bar = 20 μm. Data are presented as mean ± SD, n = 5 per group. ** p < 0.01. MΦ, macrophage; L, LPS.
Figure 2
Figure 2
Modulation of macrophage functional polarity towards an anti-inflammatory phenotype by MSCs occurs via CD44 on rat macrophages. (a) Rat macrophages were transfected with scrambled siRNA (50 nM) or rat CD44 siRNA (50 nM) for 24 h. After CD44 siRNA transfections, LPS stimulation was performed. Rat CD44 protein expression on macrophages was analyzed by western blotting. Intensity was normalized to macrophages only. (b,b’d,d’) CD44 knockdown in macrophages disrupted macrophage polarization. Confocal microscopy of CD44 siRNA-transfected macrophages showed an increased expression of the M1 marker, CD11b and decreased expression of the M2 marker, CD163, despite treatment with MSCs. Quantitative analysis showed the significant results of knockdown CD44 on macrophages. Nuclei were stained with Hoechst 33342. Red (CD11b) and green (CD163 and CD44) staining indicate positive cells. (eg) Cytokine analysis was performed by ELISA. Supernatants from CD44 siRNA-transfected macrophage cultures also showed high levels of IL-8 and TNF-α, but low levels of IL-10. Scale bar = 20 μm. Data are presented as mean ± SD, n = 5 per group. ** p < 0.01, * p < 0.05. n/s, not significant; MΦ, macrophage; L, LPS; Con siR, scrambled siRNA-transfected control group; rCD44 siR, rat CD44 siRNA-transfected group.
Figure 2
Figure 2
Modulation of macrophage functional polarity towards an anti-inflammatory phenotype by MSCs occurs via CD44 on rat macrophages. (a) Rat macrophages were transfected with scrambled siRNA (50 nM) or rat CD44 siRNA (50 nM) for 24 h. After CD44 siRNA transfections, LPS stimulation was performed. Rat CD44 protein expression on macrophages was analyzed by western blotting. Intensity was normalized to macrophages only. (b,b’d,d’) CD44 knockdown in macrophages disrupted macrophage polarization. Confocal microscopy of CD44 siRNA-transfected macrophages showed an increased expression of the M1 marker, CD11b and decreased expression of the M2 marker, CD163, despite treatment with MSCs. Quantitative analysis showed the significant results of knockdown CD44 on macrophages. Nuclei were stained with Hoechst 33342. Red (CD11b) and green (CD163 and CD44) staining indicate positive cells. (eg) Cytokine analysis was performed by ELISA. Supernatants from CD44 siRNA-transfected macrophage cultures also showed high levels of IL-8 and TNF-α, but low levels of IL-10. Scale bar = 20 μm. Data are presented as mean ± SD, n = 5 per group. ** p < 0.01, * p < 0.05. n/s, not significant; MΦ, macrophage; L, LPS; Con siR, scrambled siRNA-transfected control group; rCD44 siR, rat CD44 siRNA-transfected group.
Figure 3
Figure 3
Decorin knockdown in MSCs attenuates macrophage polarization. (ac) Decorin siRNA-treated MSCs were co-cultured with LPS-induced macrophages and macrophage polarization was assessed. (a’c’) Immunofluorescent staining with CD11b, CD163, and CD44 were analyzed according to the percentage of positively stained cells. Red (CD11b) and green (CD163 and CD44) staining indicate positive cells. Nuclei were stained with Hoechst 33342. (d) IL-8, (e) IL-6, and (f) IL-10 levels in co-cultures of macrophages and MSCs were analyzed by ELISA. Data are presented as mean ± SD, n = 5 per group. Scale bar = 20 μm. ** p < 0.01. n/s, not significant; MΦ, macrophage; L, LPS.
Figure 4
Figure 4
MSCs promote tissue repair in a hyperoxic lung injury rat model. The normal group was raised under normoxic conditions, whereas the experimental groups (bronchopulmonary dysplasia (BPD), BPD + MSC H, or MSC L) were raised under hyperoxia conditions (90% oxygen) from 10 h after birth to postnatal day (P14). On day 5, 1 × 10⁵ MSCs were injected intratracheally. Rat pups were sacrificed and lung tissues and bronchoalveolar lavage fluid (BALF) samples were collected on P14. (a) MSCs were divided into two groups (MSC-H and MSC-L) according to their decorin expression levels. Decorin secretion by MSCs was quantified by secretome analysis and ELISA. Supernatants from co-cultures of macrophages and MSCs showed different levels of decorin. (b) MSC H lot was selected from MSC-H groups and MSC L lot was selected from MSC-L groups. Kaplan–Meier survival curve at birth and P14. (c) Morphometric analysis of lung tissues was performed to determine the degree of alveolarization by measuring the mean linear intercept (MLI). (d) Lung tissue samples were sectioned and stained with hematoxylin and eosin (H&E). (eg) CD11b, CD163, and CD44 were stained in rat lung tissues. (h) Immunofluorescence staining of human β2 microglobulin (hβ2MG) was used to visualize the engrafted MSCs. (e’h’) Positively stained cells were analyzed and presented as percentages. Red (CD11b) and green (CD163, CD44, and hβ2MG) staining indicate positive cells. Nuclei were stained with Hoechst 33342. (ik) Lung bronchoalveolar lavage fluid (BALF) samples were collected to analyze the pro-inflammatory cytokines, IL-8 and IL-6 and the anti-inflammatory cytokine, IL-10, by ELISA. Data are presented as mean ± SD for n = 11 (normal) or 15 (BPD, BPD + MSC H, and MSC L) per group. Scale bar = 40 μm. ** p < 0.01, * p < 0.05. n/s, not significant; BPD, bronchopulmonary dysplasia.
Figure 5
Figure 5
Decorin knockdown suppressed the therapeutic effects of MSCs by down-regulating macrophage polarization. Decorin-silenced MSCs were intratracheally injected in BPD rats. (a) Decorin siRNA-transfected MSCs were intratracheally injected on day 5. Daily survival rates during 14 d from birth are presented as Kaplan–Meier survival curves. (b) Lung tissues on P14 were analyzed by histological and morphogenic comparison with the control group (normal). The mean linear intercept (MLI) values were determined by the degree of alveolarization. (c) Lung tissue samples were sectioned and stained with H&E. Data are presented as mean ± SD for n = 11 (normal), 15 (BPD, BPD with MSC), or 14 (co-cultured with MSCs or scrambled siRNA-transfected MSCs (Con siR-MSC), Decorin siR-MSC) per group. ** p < 0.01, *p < 0.05. n/s, not significant; BPD, bronchopulmonary dysplasia. (d,d’f,f’) Immunofluorescence analysis was performed with CD11b, CD163, and CD44 antibodies in lung tissues obtained from rats with hyperoxic lung injury. (g,g’) Transplanted MSCs were detected by hβ2MG (green) staining of rat lung tissues. Blue staining represents nuclei stained with Hoechst 33342. Red (CD11b) and green (CD163 and CD44) staining indicate positive cells. (hj) The levels of cytokines IL-8, IL-6, and IL-10, were analyzed by ELISA on P14. Data are presented as mean ± SD, n = 5 per group. Scale bar = 40 μm. ** p < 0.01, * p < 0.05. n/s, not significant; MΦ, macrophage; L, LPS.

Similar articles

Cited by

References

    1. Mushtaq A. Progress needed in bronchopulmonary dysplasia. Lancet Respir. Med. 2019;7:300–301. doi: 10.1016/S2213-2600(19)30075-X. - DOI - PubMed
    1. Michael Z., Spyropoulos F., Ghanta S., Christou H. Bronchopulmonary Dysplasia: An Update of Current Pharmacologic Therapies and New Approaches. Clin. Med. Insights Pediatr. 2018;12:1179556518817322. doi: 10.1177/1179556518817322. - DOI - PMC - PubMed
    1. Hilgendorff A., O’Reilly M.A. Bronchopulmonary dysplasia early changes leading to long-term consequences. Front. Med. (Lausanne) 2015;2:2. doi: 10.3389/fmed.2015.00002. - DOI - PMC - PubMed
    1. Baraldi E., Filippone M. Chronic lung disease after premature birth. N. Engl. J. Med. 2007;357:1946–1955. doi: 10.1056/NEJMra067279. - DOI - PubMed
    1. Stocks J., Hislop A., Sonnappa S. Early lung development: Lifelong effect on respiratory health and disease. Lancet Respir. Med. 2013;1:728–742. doi: 10.1016/S2213-2600(13)70118-8. - DOI - PubMed