

Kinetic Transition in Amyloid Assembly as a Screening Assay for Oligomer-Selective Dyes
- PMID: 31569739
- PMCID: PMC6843685
- DOI: 10.3390/biom9100539
Kinetic Transition in Amyloid Assembly as a Screening Assay for Oligomer-Selective Dyes
Abstract
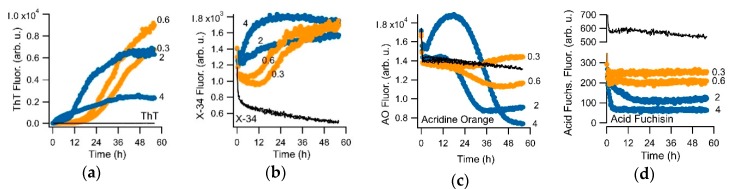
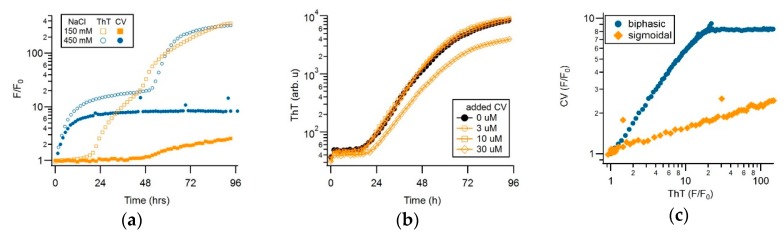
Assembly of amyloid fibrils and small globular oligomers is associated with a significant number of human disorders that include Alzheimer's disease, senile systemic amyloidosis, and type II diabetes. Recent findings implicate small amyloid oligomers as the dominant aggregate species mediating the toxic effects in these disorders. However, validation of this hypothesis has been hampered by the dearth of experimental techniques to detect, quantify, and discriminate oligomeric intermediates from late-stage fibrils, in vitro and in vivo. We have shown that the onset of significant oligomer formation is associated with a transition in thioflavin T kinetics from sigmoidal to biphasic kinetics. Here we showed that this transition can be exploited for screening fluorophores for preferential responses to oligomer over fibril formation. This assay identified crystal violet as a strongly selective oligomer-indicator dye for lysozyme. Simultaneous recordings of amyloid kinetics with thioflavin T and crystal violet enabled us to separate the combined signals into their underlying oligomeric and fibrillar components. We provided further evidence that this screening assay could be extended to amyloid-β peptides under physiological conditions. Identification of oligomer-selective dyes not only holds the promise of biomedical applications but provides new approaches for unraveling the mechanisms underlying oligomer versus fibril formation in amyloid assembly.
Keywords: amyloidosis; assembly pathway; dye fluorescence; oligomer formation; thioflavin T.
Conflict of interest statement
The authors declare no conflict of interest. The funders had no role in the design of the study; in the collection, analyses, or interpretation of data; in the writing of the manuscript, or in the decision to publish the results.
Figures


Similar articles
-
Structural fingerprints and their evolution during oligomeric vs. oligomer-free amyloid fibril growth.J Chem Phys. 2013 Sep 28;139(12):121901. doi: 10.1063/1.4811343. J Chem Phys. 2013. PMID: 24089713 Free PMC article.
-
The dye SYPRO orange binds to amylin amyloid fibrils but not pre-fibrillar intermediates.Protein Sci. 2016 Oct;25(10):1834-40. doi: 10.1002/pro.2992. Epub 2016 Aug 23. Protein Sci. 2016. PMID: 27479186 Free PMC article.
-
An Aggregate Weight-Normalized Thioflavin-T Measurement Scale for Characterizing Polymorphic Amyloids and Assembly Intermediates.Methods Mol Biol. 2018;1777:121-144. doi: 10.1007/978-1-4939-7811-3_6. Methods Mol Biol. 2018. PMID: 29744831
-
In vitro oligomerization and fibrillogenesis of amyloid-beta peptides.Subcell Biochem. 2012;65:53-74. doi: 10.1007/978-94-007-5416-4_3. Subcell Biochem. 2012. PMID: 23224999 Review.
-
Understanding amyloid fibril nucleation and aβ oligomer/drug interactions from computer simulations.Acc Chem Res. 2014 Feb 18;47(2):603-11. doi: 10.1021/ar4002075. Epub 2013 Dec 24. Acc Chem Res. 2014. PMID: 24368046 Review.
Cited by
-
Methods for high throughput discovery of fluoroprobes that recognize tau fibril polymorphs.bioRxiv [Preprint]. 2024 Sep 2:2024.09.02.610853. doi: 10.1101/2024.09.02.610853. bioRxiv. 2024. Update in: Nat Chem. 2025 Aug 14. doi: 10.1038/s41557-025-01889-7. PMID: 39282355 Free PMC article. Updated. Preprint.
-
Crystal Violet Selectively Detects Aβ Oligomers but Not Fibrils In Vitro and in Alzheimer's Disease Brain Tissue.Biomolecules. 2024 May 23;14(6):615. doi: 10.3390/biom14060615. Biomolecules. 2024. PMID: 38927020 Free PMC article.
-
Tau Oligomers in Alzheimer's Disease: Modulation Effect of Osmolytes on Amplified Brain-Derived Tau Oligomers.ACS Chem Neurosci. 2025 Aug 6;16(15):2829-2843. doi: 10.1021/acschemneuro.5c00122. Epub 2025 Jul 18. ACS Chem Neurosci. 2025. PMID: 40681153 Free PMC article.
-
Human RAD51 Protein Forms Amyloid-like Aggregates In Vitro.Int J Mol Sci. 2022 Oct 1;23(19):11657. doi: 10.3390/ijms231911657. Int J Mol Sci. 2022. PMID: 36232958 Free PMC article.
-
Peptide backbone modifications of amyloid β (1-40) impact fibrillation behavior and neuronal toxicity.Sci Rep. 2021 Dec 9;11(1):23767. doi: 10.1038/s41598-021-03091-4. Sci Rep. 2021. PMID: 34887476 Free PMC article.
References
Publication types
MeSH terms
Substances
Grants and funding
LinkOut - more resources
Full Text Sources
