. 2019 Sep 27;10(10):652.
doi: 10.3390/mi10100652.

Assessment of Stickiness with Pressure Distribution Sensor Using Offset Magnetic Force

Affiliations

Assessment of Stickiness with Pressure Distribution Sensor Using Offset Magnetic Force

Takayuki Kameoka et al. Micromachines (Basel). .

Abstract

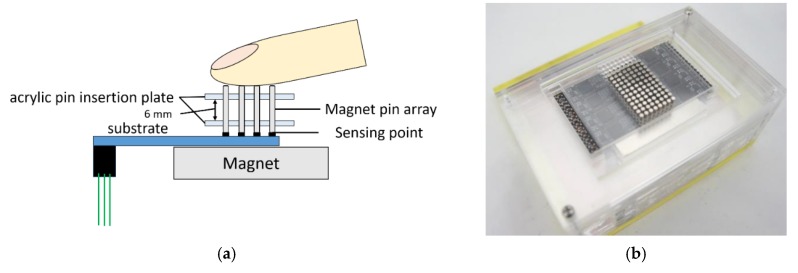
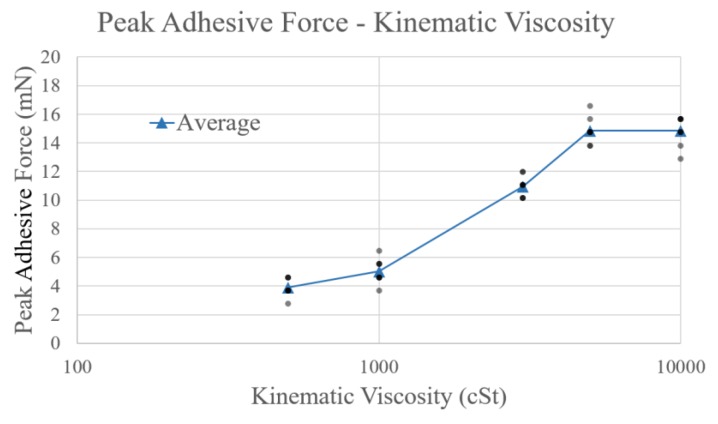
The quantification of stickiness experienced upon touching a sticky or adhesive substance has attracted intense research attention, particularly for application to haptics, virtual reality, and human-computer interactions. Here, we develop and evaluate a device that quantifies the feeling of stickiness experienced upon touching an adhesive substance. Keeping in mind that a typical pressure distribution sensor can only measure a pressing force, but not a tensile force, in our setup, we apply an offset pressure to a pressure distribution sensor and measure the tensile force generated by an adhesive substance as the difference from the offset pressure. We propose a method of using a magnetic force to generate the offset pressure and develop a measuring device using a magnet that attracts magnetic pin arrays and pin magnets; the feasibility of the method is verified with a first prototype. We develop a second prototype that overcomes the noise problems of the first, arising from the misalignment of the pins owing to the bending of the magnetic force lines at the sensor edges. We also obtain measurement results for actual samples and standard viscosity liquids. Our findings indicate the feasibility of our setup as a suitable device for measuring stickiness.

Keywords: haptics; measurement techniques; stickiness; sticky feeling.


Conflict of interest statement

The authors declare no conflict of interest.

Figures

Figure 1
Figure 1
(a) Load cell used for pressure sensing. (b,c) Schematic and photo of sensor substrate comprising 4-by-4 load cells.
Figure 2
Figure 2
Measurement system based on magnet (a) structure, (b) oblique view, (c) base magnet, and (d) circuit board of sensing device. The attractive force between the base magnet and the pin magnets works as a preload to the load cell at the sensing point, enabling measurement of tensile force distribution of adhesive material. Six load cell substrates are mounted on the base board, constituting 96 measurement points.
Figure 2
Figure 2
Measurement system based on magnet (a) structure, (b) oblique view, (c) base magnet, and (d) circuit board of sensing device. The attractive force between the base magnet and the pin magnets works as a preload to the load cell at the sensing point, enabling measurement of tensile force distribution of adhesive material. Six load cell substrates are mounted on the base board, constituting 96 measurement points.
Figure 3
Figure 3
Load cell calibration. We measured load cell value by applying offset pressure by the magnetic force and arbitrary weight.
Figure 4
Figure 4
Magnetic force map. The magnetic force was measured at intervals of 6.25 mm along the length and width directions immediately at the surface of the magnet.
Figure 5
Figure 5
Change in pressure distribution for Nattō (2D view, longitudinal section of the center). The vertical axis represents the force (in milli Newton). The horizontal axis represents the location of the sensing point. The four-digit numbers in each graph show the frame numbers at the time of measurement. Measurements were taken in 0.0165 s/frame (60 fps).
Figure 6
Figure 6
Change in pressure distribution for baby powder (2D view, longitudinal section of the center). The vertical axis represents the force (in milli Newton). The horizontal axis shows the location of the sensing point. The four-digit numbers in each graph show the frame numbers at the time of measurement. Measurements were taken in 0.0165 s/frame (60 fps).
Figure 7
Figure 7
Magnetic lines of force in the setup. The magnetic field lines of the base magnet have a tangential component, generating frictional force between the pin magnet and the pin insertion acrylic plate.
Figure 8
Figure 8
Magnetic field lines of square (a) and rectangular magnets (b). When an infinitely long rectangular magnet is used, the magnetic force line at its center is vertical.
Figure 9
Figure 9
Pin magnet positioned at center and peripheral regions of rectangular magnet. The photographs indicate that the pin can remain vertical because of vertical magnetic lines.
Figure 10
Figure 10
Single-column pin-array measuring device (a) overall view, (b) magnified view of the measurement part.
Figure 11
Figure 11
Procedure of pasting adhesive material on each pin. ① Place the insertion plate over the pin magnet, ② coat with an adhesive sample, ③ remove excess adhesive samples, and ④ remove the insertion plate.
Figure 12
Figure 12
Change in pressure distribution for honey. The vertical axis represents the force (in milli newton). The horizontal plane represents the location of the sensing point.
Figure 13
Figure 13
Change in pressure distribution for toothpaste. The vertical axis represents the force (in milli newton). The horizontal plane represents the location of the sensing point.
Figure 14
Figure 14
Change in pressure distribution for shaving gel. The vertical axis represents the force (in milli newton). The horizontal plane represents the location of the sensing point.
Figure 15
Figure 15
Change in pressure distribution for shampoo. The vertical axis represents the force (in milli newton). The horizontal plane represents the location of the sensing point.
Figure 16
Figure 16
Plot of peak values of adhesive force (mN) and kinematic viscosity (cSt). The blue line indicates the average peak value, whereas the gray points indicate the row data (for standard viscosity liquids of 500, 1000, 3000, 5000, and 10,000 cSt).

References

    1. Hayward V., Levesque V. Experimental evidence of lateral skin strain during tactile exploration; Proceedings of the Eurohaptics; Dublin, Ireland. 6–9 July 2003.
    1. Bicchi A., Scilingo E.P., and De Rossi D. Haptic discrimination of softness in teleoperation: the role of the contact area spread rate. IEEE Trans. Rob. Autom. 2000;16:496–504. doi: 10.1109/70.880800. - DOI
    1. Kimura F., Yamamoto A., Higuchi T. Development of a contact width sensor for tactile tele-presentation of softness; Proceedings of the 18th IEEE International Symposium on Robot and Human Interactive Communication; Toyama, Japan. 27 September–2 October 2009; pp. 34–39.
    1. Levesque V., Jerome P., Hayward V. Braille Display by Lateral Skin Deformation with the STReSS2 Tactile Transducer; Proceedings of the Second Joint EuroHaptics Conference and Symposium on Haptic Interfaces for Virtual Environment and Teleoperator Systems (WHC’07); sukaba, Japan. 22–24 March 2007; pp. 115–120.
    1. Schorr S.B., Okamura A.M. Three-Dimensional Skin Deformation as Force Substitution: Wearable Device Design and Performance During Haptic Exploration of Virtual Environments. IEEE Trans. Haptic. 2017;10:418–430. doi: 10.1109/TOH.2017.2672969. - DOI - PubMed