

Review
doi: 10.3390/s19194203.
Industrial Applications of Terahertz Sensing: State of Play
Affiliations
- PMID: 31569789
- PMCID: PMC6806174
- DOI: 10.3390/s19194203
Item in Clipboard
Review
Industrial Applications of Terahertz Sensing: State of Play
Sensors (Basel).
.
Abstract
This paper is a survey of existing and upcoming industrial applications of terahertz technologies, comprising sections on polymers, paint and coatings, pharmaceuticals, electronics, petrochemicals, gas sensing, and paper and wood industries. Finally, an estimate of the market size and growth rates is given, as obtained from a comparison of market reports.
Keywords: electronic circuits; gas sensing; industrial applications; paint coatings; paper and wood; petrochemicals; pharmaceuticals; polymers; terahertz.
Conflict of interest statement
The authors declare no conflict of interest.
Figures
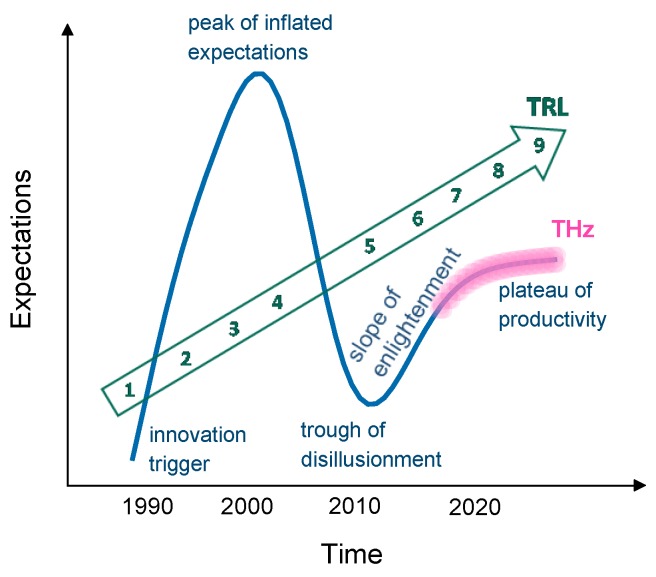
The Gartner Hype Cycle, TRL evolution, and the current envisaged position of THz technologies.
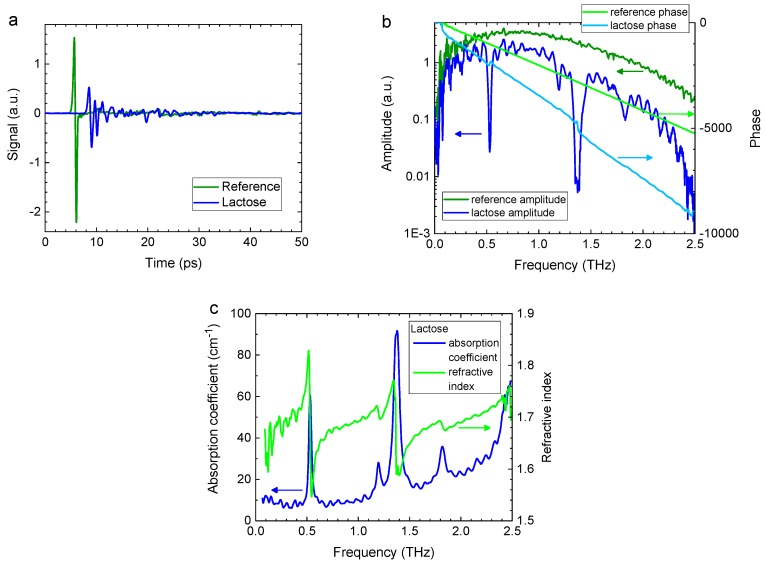
(a) Time-domain traces of a reference measurement and a lactose sample. (b) Spectral data (Fourier transform) of traces in (a). (c) Derived absorption coefficient and refractive index of lactose. Courtesy of M. Naftaly, NPL, UK.
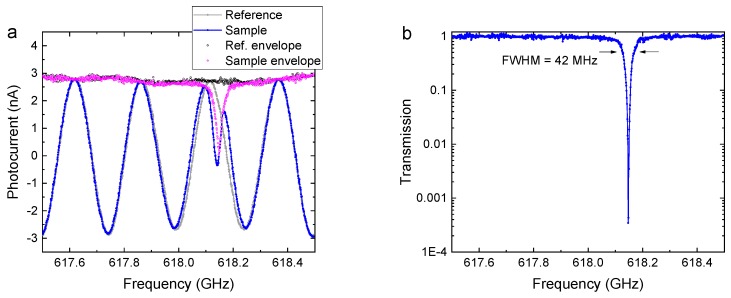
(a) Frequency-domain signals of a reference (grey) and sample (red) scans. The coherent detection scheme gives rise to phase “fringes”, which appear as an oscillating pattern when the THz frequency is varied. A Hilbert transform yields the envelope spectra of reference (black) and sample (pink). (b) The sample transmission spectrum (the square of the ratio of the sample and reference envelope data) reveals the whispering-gallery-mode resonance with an FWHM linewidth of 42 MHz. Courtesy of Dominik Vogt, University of Auckland, New Zealand.
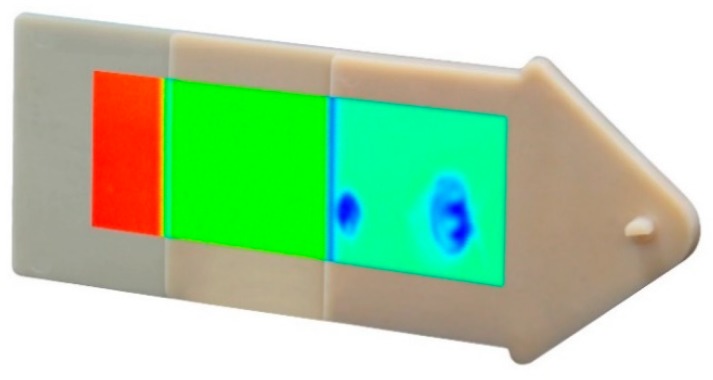
Plastic step wedge made of polyamide. Air pockets are made visible using THz TDS. Adapted from [15], courtesy of TOPTICA Photonics AG.
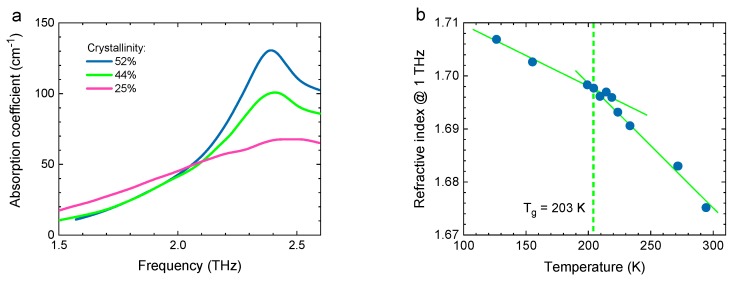
(a) Absorption spectrum of three samples of polybuthylene terephathalate (PBT) with different degrees of crystallinity. (b) Temperature-dependent refractive index of polyoxymethyllene (POM). The glass transition temperature can be determined from the intersection of the two linear slopes. Figures adapted from [35], courtesy of S. Wietzke, Continental AG.
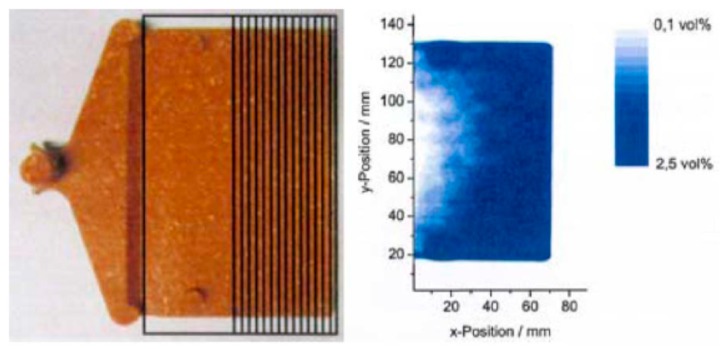
Photograph (left) and THz transmission image (right) of a wood/plastic composite material after immersion in water. From [35], courtesy of S. Wietzke, Continental AG.
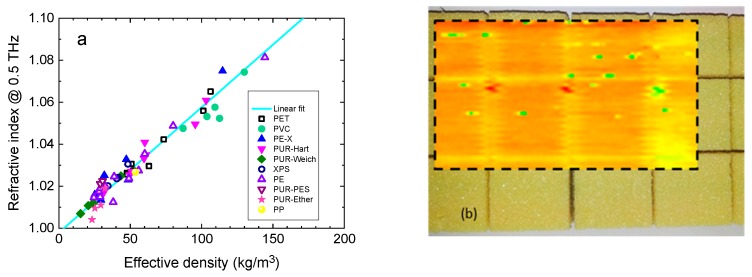
(a) Relation between refractive index and effective density for various polymer foams. Adapted from [52], courtesy of M. Mayr, Sűddeutsches Kunststoffzentrum. (b) Photograph and THz transmission image (100 mm × 60 mm) of a 20 mm-thick piece polyvinyl chloride foam, as used in rotor blades. Courtesy of TOPTICA Photonics AG.
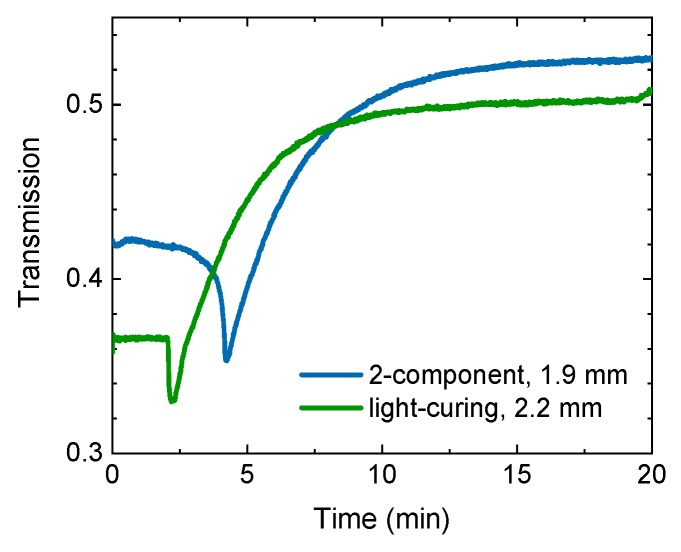
THz transmission through a 2-component and a light-curing adhesive during the curing process. Courtesy of TOPTICA Photonics AG.
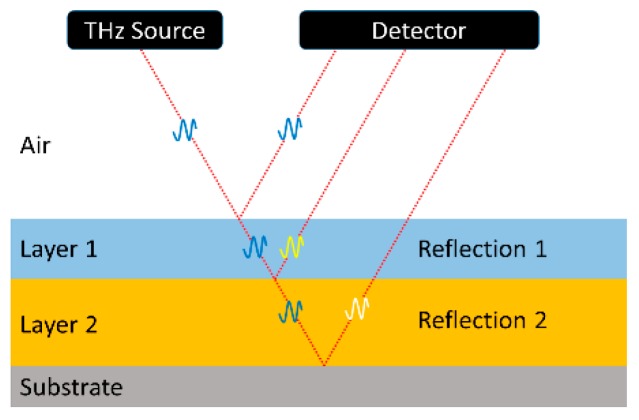
Schematic drawing of a substrate with two coating layers and the reflected THz beam path.
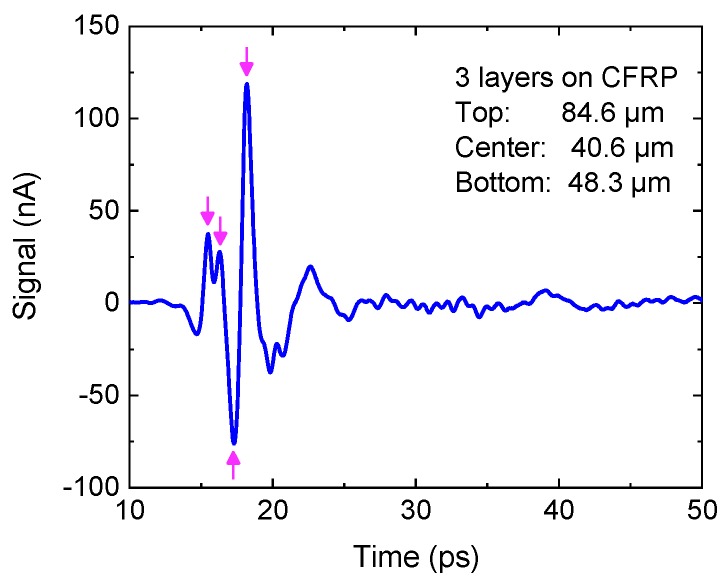
A THz pulse trace reflected from a three-layer coating on a carbon-fiber-reinforced plastic substrate. The echoes from the four interfaces are marked with arrows. Thicknesses of the individual layers are indicated. Courtesy of TOPTICA Photonics AG.
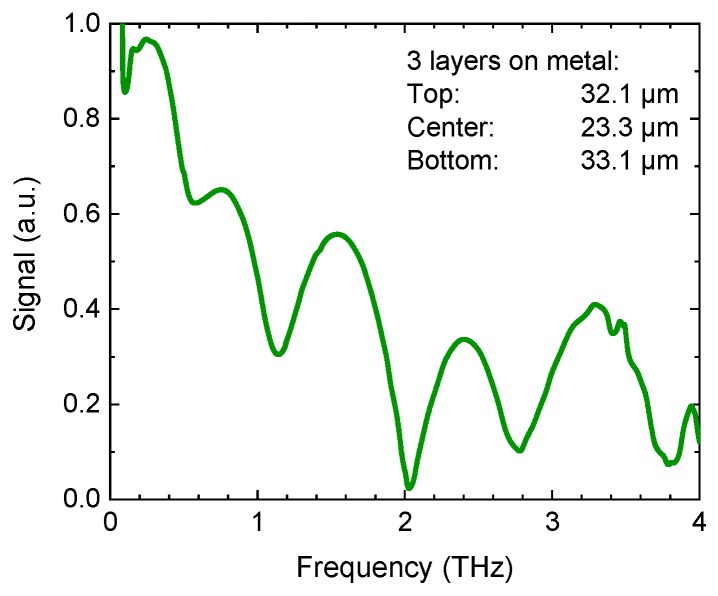
The frequency-domain representation of a THz pulse reflected from a three-layer coating on metal. Thicknesses of the individual layers are indicated. The layers give rise to interference signatures in the transfer function. Courtesy of Helmut Fischer GmbH.
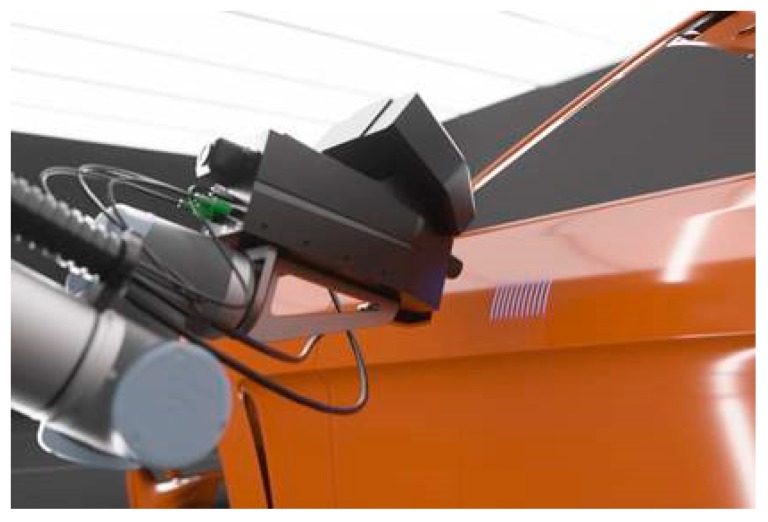
Implementation of a THz TDS in an industrial setting. Courtesy of Helmut Fischer GmbH.
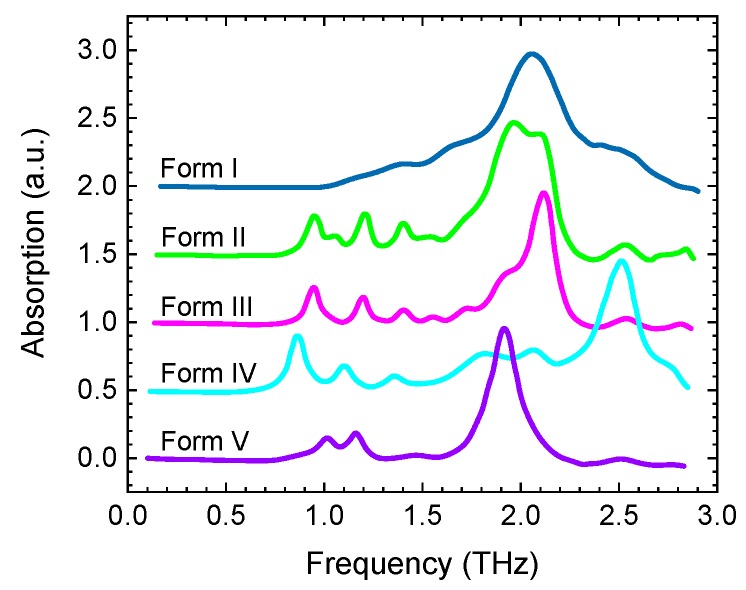
Terahertz absorption spectra of the five polymorphic forms of sulfathiazole (vertically offset and normalized for clarity). Adapted from [84].
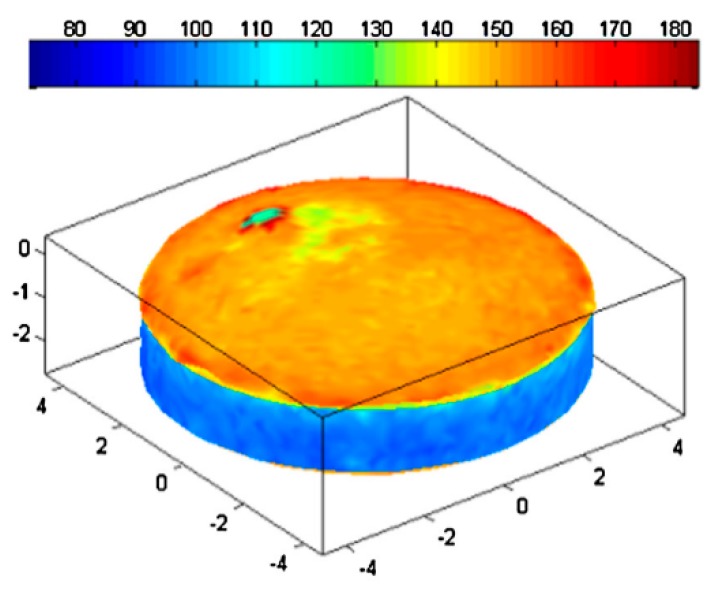
3D images of coating thickness of a biconvex tablet. The colour scale is in μm, the X-Y-Z scale is in mm. Reprinted with permission from [92] © Elsevier.
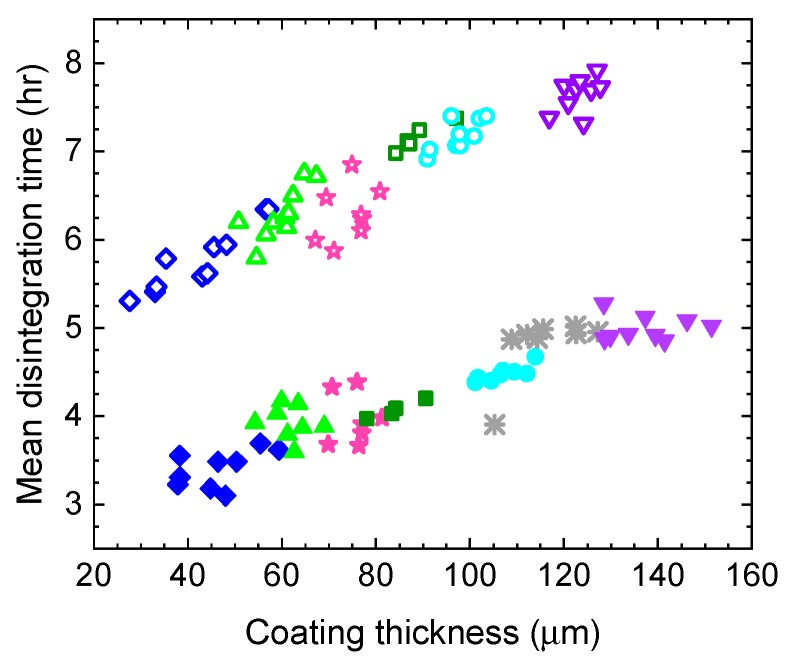
Relationship between tablet coating thickness and their MDT (mean dissolution time) for tablets produced by two manufacturing processes: lab-scale (using laboratory equipment, solid symbols) and pilot-scale (using industrial equipment; hollow symbols). Adapted from [94].
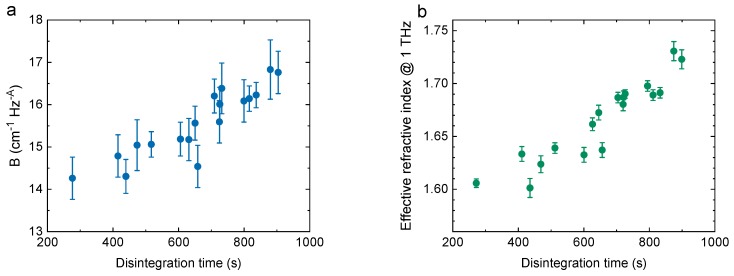
(a) Relationship between the loss parameter B and tablet disintegration time. The frequency-dependent scattering loss is described by αeff = B f A (where A ≈ 3.3), therefore the loss parameter B reflects the strength of transmission loss. (b) Relationship between effective refractive index and disintegration time. Adapted from [101].
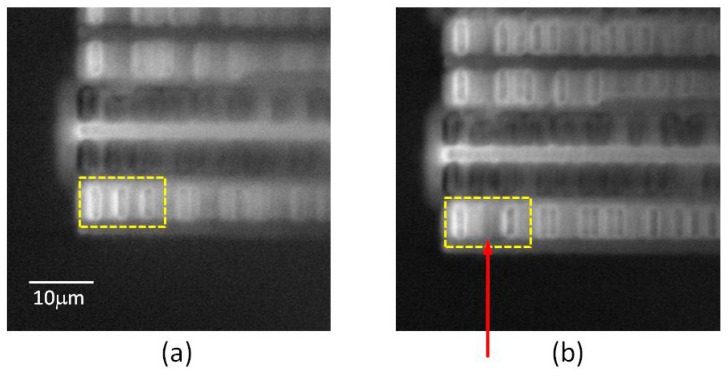
LTEM images of a functioning circuit (a) and a defective one (b). The arrow shows the location of the broken contact. Brighter areas indicate stronger THz emission. Reprinted with permission from [112] © The Optical Society.
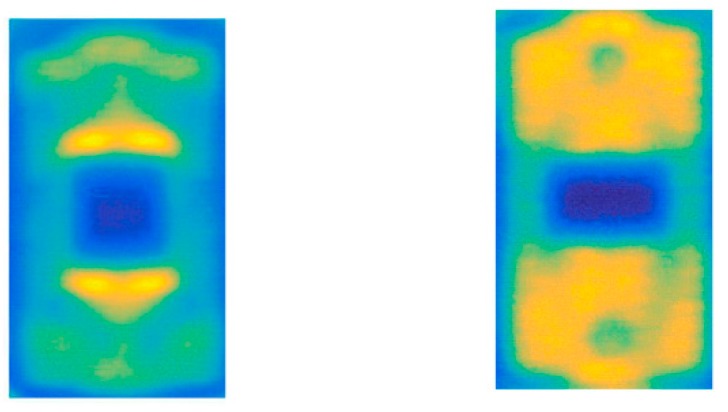
Transmission images of an authentic (right) Intel chip and a counterfeit one (left). Reprinted with permission from [118] © Elsevier.
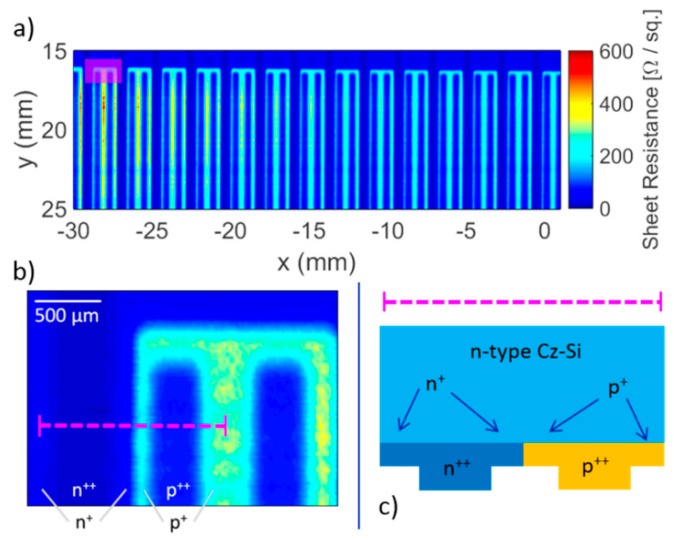
(a) A high-resolution sheet resistance map of a solar cell obtained with tip-based THz near-field microscopy. (b) Expanded view of a single finger. (c) Doping along the line marked in (b). Figure courtesy of Protemics GmbH.
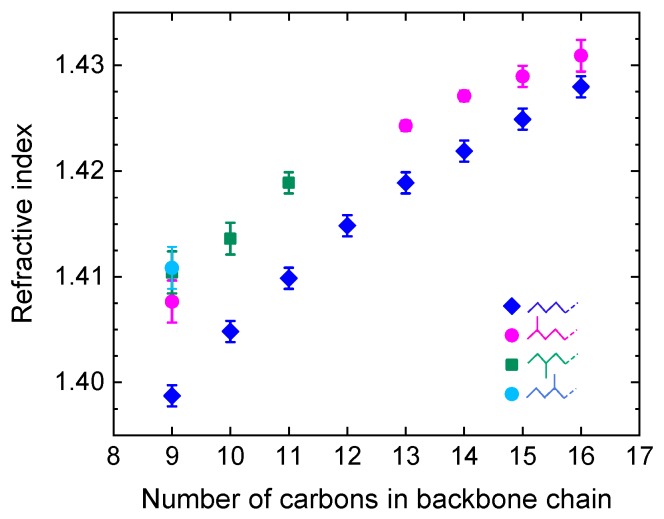
Refractive index at 1 THz (at 20 °C) of alkane compounds with different numbers of carbon atoms in their backbone chain, for both linear and branched compounds, showing the dependence on the carbon number and branching. Adapted from [136].
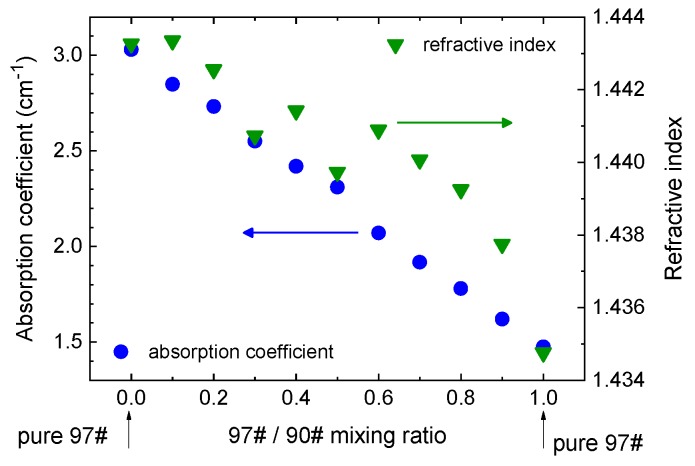
Refractive indices (green symbols, right axis) and absorption coefficients (blue symbols, left axis) at 1 THz of gasoline mixtures of 90# and 97# octane. Adapted from [151].
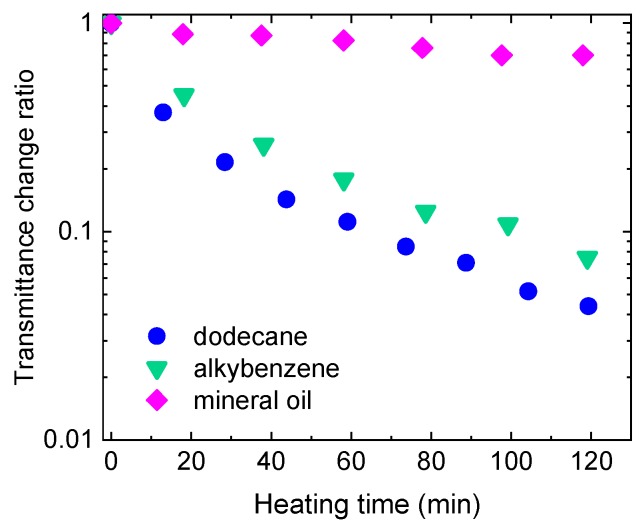
Reduction in THz transmission due to oxidation in three insulating oils. Adapted from [162].
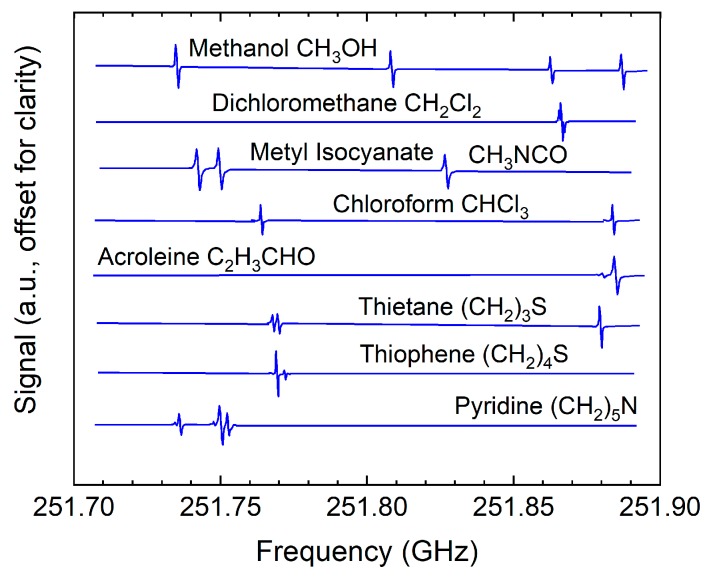
Expanded section of the detected spectrum showing spectral signatures of eight gases. Adapted from [172].
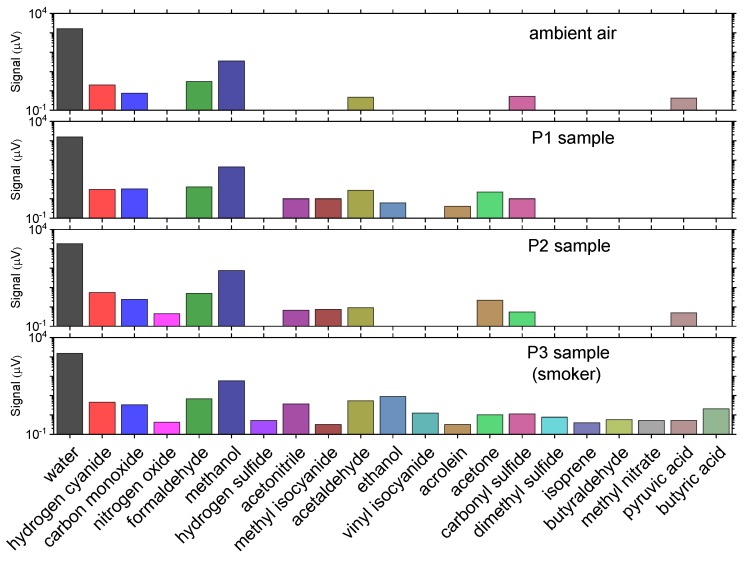
Gases detected in exhaled human breath. Adapted from [183].
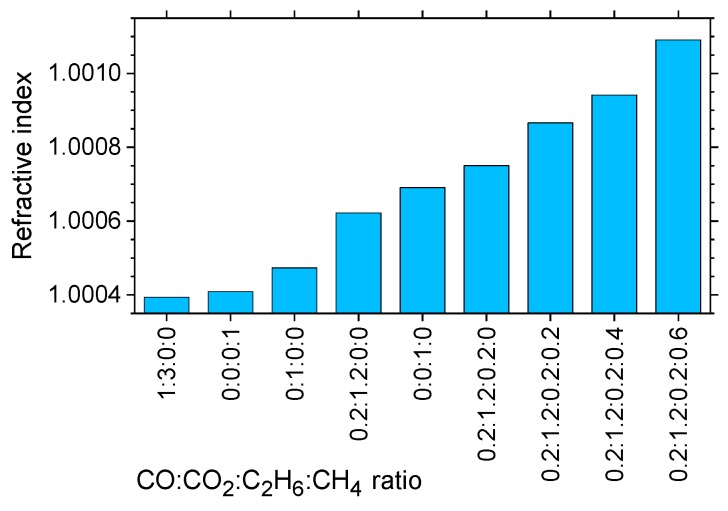
Refractive indices (mean over 0.3–1.3 THz) of natural gas constituents and their different mixes. Adapted from [184].
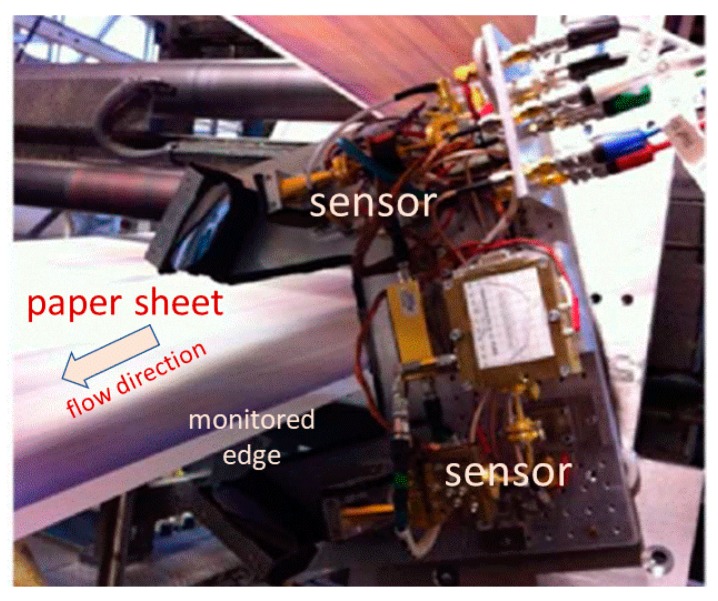
An industrial prototype of an electronic sensor at 200 GHz monitoring paper moisture during offset printing. Adapted from [197].
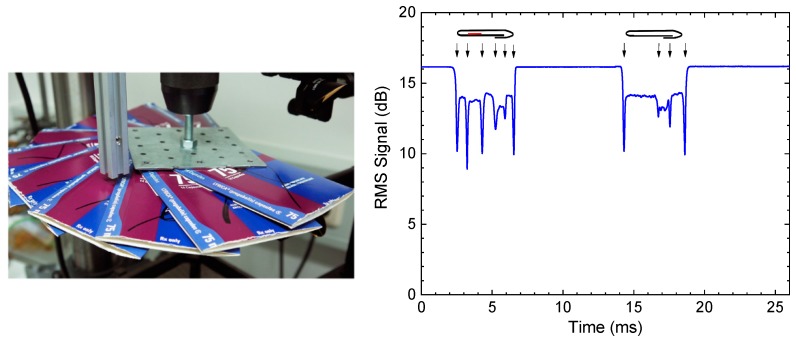
(a) Boxes arranged on a fast turntable. (b) 1D-scan of folded cardboard boxes with and without a package slip (shown in red). The graph depicts the transmitted THz intensity with the boxes moving at 21 m/s. Adapted from [198].
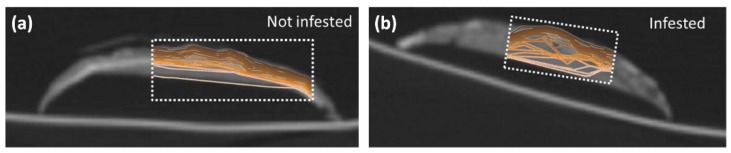
THz scans overlaid on CT images, revealing beetle damage. a) Healthy wood; b) infested wood. Reprinted with permission from [205] © The Optical Society.
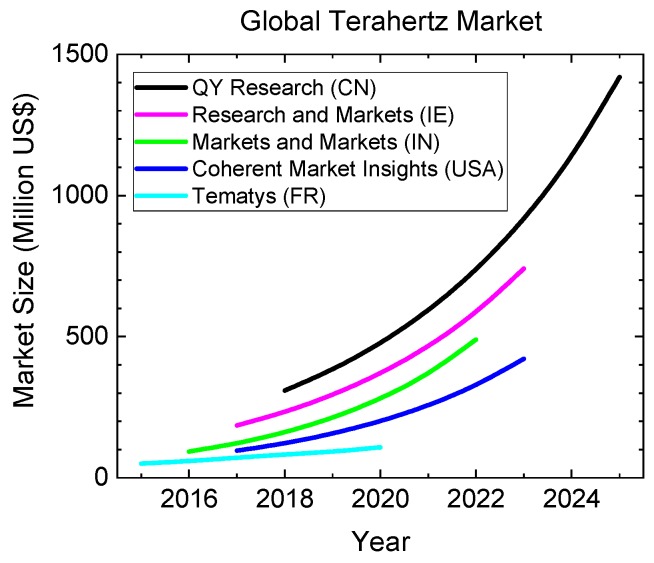
Global terahertz market in Million USD, according to five different analyst firms [206,207,208,209,210].
References
-
- Gartner Hype Cycle. [(accessed on 27 September 2019)]; Available online: https://www.gartner.com/en/research/methodologies/gartner-hype-cycle.
-
- Siegel P.H. Terahertz Sensing Technology: Volume 1: Electronic Devices and Advanced Systems Technology. World Scientific Publishing Co Pte Ltd; Singapore: 2003. THz technology: An overview; pp. 1–44.
-
- Stöhr A. Pushing the boundaries. IEEE Microw. Mag. 2009;10:106–115. doi: 10.1109/MMM.2009.932285. - DOI
-
- Armstrong C.M. The truth about terahertz. IEEE Spectr. 2012;49:36–41. doi: 10.1109/MSPEC.2012.6281131. - DOI
Publication types
LinkOut - more resources
Full Text Sources
Other Literature Sources
