. 2019 Dec 6;294(49):18547-18556.
doi: 10.1074/jbc.RA119.009061. Epub 2019 Sep 30.

Mass cytometry-based single-cell analysis of human stem cell reprogramming uncovers differential regulation of specific pluripotency markers

Affiliations

Mass cytometry-based single-cell analysis of human stem cell reprogramming uncovers differential regulation of specific pluripotency markers

Ilkyun Im et al. J Biol Chem. .

Abstract

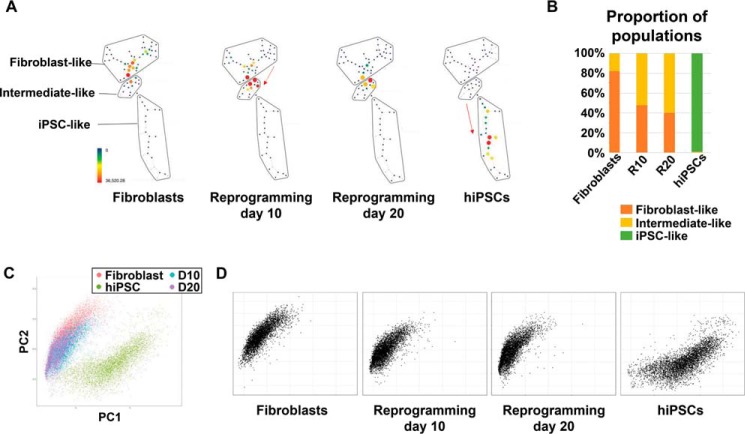
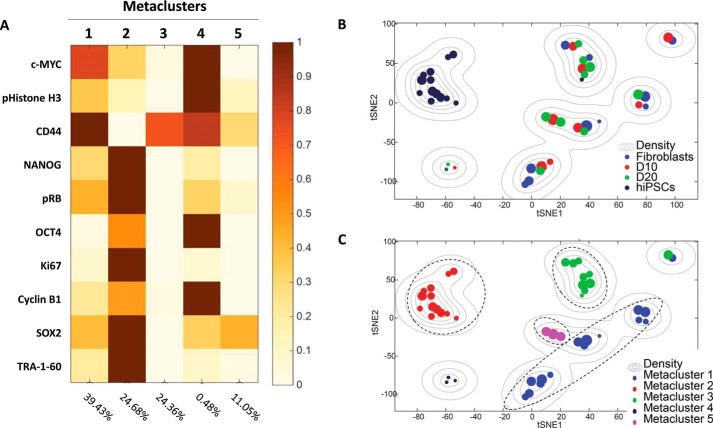
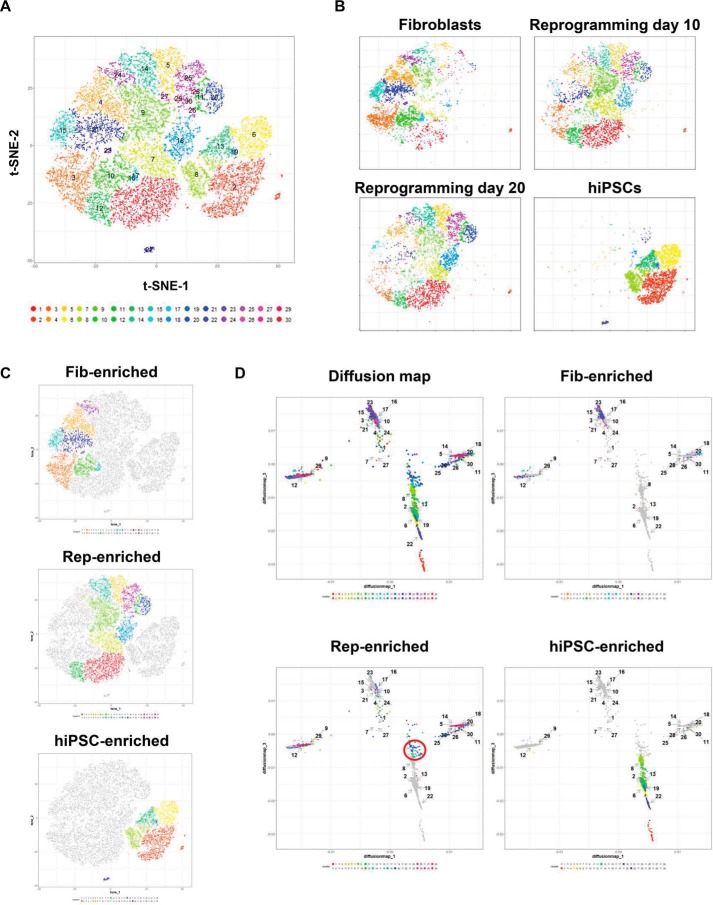
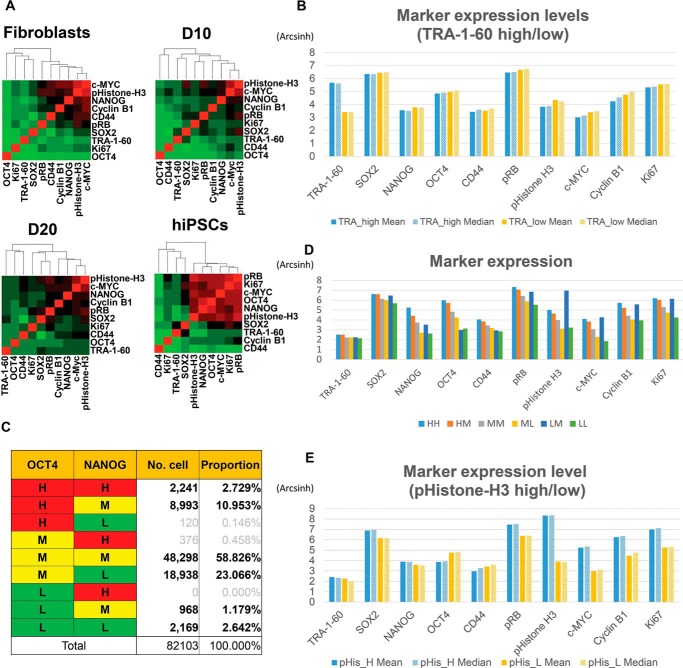
Human induced pluripotent stem cells (hiPSCs) are reprogrammed from somatic cells and are regarded as promising sources for regenerative medicine and disease research. Recently, techniques for analyses of individual cells, such as single-cell RNA-Seq and mass cytometry, have been used to understand the stem cell reprogramming process in the mouse. However, the reprogramming process in hiPSCs remains poorly understood. Here we used mass cytometry to analyze the expression of pluripotency and cell cycle markers in the reprogramming of human stem cells. We confirmed that, during reprogramming, the main cell population was shifted to an intermediate population consisting of neither fibroblasts nor hiPSCs. Detailed population analyses using computational approaches, including dimensional reduction by spanning-tree progression analysis of density-normalized events, PhenoGraph, and diffusion mapping, revealed several distinct cell clusters representing the cells along the reprogramming route. Interestingly, correlation analysis of various markers in hiPSCs revealed that the pluripotency marker TRA-1-60 behaves in a pattern that is different from other pluripotency markers. Furthermore, we found that the expression pattern of another pluripotency marker, octamer-binding protein 4 (OCT4), was distinctive in the pHistone-H3high population (M phase) of the cell cycle. To the best of our knowledge, this is the first mass cytometry-based investigation of human reprogramming and pluripotency. Our analysis elucidates several aspects of hiPSC reprogramming, including several intermediate cell clusters active during the process of reprogramming and distinctive marker expression patterns in hiPSCs.

Keywords: OCT4; TRA-1–60; cell cycle; computational biology; iPS cell; iPSC; induced pluripotent stem cell; mass cytometry; pluripotency; reprogramming; single-cell analysis; spanning-tree progression analysis of density-normalized events (SPADE).


Conflict of interest statement

The authors declare that they have no conflicts of interest with the contents of this article

Figures

Figure 1.
Figure 1.
Appearance of intermediate populations during reprogramming. A, SPADE analysis clustered by pluripotency markers and CD44. Populations enriched in each stage were grouped into three clusters: fibroblast-like, intermediate-like, and iPSC-like. As reprogramming proceeded, the main population was shifted downward in the SPADE tree (red arrows). The color of each circle indicates the number of cells included in each cluster. B, proportion of each population at each stage. Intermediate-like populations accounted for more than 50% of reprogramming day 10 and 20 samples, reflecting the progression of reprogramming. C, PCA plot. Down-sampled cells (5000 per sample) were placed on the principal component (PC) plane. D, PCA plot separated by sample. A population shift during the reprogramming process was observed.
Figure 2.
Figure 2.
Phenotypic clustering of cells during reprogramming by PhenoGraph and metaclustering. A, metaclusters based on the PhenoGraph algorithm. All clusters were classified into five metaclusters depending on their marker expression patterns. Each metacluster showed various phenotypes, including fibroblast-like, iPSC-like, and reprogramming-like phenotypes. B and C, t-SNE map of the clusters labeled by sample (B) and metacluster (C). Metaclusters showed the heterogeneity of each population except hiPSCs, which were mostly found in metacluster 2. Metacluster 5 consisted of only cells from reprogramming days 10 and 20.
Figure 3.
Figure 3.
Diffusion map analysis of reprogramming. A, clustering of all samples by PhenoGraph algorithm on Cytofkit, with 30 clusters generated. B, distribution of cells in each sample. A population shift was observed during reprogramming. C, clusters were classified into stage-enriched clusters: fibroblast-enriched (Fib), reprogramming-enriched (Rep), and hiPSC-enriched clusters mainly include fibroblasts, cells during reprogramming, and hiPSCs, respectively. D, diffusion map analysis of reprogramming. The position of each cluster is shown, and fibroblast-, reprogramming-, and hiPSC-enriched clusters are indicated.
Figure 4.
Figure 4.
Relationships among pluripotency and cell cycle markers in hiPSCs. A, hierarchical clustering based on Spearman's correlation coefficients between each pair of markers in individual samples. B, marker expression patterns in TRA-1–60high and TRA-1–60low populations, showing no significant difference between the two populations. C, classification of cells according to OCT4 and NANOG expression levels. The number and proportion of cells in each group are shown. D, marker expression levels of each group. Cell cycle marker expression is shown in proportion to OCT4 and NANOG expression. The LM population exhibited exceptionally high cell cycle marker levels. E, marker expression levels in pHistone-H3high and pHistone-H3low populations. Most markers showed higher expression in pHistone-H3high, except OCT4.

Comment in

  • Specificity of anti-MYC antibodies.
    Cattoretti G. Cattoretti G. J Biol Chem. 2020 Jan 10;295(2):298. doi: 10.1074/jbc.L119.011910. J Biol Chem. 2020. PMID: 31924671 Free PMC article. No abstract available.
  • Reply to Cattoretti: Specificity of anti-MYC antibodies.
    Im I, Son YS, Jung KB, Kang I, Teh BE, Lee KB, Son MY, Kim J. Im I, et al. J Biol Chem. 2020 Jan 10;295(2):299-300. doi: 10.1074/jbc.RL119.011997. J Biol Chem. 2020. PMID: 31924672 Free PMC article. No abstract available.

References

    1. Takahashi K., and Yamanaka S. (2006) Induction of pluripotent stem cells from mouse embryonic and adult fibroblast cultures by defined factors. Cell 126, 663–676 10.1016/j.cell.2006.07.024 - DOI - PubMed
    1. Takahashi K., Tanabe K., Ohnuki M., Narita M., Ichisaka T., Tomoda K., and Yamanaka S. (2007) Induction of pluripotent stem cells from adult human fibroblasts by defined factors. Cell 131, 861–872 10.1016/j.cell.2007.11.019 - DOI - PubMed
    1. Yu J., Vodyanik M. A., Smuga-Otto K., Antosiewicz-Bourget J., Frane J. L., Tian S., Nie J., Jonsdottir G. A., Ruotti V., Stewart R., Slukvin I. I., and Thomson J. A. (2007) Induced pluripotent stem cell lines derived from human somatic cells. Science 318, 1917–1920 10.1126/science.1151526 - DOI - PubMed
    1. Park I. H., Zhao R., West J. A., Yabuuchi A., Huo H., Ince T. A., Lerou P. H., Lensch M. W., and Daley G. Q. (2008) Reprogramming of human somatic cells to pluripotency with defined factors. Nature 451, 141–146 10.1038/nature06534 - DOI - PubMed
    1. Buganim Y., Faddah D. A., and Jaenisch R. (2013) Mechanisms and models of somatic cell reprogramming. Nat. Rev. Genet. 14, 427–439 10.1038/nrg3473 - DOI - PMC - PubMed

Publication types

MeSH terms