. 2019 Nov 6;39(45):8969-8987.
doi: 10.1523/JNEUROSCI.2575-18.2019. Epub 2019 Sep 30.

An Integrated Neural Decoder of Linguistic and Experiential Meaning

Affiliations

An Integrated Neural Decoder of Linguistic and Experiential Meaning

Andrew James Anderson et al. J Neurosci. .

Abstract

The brain is thought to combine linguistic knowledge of words and nonlinguistic knowledge of their referents to encode sentence meaning. However, functional neuroimaging studies aiming at decoding language meaning from neural activity have mostly relied on distributional models of word semantics, which are based on patterns of word co-occurrence in text corpora. Here, we present initial evidence that modeling nonlinguistic "experiential" knowledge contributes to decoding neural representations of sentence meaning. We model attributes of peoples' sensory, motor, social, emotional, and cognitive experiences with words using behavioral ratings. We demonstrate that fMRI activation elicited in sentence reading is more accurately decoded when this experiential attribute model is integrated with a text-based model than when either model is applied in isolation (participants were 5 males and 9 females). Our decoding approach exploits a representation-similarity-based framework, which benefits from being parameter free, while performing at accuracy levels comparable with those from parameter fitting approaches, such as ridge regression. We find that the text-based model contributes particularly to the decoding of sentences containing linguistically oriented "abstract" words and reveal tentative evidence that the experiential model improves decoding of more concrete sentences. Finally, we introduce a cross-participant decoding method to estimate an upper bound on model-based decoding accuracy. We demonstrate that a substantial fraction of neural signal remains unexplained, and leverage this gap to pinpoint characteristics of weakly decoded sentences and hence identify model weaknesses to guide future model development.SIGNIFICANCE STATEMENT Language gives humans the unique ability to communicate about historical events, theoretical concepts, and fiction. Although words are learned through language and defined by their relations to other words in dictionaries, our understanding of word meaning presumably draws heavily on our nonlinguistic sensory, motor, interoceptive, and emotional experiences with words and their referents. Behavioral experiments lend support to the intuition that word meaning integrates aspects of linguistic and nonlinguistic "experiential" knowledge. However, behavioral measures do not provide a window on how meaning is represented in the brain and tend to necessitate artificial experimental paradigms. We present a model-based approach that reveals early evidence that experiential and linguistically acquired knowledge can be detected in brain activity elicited in reading natural sentences.

Keywords: concepts; fMRI; lexical semantics; multivoxel pattern analysis; semantic model; sentence comprehension.


Figures

Figure 1.
Figure 1.
Representational similarity-based decoding algorithm set up to support multiple model-based decoding. Multimodal model combination takes place in Stage 4 by averaging 2 × 2 decoding decision matrices generated by the different models. An alternative approach would have been to pointwise average together the two similarity vectors for the experiential model with those of the text-based model in Stage 3. This was disfavored to avoid having to introduce an extra normalization step to deal with correlation coefficients arising from the different models being on different scales (correlation coefficient magnitudes tend to diminish as the number of features correlated becomes large, and here the experiential and text-based models widely differ in the number of features: 65 and 300, respectively). This problem is naturally dealt with in Stage 4 because the 2 × 2 decision matrices are based on correlations between similarity vectors that are all matched in their dimensions. Each red asterisk corresponds to Pearson's correlation coefficient.
Figure 2.
Figure 2.
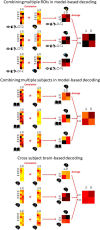
Representational similarity-based algorithm setups for ensemble decoding. Top, Model-based decoding of multiple brain regions in the same participant (see also results in Figs. 4–6, 8, 9, and 11). Middle, Model-based decoding of multiple participants (see also results in Fig. 5). Bottom, Cross-subject decoding (see also results in Fig. 8). Each red asterisk corresponds to Pearson's correlation coefficient.
Figure 3.
Figure 3.
Partitioning the variance in neural similarity structure that is solely accounted for individual models and shared between them.
Figure 4.
Figure 4.
Integrating text-based and experiential models produces stronger decoding. Individual-level accuracies arising from decoding the 22 ROI ensemble (see Fig. 2, top row). The contribution of the text-based model to multimodal decoding was particularly pronounced for sentences containing abstract words (right). Effect sizes (d) were estimated according to Dunlap et al. (1996) as d = t × (2 × (1 − r)/n), where t is the t statistic arising from the corresponding paired t test, r is Pearson correlation, and n is the number of participants (14). ρ corresponds to Spearman's correlation coefficient.
Figure 5.
Figure 5.
Decoding neural data at group level exploits cross-participant regularities. Model-based decoding accuracies at group level (Fig. 2, middle) and for each individual corresponding to all 22 ROIs decoded as an ensemble. Individual participants' decoding accuracies (dark) are plotted beside group-minus-one (light) decoding accuracies derived using all other participants. “Group” is all 14 participants combined.
Figure 6.
Figure 6.
Multimodal model integration improves decoding of superior temporal and inferior frontal regions. Data are mean ± SEM decoding accuracies across 14 participants derived using the text-based and experiential model independently, and then when combined together (i.e., multimodal decoding; see Fig. 1, Stage 4).
Figure 7.
Figure 7.
Partitioning the contribution made by the text-based and experiential models to explaining neural similarity structure across the entire set of 240 sentences. Left, Venn diagrams represent the mean (across participants) fraction of variance that is solely accounted for by the individual models and shared between them in the RSA analyses (see Fig. 3). Left, Bar plots represent the associated mean ± SEM positive correlations (square root of R2). Deserving of additional explanation, in LIFGtr, the mean experiential coefficient is marginally greater than the shared coefficient, whereas the mean fraction of variance explained by the experiential model is less than the shared component. This occurred because the experiential model tended to uniquely explain more variance in participants with large Union R2 values (relative to shared variance) and vice versa. The averages of raw coefficients (in the bar plots) reflect this trend, but the Venn diagrams do not because the trend was removed by computing fractions within each participant, before averaging across participants. Mean ± SEM partial correlation coefficients for the two models in the same RSA analyses are displayed in the four bar plots to the right (and tested against zero).
Figure 8.
Figure 8.
Estimating the room for improvement: how cross-participant decoding improves on the multimodal model-based approach. Data are mean ± SEM cross-participant (brain-based) decoding accuracies (see Fig. 2, bottom) across all 14 participants beside comparative results for the multimodal model (also shown in Fig. 4). Right, Detailed results arising from decoding using the combination of all 22 ROIs (see Fig. 2, top). Scatter plots represent characteristics of sentences for which cross-participant (brain-based) decoding was advantaged over the multimodal model-based approach. The effect size (d) was estimated as described in Figure 4. ρ corresponds to Spearman's correlation coefficient.
Figure 9.
Figure 9.
Decoding accuracies arising from decoding different networks of ROIs using different model combinations. This figure is a companion to Figure 4, which describes how effect sizes (d) were estimated. ρ corresponds to Spearman's correlation coefficient.
Figure 10.
Figure 10.
Comparative text-based, experiential, and multimodal decoding accuracies acquired using ridge regression. Top, Left, Multimodal advantages for a particular selection of λ values. Top, Right, Multimodal decoding accuracies for all λ configurations. Results of paired t tests comparing multimodal decoding accuracies with text-based decoding accuracies (bottom, left) and experiential decoding accuracies (bottom, right) for each λ configuration. All tests were one-tailed, in anticipation of the multimodal advantage observed in our initial analyses. The illustrated effect size (d) provides a conservative estimate of the benefit of integrating experiential features into a conventional text-based ridge regression approach. d was computed as described in Figure 4 (legend). Differences between ridge regression and similarity-based decoding: Top, Left, Both similarity-based (dashed lines) and regression-based (solid lines) results. Decoding accuracies using ridge regression with the text model and the top performing λ (always λ = 104) were unanimously significantly lower than for the similarity-based approach (LSTS: t = 5.8, p = 6 × 10⁻⁵, df = 13; LSTG: t = 5.3, p = 1.4 × 10⁻⁴, df = 13; LIFGtr: t = 5.2, p = 1.8 × 10⁻⁴, df = 13; 22 ROI: t = 8, p = 2 × 10⁻⁶, df = 13; all two-tailed paired t tests, df = 13). Conversely, in 75% of tests using the experiential model with the top scoring λ (always λ = 103), ridge regression yielded significantly stronger decoding accuracies than the similarity-based analysis (LSTS: t = 5.6, p = 8.5 × 10⁻⁵; LSTG: t = 4, p = 0.001; LIFGtr: t = 0.1, p = 0.9; 22 ROI: t = 7, p = 9.8 × 10⁻⁶; all two-tailed paired t tests, df = 13). For multimodal decoding, ridge regression yielded stronger decoding in LSTS with the top scoring λ = 103 (t = 3.3, p = 0.006) but not other λ values; otherwise, there were no significant differences for the other ROIs (LSTG: t = 1.9, p = 0.07; LIFGtr: t = −0.88, p = 0.4; 22 ROI: t = 1.4, p = 0.2; all two-tailed paired t tests, df = 13). All p values are not corrected for multiple comparisons.
Figure 11.
Figure 11.
Multimodal decoder integrating the best text-based decoder (similarity) with the best experiential decoder (ridge regression, λ = 103). Effect sizes (d) are displayed in cases of statistically significant differences (paired t test, all p ≤ 0.01, FDR-corrected). d was computed as described in Figure 4. Paired t test results were as follows: for contrasts between multimodal decoding and experiential regression-based decoding: LSTS: t = 4.8, p = 0.002; LSTG: t = 3.6, p = 0.01; LIFGtr: t = 4.5, p = 0.003; 22 ROI: t = 5, p = 0.002; for contrasts between multimodal decoding and text similarity-based decoding: LSTS: t = 8.3, p < 10−4; LSTG: t = 8.0, p < 10−4; LIFGtr: t = 4.0, p = 0.006; 22 ROI: t = 5, p < 10−4; for contrasts between experiential regression-based decoding and text similarity-based decoding: LSTS: t = 4.2, p < 0.005; LSTG: t = 3.8, p < 0.009; LIFGtr: t = 1.39, p = 0.58; 22 ROI: t = 4.8, p = 0.002. All p values FDR-corrected.

References

    1. Abnar S, Ahmed R, Mijnheer M, Zuidema W (2018) Experiential, distributional and dependency-based word embeddings have complementary roles in decoding brain activity. Proceedings of the 8th Workshop on Cognitive Modeling and Computational Linguistics (CMCL 2018), pp 57–66. Salt Lake City: Association for Computational Linguistics.
    1. Anderson AJ, Lin F (2019) How pattern information analyses of semantic brain activity elicited in language comprehension could contribute to the early identification of Alzheimer's disease. Neuroimage Clin 22:101788. 10.1016/j.nicl.2019.101788 - DOI - PMC - PubMed
    1. Anderson AJ, Bruni E, Bordignon U, Poesio M, Baroni M (2013) Of words, eyes and brains: correlating image-based distributional semantic models with neural representations of concepts. Proceedings of the Conference on Empirical Methods in Natural Language Processing (EMNLP 2013), pp 1960–1970. Seattle: Association for Computational Linguistics.
    1. Anderson AJ, Bruni E, Lopopolo A, Poesio M, Baroni M (2015) Reading visually embodied meaning from the brain: visually grounded computational models decode visual-object mental imagery induced by written text. Neuroimage 120:309–322. 10.1016/j.neuroimage.2015.06.093 - DOI - PubMed
    1. Anderson AJ, Zinszer BD, Raizada RD (2016) Representational similarity encoding for fMRI: pattern-based synthesis to predict brain activity using stimulus-model-similarities. Neuroimage 128:44–53. 10.1016/j.neuroimage.2015.12.035 - DOI - PubMed

Publication types

LinkOut - more resources