

Measurements of the self-assembly kinetics of individual viral capsids around their RNA genome
- PMID: 31570619
- PMCID: PMC6842639
- DOI: 10.1073/pnas.1909223116
Measurements of the self-assembly kinetics of individual viral capsids around their RNA genome
Abstract
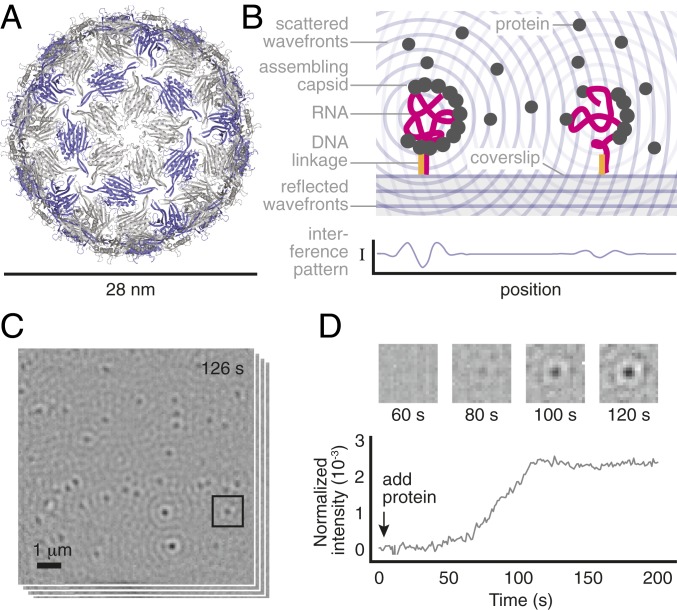
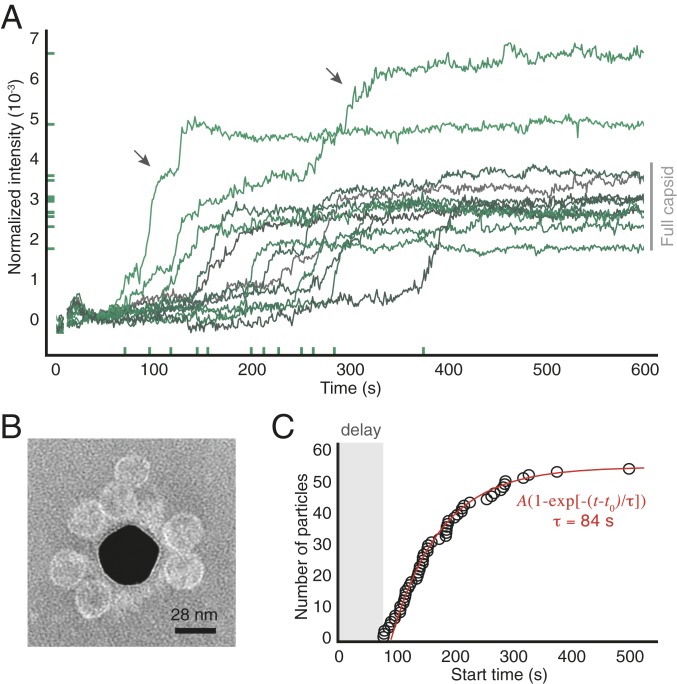
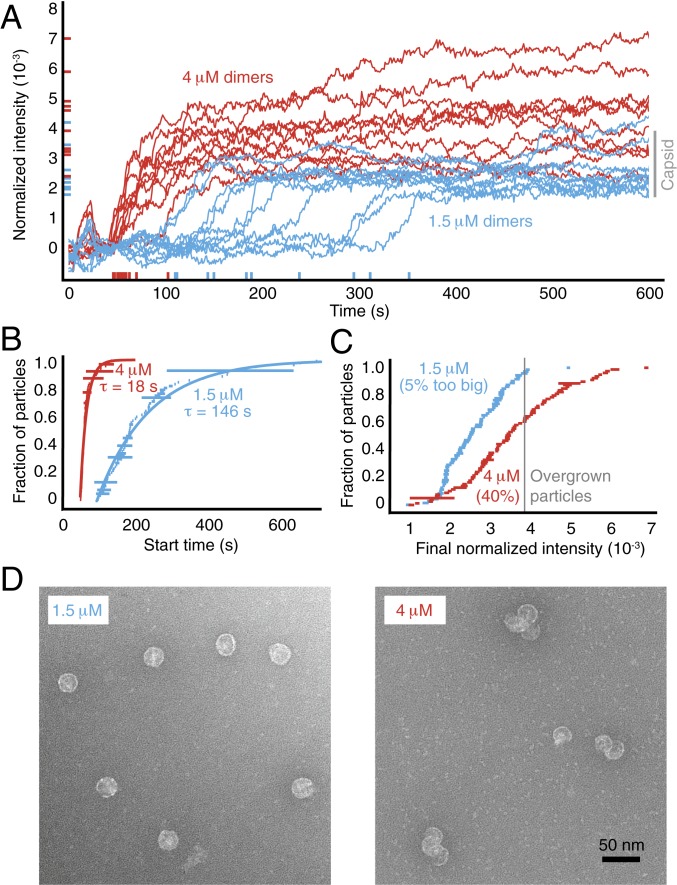
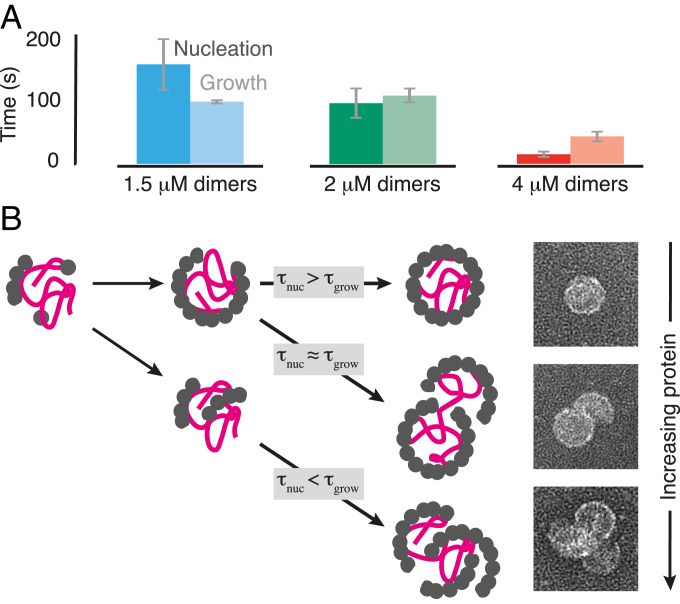
Self-assembly is widely used by biological systems to build functional nanostructures, such as the protein capsids of RNA viruses. But because assembly is a collective phenomenon involving many weakly interacting subunits and a broad range of timescales, measurements of the assembly pathways have been elusive. We use interferometric scattering microscopy to measure the assembly kinetics of individual MS2 bacteriophage capsids around MS2 RNA. By recording how many coat proteins bind to each of many individual RNA strands, we find that assembly proceeds by nucleation followed by monotonic growth. Our measurements reveal the assembly pathways in quantitative detail and also show their failure modes. We use these results to critically examine models of the assembly process.
Keywords: RNA virus; kinetics; nucleation and growth; self-assembly; single particle.
Copyright © 2019 the Author(s). Published by PNAS.
Conflict of interest statement
The authors declare no competing interest.
Figures
Comment in
-
Watching a virus grow.Proc Natl Acad Sci U S A. 2019 Nov 5;116(45):22420-22422. doi: 10.1073/pnas.1915986116. Epub 2019 Oct 17. Proc Natl Acad Sci U S A. 2019. PMID: 31624128 Free PMC article. No abstract available.
Similar articles
-
The structure of bacteriophage phiCb5 reveals a role of the RNA genome and metal ions in particle stability and assembly.J Mol Biol. 2009 Aug 21;391(3):635-47. doi: 10.1016/j.jmb.2009.06.047. Epub 2009 Jun 23. J Mol Biol. 2009. PMID: 19559027
-
The three-dimensional structure of genomic RNA in bacteriophage MS2: implications for assembly.J Mol Biol. 2008 Jan 18;375(3):824-36. doi: 10.1016/j.jmb.2007.08.067. Epub 2007 Sep 7. J Mol Biol. 2008. PMID: 18048058
-
Simple rules for efficient assembly predict the layout of a packaged viral RNA.J Mol Biol. 2011 May 6;408(3):399-407. doi: 10.1016/j.jmb.2011.02.039. Epub 2011 Feb 25. J Mol Biol. 2011. PMID: 21354423 Review.
-
Mutually-induced conformational switching of RNA and coat protein underpins efficient assembly of a viral capsid.J Mol Biol. 2010 Aug 13;401(2):309-322. doi: 10.1016/j.jmb.2010.05.058. J Mol Biol. 2010. PMID: 20684044 Free PMC article.
-
3D Puzzle at the Nanoscale-How do RNA Viruses Self-Assemble their Capsids into Perfectly Ordered Structures.Macromol Biosci. 2024 Sep;24(9):e2400088. doi: 10.1002/mabi.202400088. Epub 2024 Jun 24. Macromol Biosci. 2024. PMID: 38864315 Review.
Cited by
-
Viruses in astrobiology.Front Microbiol. 2022 Oct 26;13:1032918. doi: 10.3389/fmicb.2022.1032918. eCollection 2022. Front Microbiol. 2022. PMID: 36386652 Free PMC article. Review.
-
Rapidly Forming Early Intermediate Structures Dictate the Pathway of Capsid Assembly.J Am Chem Soc. 2020 Apr 29;142(17):7868-7882. doi: 10.1021/jacs.0c01092. Epub 2020 Apr 20. J Am Chem Soc. 2020. PMID: 32233479 Free PMC article.
-
The Emerging Trend of Bio-Engineering Approaches for Microbial Nanomaterial Synthesis and Its Applications.Front Microbiol. 2021 Mar 16;12:638003. doi: 10.3389/fmicb.2021.638003. eCollection 2021. Front Microbiol. 2021. PMID: 33796089 Free PMC article. Review.
-
Adeno-associated virus vector system controlling capsid expression improves viral quantity and quality.iScience. 2023 Mar 23;26(4):106487. doi: 10.1016/j.isci.2023.106487. eCollection 2023 Apr 21. iScience. 2023. PMID: 37096037 Free PMC article.
-
Physics of viral dynamics.Nat Rev Phys. 2021;3(2):76-91. doi: 10.1038/s42254-020-00267-1. Epub 2021 Jan 12. Nat Rev Phys. 2021. PMID: 33728406 Free PMC article. Review.
References
-
- Caspar D. L. D., Klug A., Physical principles in the construction of regular viruses. Cold Spring Harbor Symp. Quant. Biol. 27, 1–24 (1962). - PubMed
-
- Sugiyama T., Hebert R. R., Hartman K. A., Ribonucleoprotein complexes formed between bacteriophage MS2 RNA and MS2 protein in vitro. J. Mol. Biol. 25, 455–463 (1967). - PubMed
-
- Hicks S. D., Henley C. L., Irreversible growth model for virus capsid assembly. Phys. Rev. E 74, 031912 (2006). - PubMed
-
- Fox J. M., et al. , Comparison of the native CCMV virion with in vitro assembled CCMV virions by cryoelectron microscopy and image reconstruction. Virology 244, 212–218 (1998). - PubMed
-
- Sorger P. K., Stockley P. G., Harrison S. C., Structure and assembly of turnip crinkle virus: II. Mechanism of reassembly in vitro. J. Mol. Biol. 191, 639–658 (1986). - PubMed
Publication types
MeSH terms
Substances
Grants and funding
LinkOut - more resources
Full Text Sources
Other Literature Sources
