. 2019 Oct;25(10):1526-1533.
doi: 10.1038/s41591-019-0582-4. Epub 2019 Sep 30.

Whole-genome sequencing of triple-negative breast cancers in a population-based clinical study

Affiliations

Whole-genome sequencing of triple-negative breast cancers in a population-based clinical study

Johan Staaf et al. Nat Med. 2019 Oct.

Abstract

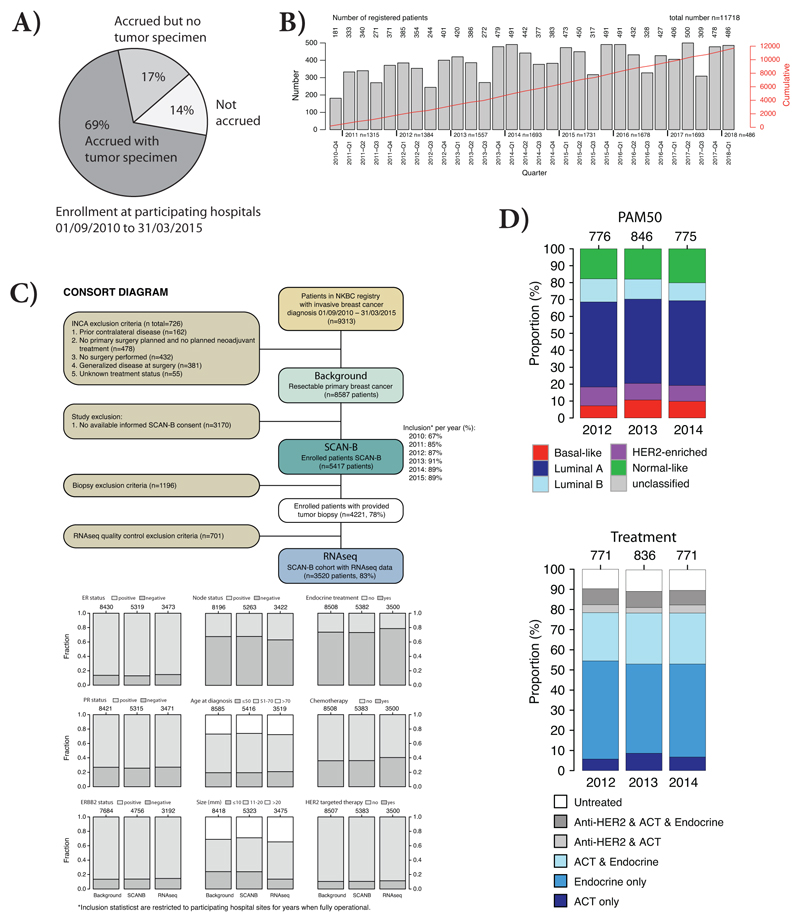
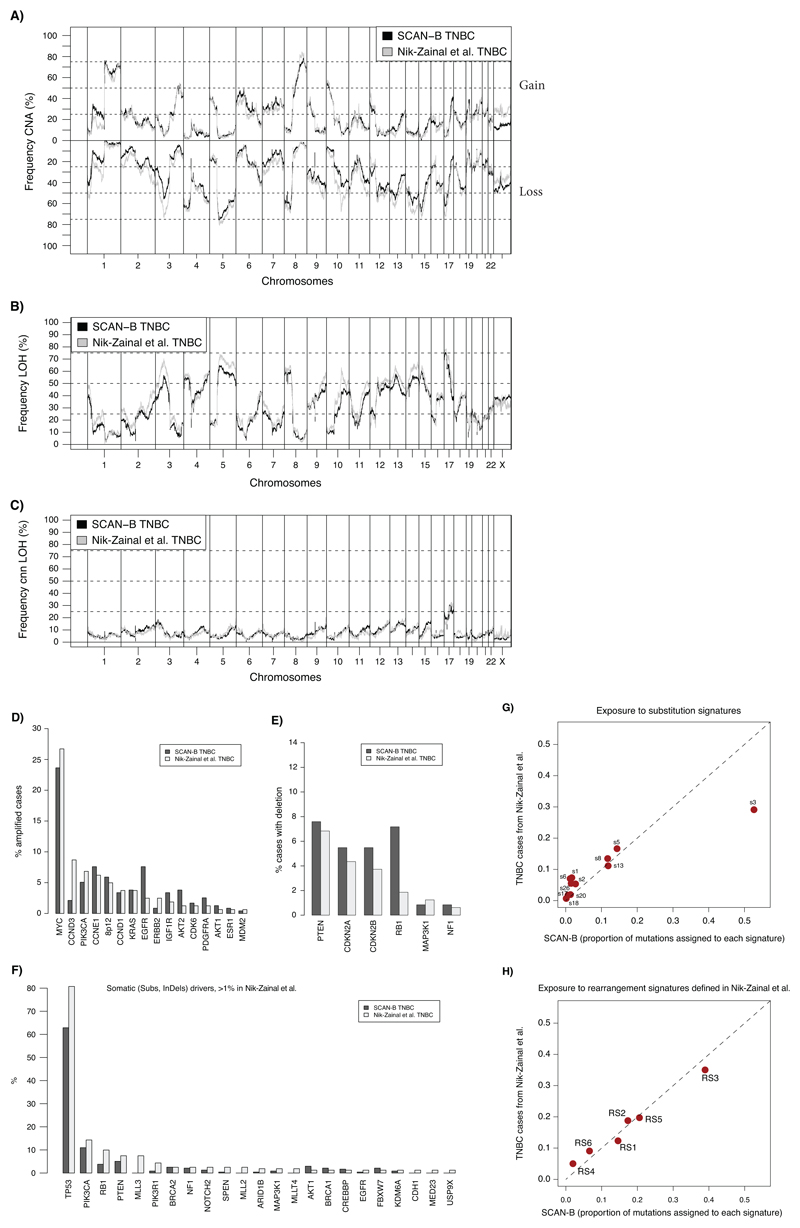
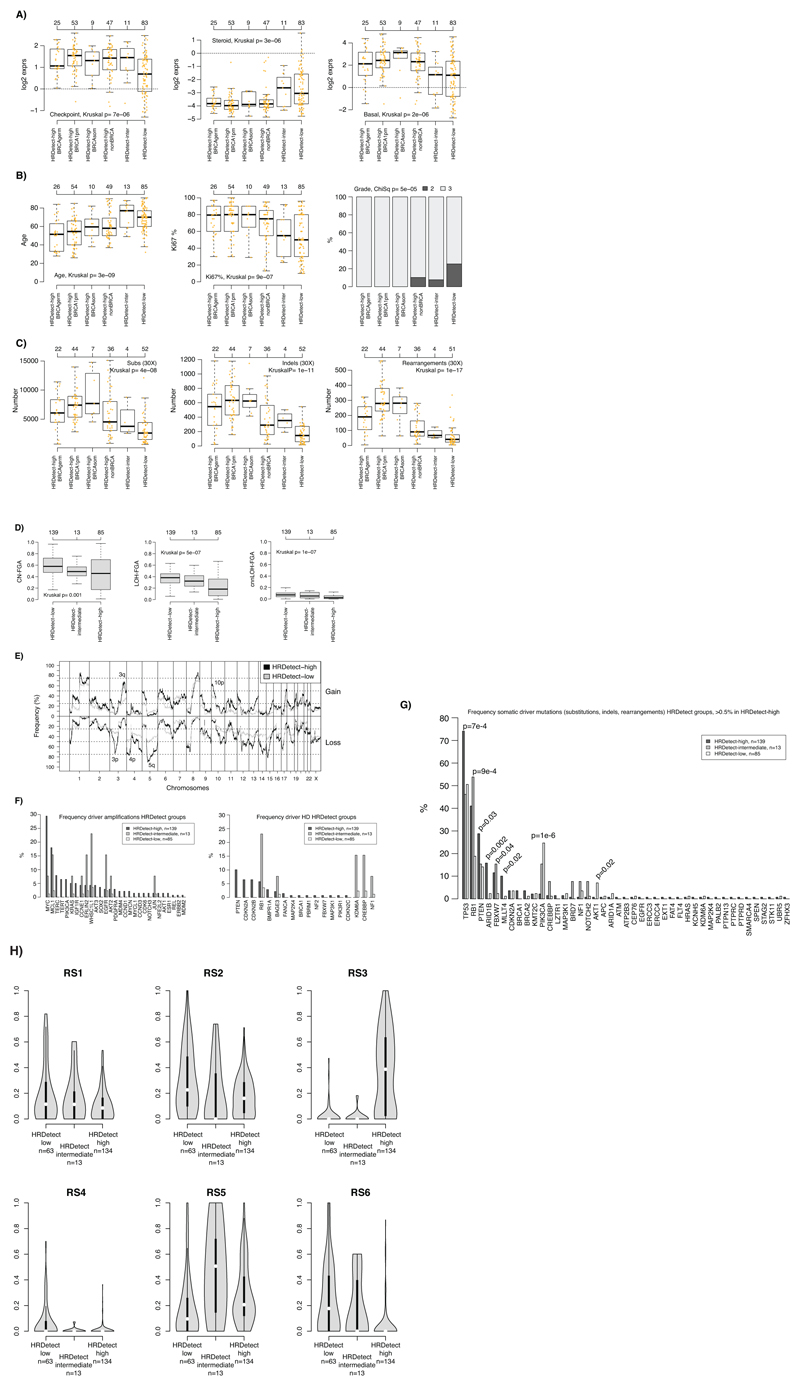
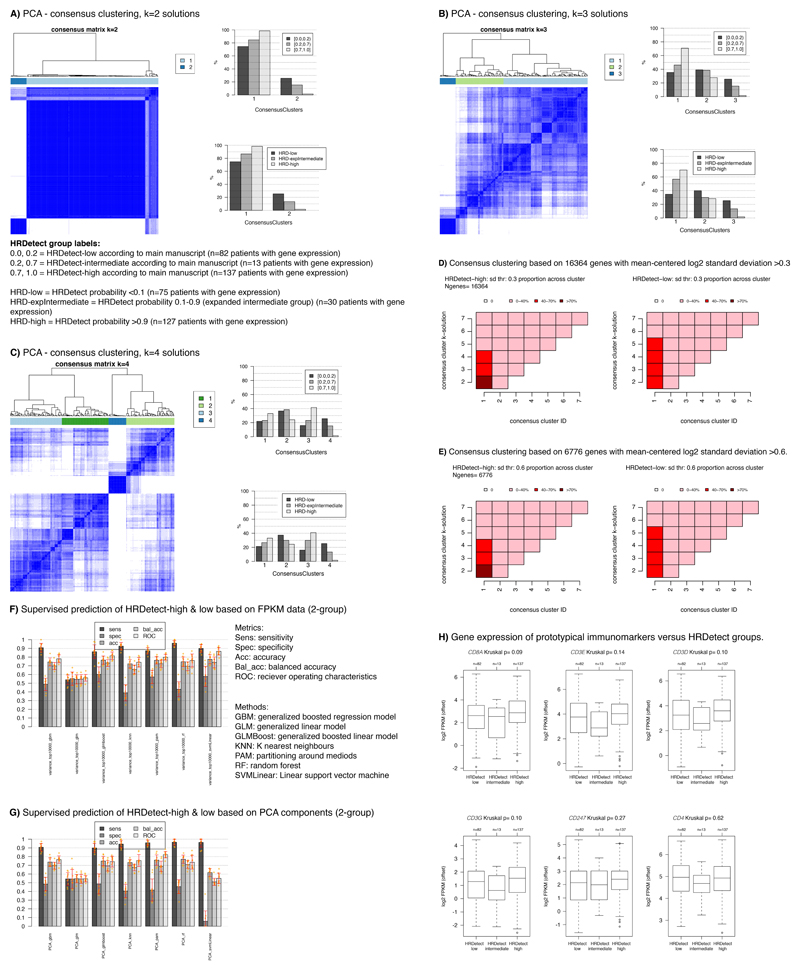
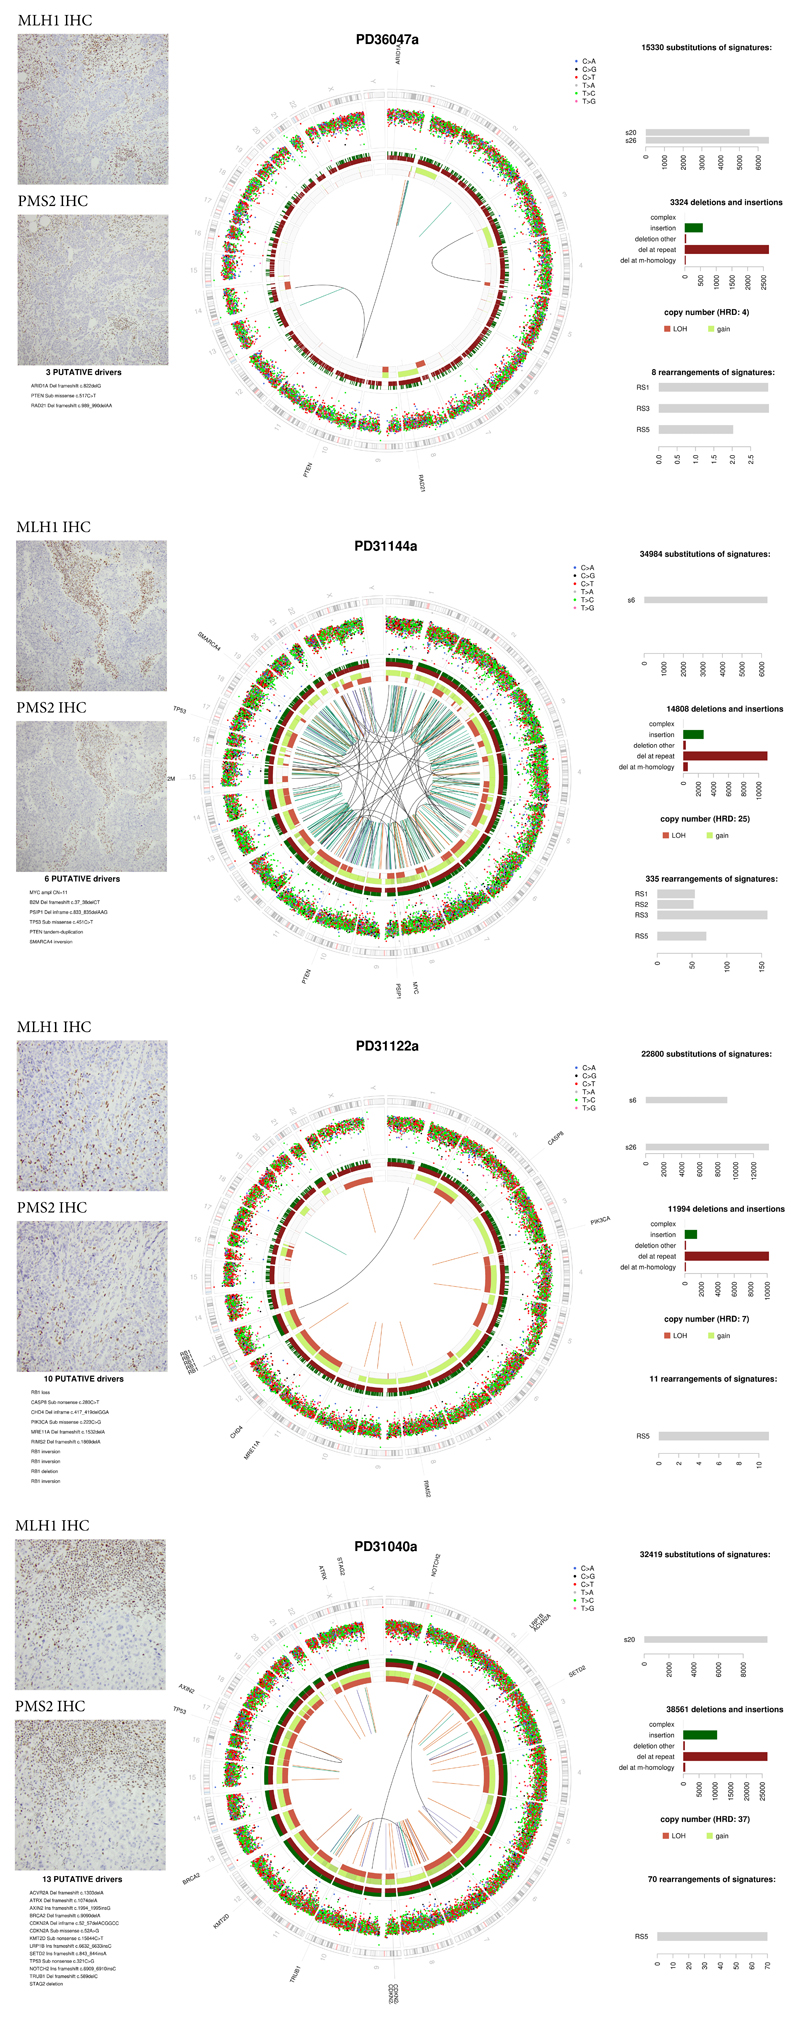
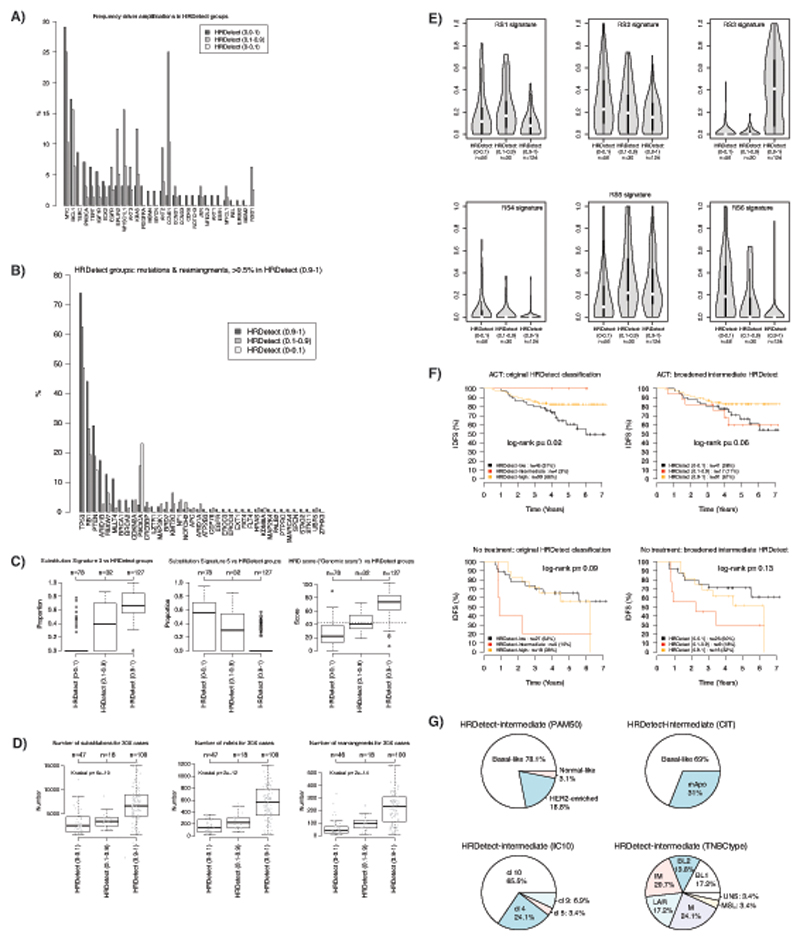
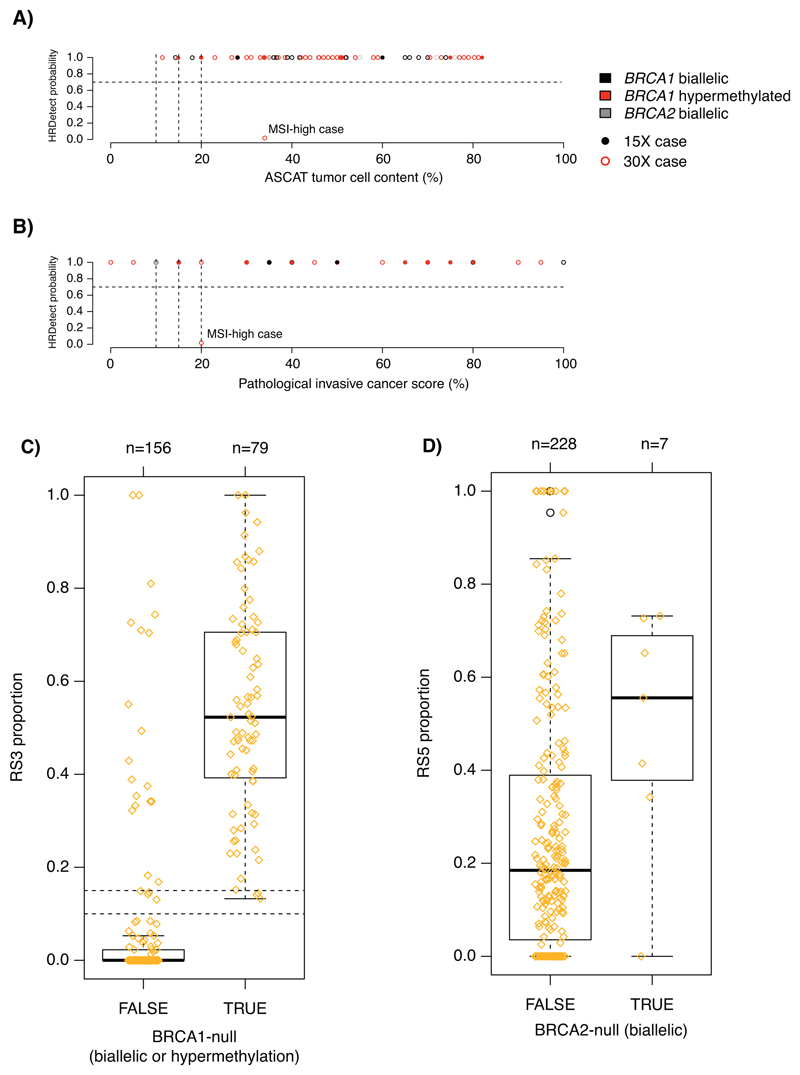
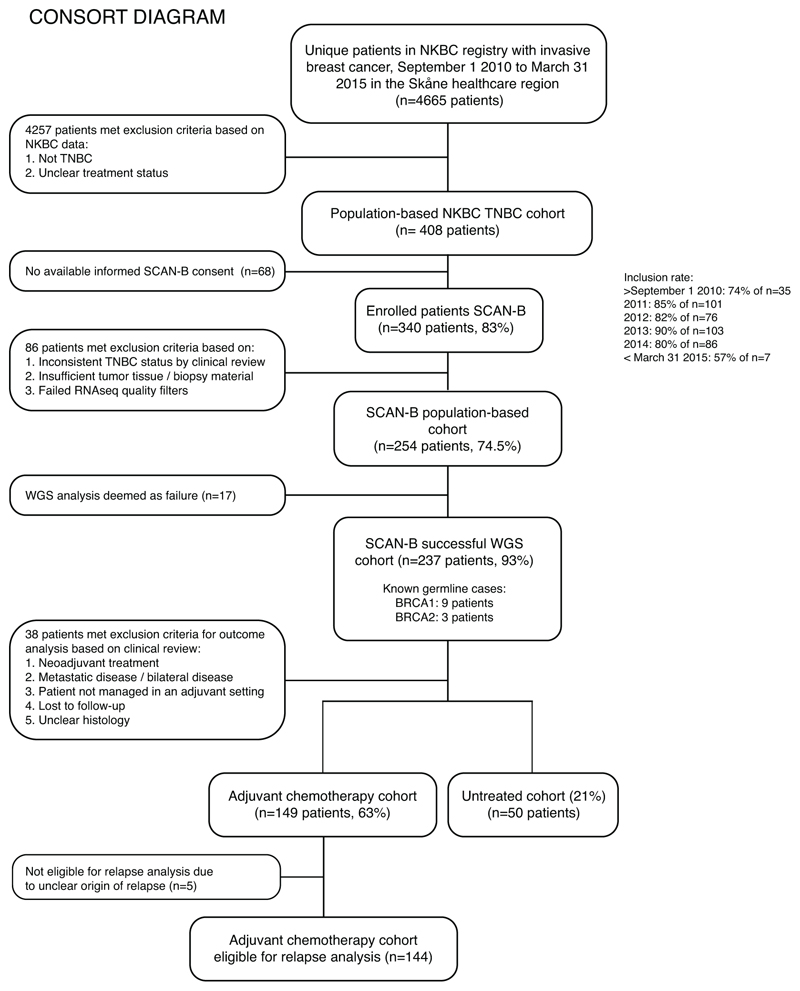
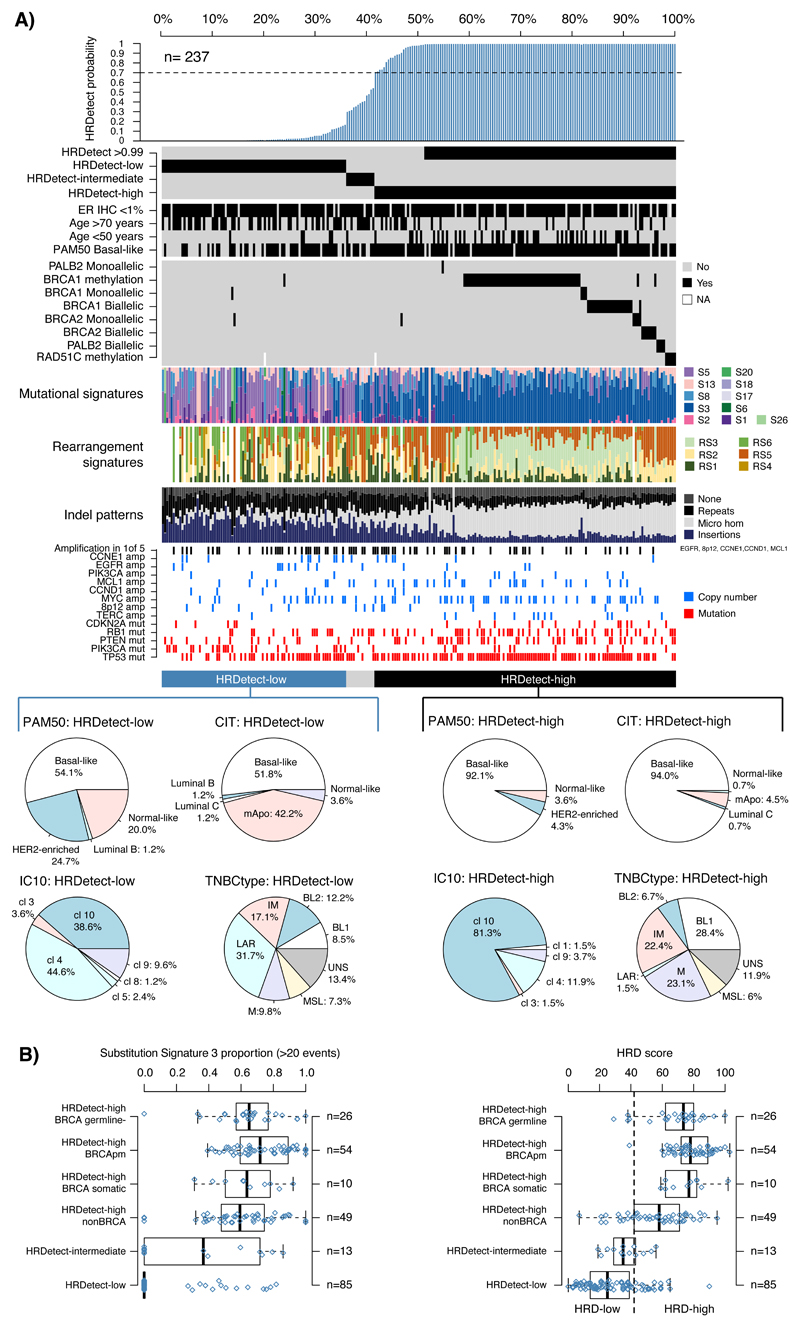
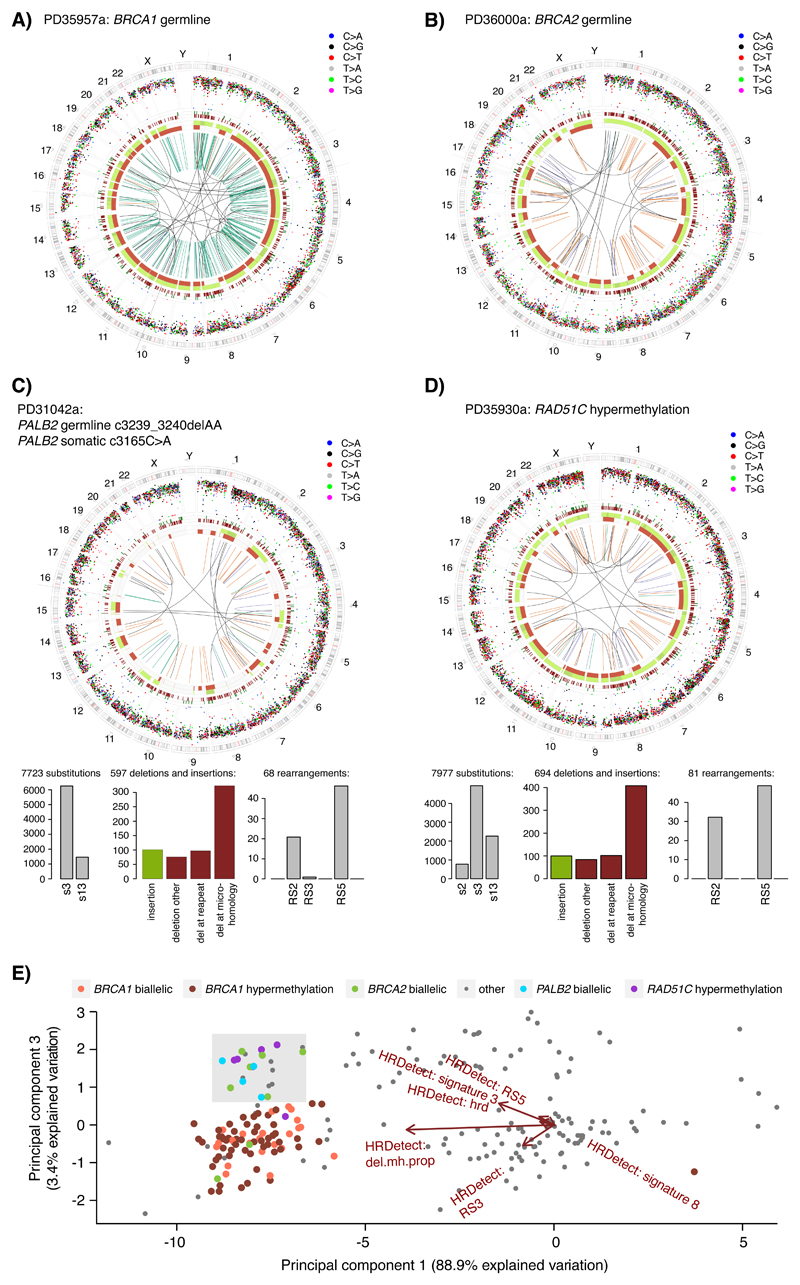
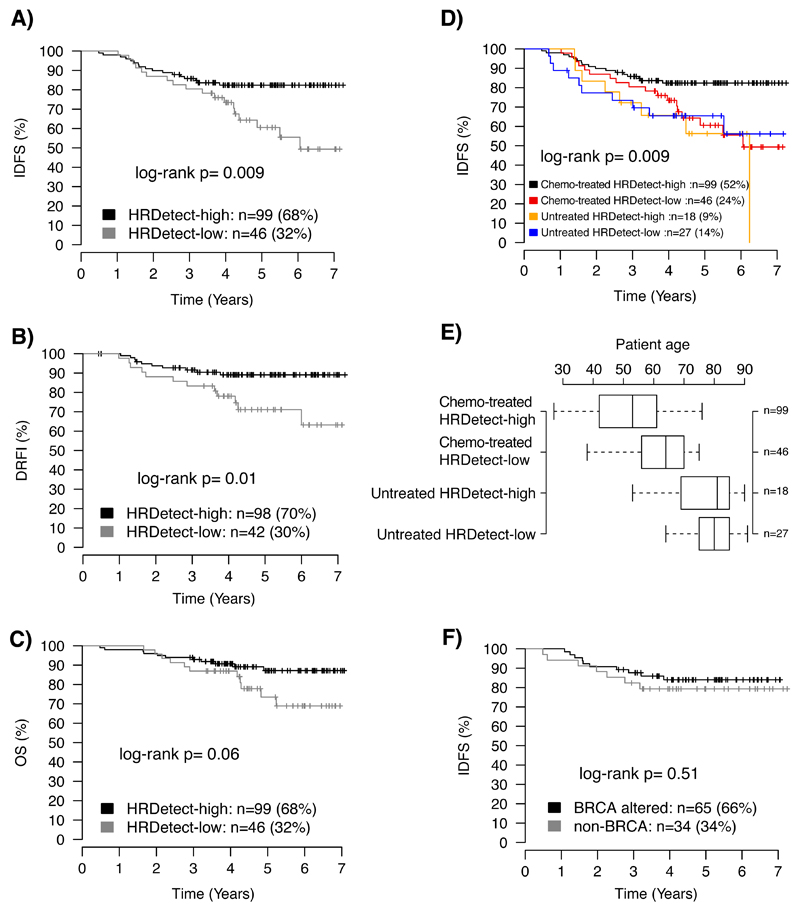
Whole-genome sequencing (WGS) brings comprehensive insights to cancer genome interpretation. To explore the clinical value of WGS, we sequenced 254 triple-negative breast cancers (TNBCs) for which associated treatment and outcome data were collected between 2010 and 2015 via the population-based Sweden Cancerome Analysis Network-Breast (SCAN-B) project (ClinicalTrials.gov ID:NCT02306096). Applying the HRDetect mutational-signature-based algorithm to classify tumors, 59% were predicted to have homologous-recombination-repair deficiency (HRDetect-high): 67% explained by germline/somatic mutations of BRCA1/BRCA2, BRCA1 promoter hypermethylation, RAD51C hypermethylation or biallelic loss of PALB2. A novel mechanism of BRCA1 abrogation was discovered via germline SINE-VNTR-Alu retrotransposition. HRDetect provided independent prognostic information, with HRDetect-high patients having better outcome on adjuvant chemotherapy for invasive disease-free survival (hazard ratio (HR) = 0.42; 95% confidence interval (CI) = 0.2-0.87) and distant relapse-free interval (HR = 0.31, CI = 0.13-0.76) compared to HRDetect-low, regardless of whether a genetic/epigenetic cause was identified. HRDetect-intermediate, some possessing potentially targetable biological abnormalities, had the poorest outcomes. HRDetect-low cancers also had inadequate outcomes: ~4.7% were mismatch-repair-deficient (another targetable defect, not typically sought) and they were enriched for (but not restricted to) PIK3CA/AKT1 pathway abnormalities. New treatment options need to be considered for now-discernible HRDetect-intermediate and HRDetect-low categories. This population-based study advocates for WGS of TNBC to better inform trial stratification and improve clinical decision-making.


Conflict of interest statement

Competing Interests

D. Glodzik, H.R. Davies and S. Nik-Zainal are inventors on a patent encompassing the code and intellectual principle of the HRDetect algorithm. The remaining authors declare that they have no competing interests.

Figures

Extended Data Fig. 1
Extended Data Fig. 1. Sweden Cancerome Analysis Network - Breast (SCAN-B).
In the Skåne healthcare region (Region Skåne) four main hospitals are participating in the SCAN-B study: Lund, Malmö, Helsingborg, and Kristianstad. (A) SCAN-B overall enrolment rate at all participating hospitals, including Skåne healthcare region, during September 1 2010 to March 31 2015, corresponding to the same time period from which the TNBC cases in the current study were selected. The statistics are restricted to the seven hospitals were enrolment was operational from the start in 2010. (B) Overall accrual rate per quarter of a year (Q1-Q4) for the SCAN-B study since the start in 2010 Q4 up until 2018 Q1. Red line corresponds to the cumulative number of enrolled patients, reaching nearly 12000 in 2018 Q1. (C) Illustration of the population-based nature of the SCAN-B study for primary resectable breast cancer. Based on data from the national breast cancer quality registry in Sweden (NKBC), a background population of primary resectable breast cancers from the entire SCAN-B catchment region during September 1 2010 to March 31 2015 was identified (same time period from which the TNBC cases in the current study were selected), comprising of 8587 patients. Of these 8587 patients, 5417 were enrolled in SCAN-B, with 3520 patients having RNA sequencing data passing basic quality criteria. The lower panels demonstrate the clinicopathological characteristics of the different subgroups in the consort diagram, demonstrating the representativity of the end RNA sequencing cohort compared to all enrolled SCAN-B patients and the total patient population in the catchment region. To note, the RNA sequencing cohort has a slightly lower inclusion of smaller tumors, due to that the SCAN-B tissue sampling is performed by a pathologist after enough tissue has been secured for routine diagnostics. (D) Demonstration of the year to year representativity of molecular subtypes in breast cancer (PAM50, top panel) and administered treatments based on data from the NKBC (lower panel) for patients identified in D. The bars show patients in the RNA sequencing cohort from D, stratified by year of diagnosis (all patients diagnosed a particular year are included). PAM50 subtyping was performed using the AIMS method (Paquet et al.) (as for the TNBC cases in the current study) as this classifier is a single sample classifier that does not rely on a mean centering of gene expression data across a cohort (thus is not sensitive to e.g. potential bias in year to year inclusion). ACT: adjuvant chemotherapy.
Extended Data Fig. 2
Extended Data Fig. 2. Similar genomic characteristics of SCAN-B TNBC cases compared to previously reported WGS analysed TNBCs
(A) Comparison of copy number alterations (CNA) as defined by Nik-Zainal et al. (Nature, 2016) in the 237 SCAN-B TNBC cases versus 162 TNBC cases from Nik-Zainal et al. (one case of 163 cases in total not analyzed). Frequencies below 0 means frequency of copy number loss. (B) Comparison of frequency of LOH defined as in Nik-Zainal et al. between the same SCAN-B cases and Nik-Zainal et al. TNBC cases. (C) Comparison of copy number neutral (cnn) LOH defined as in Nik-Zainal et al. between the same set of samples. (D) Comparison of the frequency of driver gene amplifications between the same set of samples. Only amplifications matched in both cohorts are displayed. Driver gene list was obtained from Nik-Zainal et al. (E) Comparison of the frequency of homozygous deletions based on ASCAT data, as described in Nik-Zainal et al., between the same set of samples. Only deletions matched in both cohorts showed. (F) Frequency of somatic substitutions and indels for driver genes from Nik-Zainal et al. in the two cohorts. Only genes with >1% mutation frequency in Nik-Zainal is displayed. (G) Exposure to mutation substitution signatures as defined in Nik-Zainal et al. for the same set of samples. Line corresponds to a 1:1 relationship. (H) Exposure to rearrangement signatures (RS1-RS6) as defined in Nik-Zainal et al. for the same set of samples. Line corresponds to a 1:1 relationship.
Extended Data Fig. 3
Extended Data Fig. 3. Clinicopathological and genomic characteristics of HRDetect groups
(A) Expression of the checkpoint proliferation (left), steroid (center), and basal (right) metagene from Fredlund et al. (Breast Cancer Research, 2012) across HRDetect groups stratified by BRCA-status. HRDetect-inter: intermediate subgroup. BRCA1pm: BRCA1 promoter hypermethylated. BRCAgerm: BRCA1/2 germline carriers. BRCAsom: BRCA1/2 somatic cases. (B) Distribution of patient age (left), Ki67 staining (%, center) and clinical grade (right) across the same groups (same set of patient numbers). (C) Distribution of number of detected substitutions (left), indels (center), and rearrangements (right) for the same groups limited to cases with 30X sequence coverage. Two-sided p-values were calculated using Kruskal-Wallis test. (D) Frequency of the genome altered by copy number gain and loss (CN-FGA, left), LOH (LOH-FGA, center), and copy number neutral LOH (cnnLOH-FGA, right) defined as in Nik-Zainal et al. (Nature, 2016). (E) Frequency of copy number gain (above zero centerline) and copy number loss across the genome for HRDetect-high tumors versus HRDetect-low tumors defined as in Nik-Zainal et al. HRDetect-intermediate tumors omitted due to small numbers. (F) Frequency of amplification of driver genes from Nik-Zainal et al. (Nature, 2016) across HRDetect groups (left) and putative homozygous deletions (HD) called using ASCAT (right) as defined in Nik-Zainal et al. (G) Comparison of somatic mutation frequency (substitutions, indels & curated rearrangements) for driver genes from Nik-Zainal et al. versus HRDetect groups. Two-sided p-values calculated using the Chi-square test. (H) Violin plot of the distribution of Rearrangement Signature (RS) proportions per sample defined in Nik-Zainal et al. versus HRDetect groups for patients with at least 20 called rearrangements. Violin plot line elements correspond to: i) center line = median, ii) thick limits = upper and lower quartiles, iii) whiskers = 1.5x interquartile range. In all box-plots the top axis shows the number of patients in each group. Box-plot elements correspond to: i) center line = median, ii) box limits = upper and lower quartiles, iii) whiskers = 1.5x interquartile range. Kruskal: Kruskal-Wallis test. ChiSq: Chi-square test. All calculated p-values are two-sided.
Extended Data Fig. 4
Extended Data Fig. 4. Unsupervised and supervised gene expression analyses versus HRDetect groups
In all analyses, raw expression data (FPKM) was offset by addition of +0.1, followed by log2 transformation prior to further analyzes. Only RefSeq annotated genes were used. 232 cases with gene expression were included in all analyses. In all consensus cluster analyses, clustering was performed using pearson correlation and ward.d2 linkage, with 2000 repetitions using the R ConsensusClusterPlus package. For PCA analyses pItem=0.8, and pFeature=0.98 were used in the consensus cluster function. For non-PCA analyses corresponding values were 0.8 and 0.8. (A) Consensus clustering of PCA components from PCA analysis of 19102 genes using a 2-group solution. Heatmap to the left shows consensus, with blue color indicating that samples often cluster together across repetitions (rows = samples = columns). Bars to the right show proportion of HRDetect groups in different consensus clusters according to the legend. PCA captures all variation in the data in different principal componets, on which clustering was performed. (B) Same as in A, but for a 3-group consensus solution. (C) Same as in A but for a 4-group solution. (D) Consensus clustering performed on 16364 genes with mean-centered log2 data as input (i.e. no PCA). HRDetect-high implies probabilities >0.7, HRDetect-low probabilities <0.2, i.e. according to main manuscript definitions. Heatmaps show the percentage of samples for a group in respective consensus clusters (x-axis), across different cluster solutions = y-axis. E.g., for HRDetect-high cases (left heatmap) using a k=2 solution, >70% of these tumors are located in cluster 1, together with 40-70% of HRDetect-low samples (as seen in right heatmap). (E) Same visualization as in D, but now for 6776 genes with a standard deviation >0.6. (F) Supervised prediction of HRDetect-high (prob >0.7) and HRDetect-low (prob<0.2) according to main manuscript definitions based on the top 10000 varying RefSeq genes across all 232 cases using 7 different types of machine learning methods. FPKM values were offset by +0.1, log2 transformed. 10000 most varying genes across all relevant cases were selected. For each method, cases were divided into training (70% of cohort) and test (30%), balanced for age, lymph node status, and grade. HRDetect-intermediate cases were omitted. Training and test cohorts were individually mean-centered. ROC was used as optimization metric, 4-fold cross validation repeated 10 times for training using the training cohort. The optimized model was applied to the test set. The entire procedure was repeated 10 times through an outer loop, with different division of samples in the training and test set in each loop to assure that sample selection was not skewing results. This generated for each model e.g. 10 ROC metrics as each outer loop iteration created a (potentially) new model. The summarized results are shown to the left. For all methods bar height corresponds to the average metric across the 10 iterations with one standard deviation range shown in red and individual values in orange. All analyses were performed using the Caret R-package using the classifier names indicated in the plot and with the tuneLength variable set to 10. (G) (G) The same analysis as in panel F, but instead using PCA components as input data for machine learning. PCA components were derived originally in panel A to capture all variation in the data and now used as input for supervised prediction using the same setup and parameters as in F. (H) Gene expression (log2(FPKM+offset)) of prototypical immunomarkers versus HRDetect groups. Two-sided P-values calculated using Kruskal-Wallis test. sd=standard deviation. In all box-plots the top axis shows the number of patients in each group. Box-plot elements correspond to: i) center line = median, ii) box limits = upper and lower quartiles, iii) whiskers = 1.5x interquartile range.
Extended Data Fig. 5
Extended Data Fig. 5. MMRd SCAN-B tumors
To note, unlike in colorectal cancer, mismatch repair deficient (MMRd) tumors are also able to carry signs of chromosomal or genomic instability as seen in PD31144a (BRCA1 promoter hypermethylated case) and PD31040a. Thus the mutational processes driving these two features are not mutually exclusive in breast cancer.
Extended Data Fig. 6
Extended Data Fig. 6. Characteristics of expanded HRDetect-intermediate cases
(A) Comparison of driver amplifications from Nik-Zainal et al. (Nature, 2016) between HRDetect groups defined from a broadened intermediate group (0.1-0.9 in HRDetect score). HRDetect (0.9-1) = 127 cases; HRDetect (0.1-0.9) = 32 cases; HRDetect (0-0.1) = 78 cases. (B) Comparison of somatic driver mutations (substitutions, indels) for driver genes defined in Nik-Zainal et al. (Nature, 2016). For the specific set of genes curated for rearrangements in Nik-Zainal et al. (e.g. RB1 and PTEN) these are included as events in the analysis (i.e., for instance RB1 includes both mutations and rearrangements). (C) Distribution of mutational signature exposure for signature s3 (e.3) and 5 (e.5) defined in Nik-Zainal et al. (Nature, 2016), and a HRD score defined by Telli et al. (Clinical Cancer Research, 2016) (originally based on SNP arrays, “genomic scars”) across HRDetect subgroups defined by a broadened intermediate group. In all box-plots the top axis shows the number of patients in each group. Box-plot elements correspond to: i) center line = median, ii) box limits = upper and lower quartiles, iii) whiskers = 1.5x interquartile range. (D) Distribution of total number of detected substitutions, indels, and rearrangements for 30X sequenced cases across HRDetect subgroups defined by a broadened intermediate group. In all box-plots the top axis shows the number of patients in each group. Box-plot elements correspond to: i) center line = median, ii) box limits = upper and lower quartiles, iii) whiskers = 1.5x interquartile range. Two-sided p-values were calculated using Kruskal-Wallis test. (E) Distribution of exposure (displayed as a violin plot) to the six rearrangement signatures defined in Nik-Zainal et al. (Nature, 2016) versus HRDetect subgroups defined by a broadened intermediate group. Only cases with at least 20 rearrangements are included in the plots. Violin plot line elements correspond to: i) center line = median, ii) thick limits = upper and lower quartiles, iii) whiskers = 1.5x interquartile range. (F) Outcome analysis for original HRDetect-groups (left panels) and new division with a broadened HRDetect-intermediate group (right panels) stratified by treatment status using invasive disease-free survival (IDFS) as clinical endpoint. Top two panels show IDFS for patients receiving adjuvant chemotherapy (ACT) and bottom two panels show IDFS for untreated patients according to division by HRDetect score. Log-rank p-values are two-sided. (G) Distribution of different molecular subtypes in the broadened HRDetect-intermediate group based on 232 cases with gene expression data. mApo: molecular apocrine, BL1, basal-like 1: BL 2, basal-like 2: IM, immunomodulatory: M, mesenchymal: MSL, mesenchymal stem-like: LAR, luminal androgen receptor : UNS, uncertain.
Extended Data Fig. 7
Extended Data Fig. 7. Tumor cellularity versus HRDetect probability scores and characteristic rearrangement signature proportions for BRCA1-null (biallelic alteration or promoter hypermethylation) and BRCA2-null (biallelic alterations) tumors.
(A) HRDetect probabilities versus WGS estimated tumor cell content based on the ASCAT algorithm (n=84 cases). (B) HRDetect probabilities versus a pathological assessment of the invasive cancer proportion from a section adjacent to the extracted tumor piece (n=67 cases). Tumors are further stratified by their intended sequencing depth (30X or 15X) in panels A-B. (C) Proportions of the Rearrangement Signature 3 (Nik-Zainal et al. Nature 2016) for BRCA1-null cases. (D) Proportions of the Rearrangement Signature 5 for BRCA2-null cases. One outlier exists, corresponding to a tumor with concurrent BRCA1 hypermethylation that has a genetic phenotype very similar to a BRCA1-null tumor rather than a BRCA2-null tumor, as shown in panel. In all box-plots the top axis shows the number of patients in each group. Box-plot elements correspond to: i) center line = median, ii) box limits = upper and lower quartiles, iii) whiskers = 1.5x interquartile range.
Figure 1
Figure 1. CONSORT diagram of the study.
CONSORT diagram for patients identified during September 1 2010 to March 31 2015 in the Skåne healthcare region with four participating SCAN-B sites: Lund, Malmö, Helsingborg, and Kristianstad. NKBC: Swedish national breast cancer quality registry.
Figure 2
Figure 2. HRDetect classification and genomic characteristics in population-based TNBC.
(A) Bar plot of HRDetect probability obtained in 237 TNBCs together with clinical and genomic characteristics obtained from WGS and RNAseq. Annotation tracks for samples include from top to bottom ER IHC scoring, patient age, the basal-like phenotype from PAM50 classification, and genetic alterations in homologous recombination associated genes (BRCA1, BRCA2, PALB2, RAD51C). Further, proportions of mutational and rearrangement signatures and indel patterns are shown as bar plots. Mutations and copy number amplifications in key oncogenes and tumor suppressors are represented for individual samples. Molecular subtype proportions in HRDetect-high and HRDetect-low cases for PAM50, CIT, IC10, and TNBCtype are represented by pie charts. Intermediary samples excluded due to low numbers. CIT subtypes; mApo, molecular apocrine. IC10 subtypes; cl (IntClust) 10 corresponding to basal-like tumors by other subtyping schemes. TNBCtype subtypes; BL1, basal-like 1: BL 2, basal-like 2: IM, immunomodulatory: M, mesenchymal: MSL, mesenchymal stem-like: LAR, luminal androgen receptor: UNS, uncertain. (B) Proportions of mutational signature 3 (in tumors with >20 events) and HRD scores according to Telli et al. across subgroups defined first by HRDetect class (-low, -intermediate, and –high), where the HRDetect-high subgroup is further divided into whether BRCA1/BRCA2 was inactivated by a germline mutation, somatic mutation, promoter hypermethylation, or no mutation was identified. Right axes in box-plots shows the number of patients in each group. Box-plot elements correspond to: i) center line = median, ii) box limits = upper and lower quartiles, iii) whiskers = 1.5x interquartile range
Figure 3
Figure 3. Genetic characteristics of RAD51C- and PALB2- altered TNBCs.
(A) Circos plot of a BRCA1 germline altered TNBC case classified as HRDetect-high. Circos plot depicting from outermost rings heading inwards: Karyotypic ideogram outermost. Base substitutions next, plotted as rainfall plots (log10 intermutation distance on radial axis, dot colours: blue, C>A; black, C>G; red, C>T; grey, T>A; green, T>C; pink, T>G). Ring with short green lines, insertions; ring with short red lines, deletions. Major copy number allele ring (green, gain), minor copy number allele ring (red, loss), Central lines represent rearrangements (green, tandem duplications; red, deletions; blue, inversions; grey, interchromosomal events). (B) Circos plot of a BRCA2 germline altered TNBC case classified as HRDetect-high. (C) Circos plot and mutational signatures of a PALB2 biallelic altered TNBC case classified as HRDetect-high, histograms below show distribution of substitution signatures (left), rearrangement signatures (right), and deletions and insertions (center) as defined in. Del: deletion. (D) Circos plots and mutational signatures of a RAD51C hypermethylated TNBC case classified as HRDetect-high. (E) Principal component analysis (PCA) of the six normalized HRDetect components for the 237 TNBC cases annotated by their BRCA1, BRCA2, PALB2, or RAD51C status. The plot displays PCA component 1 and 3 (accounting for 92.3% of variation across the six HRDetect components), showing the separation of biallelic BRCA2, biallelic PALB2, and RAD51C hypermethylated cases into a common sector (light grey), indicating similarities of HRDetect features.
Figure 4
Figure 4. Association of HRDetect classification with clinical outcomes in an unselected population-based TNBC cohort.
Kaplan-Meier analysis of association with outcome for HRDetect classification in TNBC patients treated with standard-of-care adjuvant chemotherapy (ACT) for (A) distant relapse-free interval (DRFI) as endpoint, (B) invasive disease-free survival (IDFS) as endpoint, and (C) overall survival (OS) as endpoint. (D) Invasive disease-free survival (IDFS) as endpoint showing both adjuvantly treated and untreated patients stratified by HRDetect status. (E) Distribution of patient age between HRDetect high and low groups stratified by treatment and eligibility for IDFS analysis. Box-plot elements correspond to: i) center line = median, ii) box limits = upper and lower quartiles, iii) whiskers = 1.5x interquartile range. Right axis provides number of patients in each group. (F) Kaplan-Meier analysis of association with IDFS of HRDetect-high group demonstrating no significant difference between subjects where BRCA alterations were and were not identified. All p-values in panels A-F were calculated using the log-rank test and are two-sided.

References

    1. Bentley DR, et al. Accurate whole human genome sequencing using reversible terminator chemistry. Nature. 2008;456:53–59. doi: 10.1038/nature07517. - DOI - PMC - PubMed
    1. Nik-Zainal S, et al. Mutational processes molding the genomes of 21 breast cancers. Cell. 2012;149:979–993. doi: 10.1016/j.cell.2012.04.024. S0092-8674(12)00528-4 [pii] - DOI - PMC - PubMed
    1. Nik-Zainal S, et al. The life history of 21 breast cancers. Cell. 2012;149:994–1007. doi: 10.1016/j.cell.2012.04.023. S0092-8674(12)00527-2 [pii] - DOI - PMC - PubMed
    1. Coe BP, et al. Resolving the resolution of array CGH. Genomics. 2007;89:647–653. - PubMed
    1. Ryden L, et al. Minimizing inequality in access to precision medicine in breast cancer by real-time population-based molecular analysis in the SCAN-B initiative. Br J Surg. 2018;105:e158–e168. doi: 10.1002/bjs.10741. - DOI - PMC - PubMed

Publication types

MeSH terms

Associated data